


前言
拿到一份陌生的 C 工程,想要了解整个工程的脉络,你会使用什么方法呢?
函数调用
一般都是通过函数调用关系来理清整个工程的运作流程,通常使用的软件是 source insight。从 main 函数开始,查看 main 函数调用了哪些函数,然后进入各个子函数。以此类推,逐渐展开整个脉络。我之前也是一直使用这种方法,我称之为“人肉整理”。这种方法是很耗时的,一个不大的工程就可能要整理大半天。从那时起,我就时常想,有没有自动化的软件来干这个事情?后来找到了一款:calltree,听名字就知道它的功能了,“调用树”,用来理清函数调用关系的。不过,该款软件早已停更,版本较老,用起来不太顺手。
cflow
后来又发现了一款:cflow。在 ubuntu 下直接使用命令就可以安装该软件,如下
sudo apt install cflow
cflow 能够分析 C 文件中的控制流,看个例子
$ cflow -T log.c
+-log_init() <void log_init (void) at log.c:193>
  +-InitializeCriticalSection()
  +-wget_console_init()
  +-wget_logger_set_func()
  +-wget_get_logger()
  +-write_debug_stderr() <void write_debug_stderr (const char *data, size_t len) at log.c:157>
  | \-write_debug() <void write_debug (FILE *fp, const char *data, size_t len) at log.c:138>
  |   \-write_out() <void write_out (FILE *default_fp, const char *data, size_t len, int with_timestamp, const char *colorstring, wget_console_color color_id) at log.c:55>
  |     +-strcmp()
  |     +-open()
  |     +-wget_buffer_init()
  |     +-isatty()
  |     +-fileno()
  |     +-wget_buffer_strcpy()
  |     +-gettime()
  |     +-localtime_r()
  |     +-wget_buffer_printf_append()
  |     +-wget_buffer_memcat()
  |     +-wget_buffer_strcat()
  |     +-fwrite()
  |     +-EnterCriticalSection()
  |     +-wget_console_set_fg_color()
  |     +-fflush()
  |     +-wget_console_reset_fg_color()
  |     +-LeaveCriticalSection()
  |     +-write()
  |     +-close()
  |     \-wget_buffer_deinit()
...
tree2dotx
为了更直观地展示函数调用关系,我们可以使用 xdot 工具。不过使用 xdot 工具地前提是我们必须要有一份用 xdot 格式表示节点地文件。这就需要使用另外一个工具 tree2dotx,可以从这里获取,将其存为 tree2dotx 文件,然后放入系统路径。
运行一下看看效果
$ cflow log.c | tree2dotx
digraph G{
ranksep = 1;
	rankdir=LR;
	size="1920,1080";
	node [fontsize=16,fontcolor=blue,style=filled,fillcolor=Wheat,shape=box];
	"log_init" -> "InitializeCriticalSection";
	"log_init" -> "wget_console_init";
	"log_init" -> "wget_logger_set_func";
	"log_init" -> "wget_get_logger";
	"log_init" -> "write_debug_stderr";
	"write_debug_stderr" -> "write_debug";
	"write_debug" -> "write_out";
	"write_out" -> "strcmp";
	"write_out" -> "open";
	"write_out" -> "wget_buffer_init";
	"write_out" -> "isatty";
	"write_out" -> "fileno";
	"write_out" -> "wget_buffer_strcpy";
	"write_out" -> "gettime";
	"write_out" -> "localtime_r";
...
}
xdot
xdot 功能能够以图形的方式展示节点之间的关系,在 ubuntu 下使用 apt 命令就可以安装
sudo apt install xdot
运行看下效果
$ cflow log.c | tree2dotx > out.dot
$ xdot out.dot
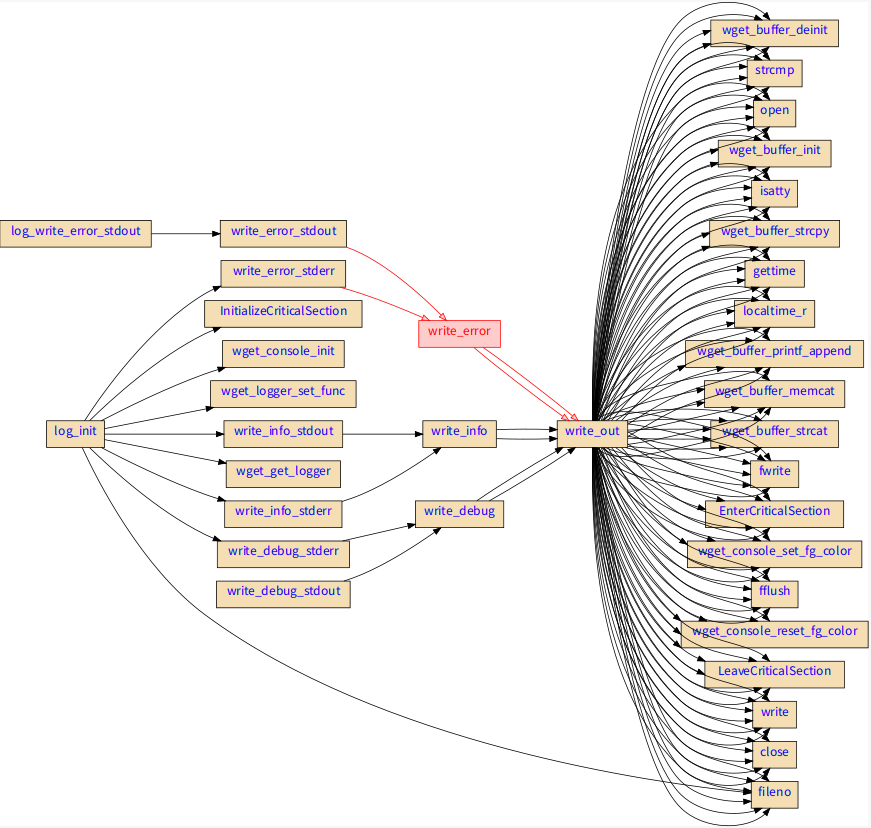
可以非常直观的看到 log.c 文件中的函数调用关系,鼠标放在某个函数上,前后的箭头还会变成红色,用来指示被调用和调用关系。
优化
上述 tree2dotx 脚本其实是有点问题的,我对它做了一些优化,如下
- 去重。经过 tree2dotx 处理过的节点,有重复的,导致连线翻倍,去重后效果如下,和上面对比是不是简洁多了
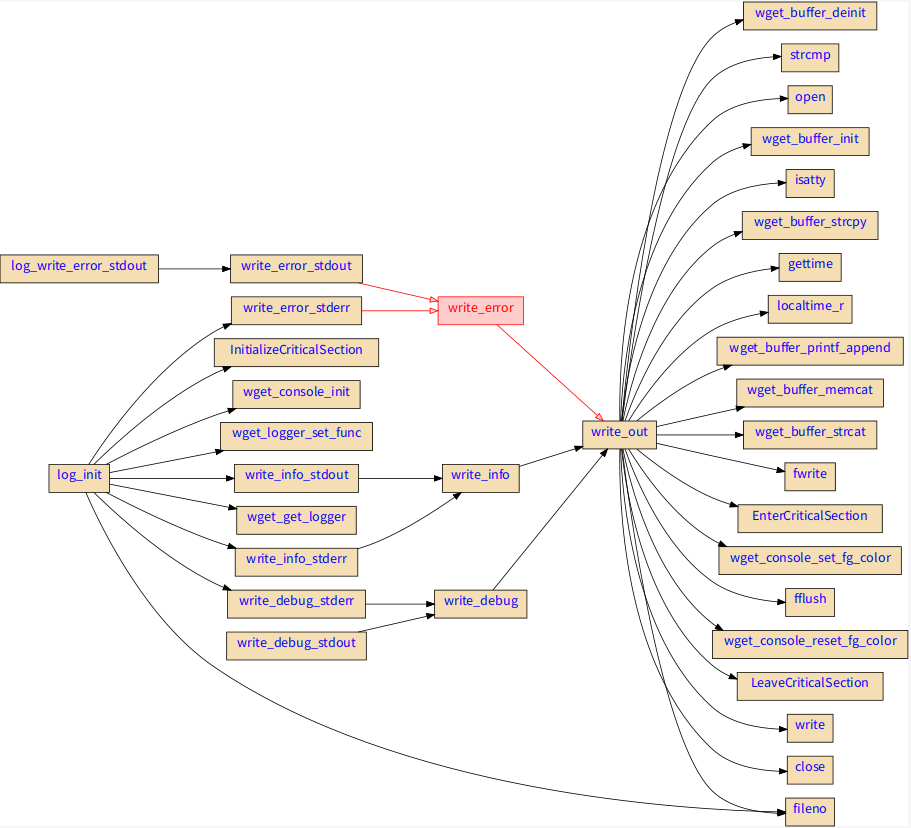
命令如下
cflow log.c | tree2dotx | awk '!a[$0]++' > out.dot
- 去除多余空格
原始 tree2dotx 脚本在将函数调用关系转成节点时,有些函数后面多出了一个空格,将脚本中的sed -e "s/<.*>.*//g" | tr -d '\(' | tr -d '\)' | tr '|' ' '改成sed -e "s/ <.*>.*//g" | tr -d '\(' | tr -d '\)' | tr '|' ' ',就可以了。 - 增加子节点
这样就可以显示当前函数属于哪个 C 文件了
附件
优化后的 tree2dotx 完整代码
$ cat /usr/local/bin/tree2dotx
#!/bin/bash
#
# tree2dotx --- transfer a "tree"(such as the result of tree,calltree,cflow -b)
#                 to a picture discribed by DOT language(provided by Graphviz)
#
# Author: falcon <wuzhangjin@gmail.com>
# Update: 2007-11-14, 2015-3-19
# Usage:
#
#       tree -L 2 -d /path/to/a/directory | bash tree2dotx | dot -Tsvg -o tree.svg
#       cd /path/to/a/c/project/; calltree -gb -np -m *.c | bash tree2dotx | dot -Tsvg -o calltree.svg
#       cd /path/to/a/c/project/; cflow -b -m setup_rw_floppy kernel/blk_drv/floppy.c | bash tree2dotx | dot -Tsvg -o cflow.svg
#

# Set the picture size, direction(LR=Left2Right,TB=Top2Bottom) and shape(diamond, circle, box)
size="1920,1080"
direction="LR"
shape="box"

# color, X11 color name: http://en.wikipedia.org/wiki/X11_color_names
fontcolor="blue"
fillcolor="Wheat"

# fontsize
fontsize=16

# Specify the symbols you not concern with space as decollator here
filterstr="";

input=`cat`

# output: dot, flame
output="dot"

has_subgraph="0"
ordering="0"

# Usage

#grep -v ^$ | cat

function usage
{
        echo ""
        echo "  $0 "
        echo ""
        echo "     [ -f  \"filter1 filter2 ...\" ]"
        echo "     [ -s  size, ex: 1080,760; 1920,1080 ]"
        echo "     [ -d  direction, ex: LR; TB ]"
        echo "     -h  get help"
        echo ""
}

function subgraph() {
	echo "$input" \
	| grep -e " at " \
	| sed 's/).* at /)/g;s/:.*//g;s/ //g' \
	| sed -r 's/^(.*)\(\)(.*)$/\tsubgraph "cluster_\2" { label="\2";\1;}/' \
	| sort -u
}

while getopts "f:s:S:d:e:h:o:r:" opt;
do
        case $opt in
                f)
                        filterstr=$OPTARG
                ;;
                s)
                        size=$OPTARG
                ;;
                S)
                        shape=$OPTARG
                ;;
                d)
                        direction=$OPTARG
                ;;
                e)
                        has_subgraph=$OPTARG
		;;
		o)
                        output=$OPTARG
                ;;
 		r)
                        ordering=$OPTARG
                ;;
                h|?)
                        usage $0;
                        exit 1;
                ;;
        esac
done

# Transfer the tree result to a file described in DOT language

echo "$input" | \
grep -v ^$ | grep -v "^[0-9]* director" \
| sed -e "s/ <.*>.*//g" | tr -d '\(' | tr -d '\)' | tr '|' ' ' \
| sed -e "s/ \[.*\].*//g" \
| awk '{if(NR==1) system("basename "$0); else printf("%s\n", $0);}' \
| awk -v fstr="$filterstr" '# function for filter the symbols you not concern
        function need_filter(node) {
                for ( i in farr ) {
                    if (match(node,farr[i]" ") == 1 || match(node,"^"farr[i]"$") == 1) {
                            return 1;
                    }
                }
                return 0;
        }
        BEGIN{
                # Filternode array are used to record the symbols who have been filtered.
                oldnodedepth = -1; oldnode = ""; nodep[-1] = ""; filter[nodep[-1]] = 0;
                oldnodedepth_orig = -1; nodepre = 0; nodebase = 0; nodefirst = 0;
                output = "'$output'";

                #printf("output = %s\n", output);

                # Store the symbols to an array farr
                split(fstr,farr," ");

                # print some setting info
                if (output == "dot") {
                    printf("digraph G{\n");

		    if(ordering == "1") {
		    	printf("ordering=out;\n");
	    	    }
		    printf("ranksep = 1;\n");

		    printf("\trankdir='$direction';\n");
                    printf("\tsize=\"'$size'\";\n");
                    printf("\tnode [fontsize='$fontsize',fontcolor='$fontcolor',style=filled,fillcolor='$fillcolor',shape='$shape'];\n");
                }
        }{
                # Get the node, and its depth(nodedepth)
                # nodedepth = match($0, "[^| `]");
                nodedepth = match($0, "[[:digit:]|[:alpha:]]|[[:alnum:]]");
                node = substr($0,nodedepth);

                # printf("%d %d %s \n", nodedepth, oldnodedepth_orig, node);
                if (nodefirst == 1 && oldnodedepth_orig > 0) {
                        nodefirst = 0;
                        nodebase = nodedepth-oldnodedepth_orig;
                }

                if (nodedepth == 0)
                        nodedepth=1;

                tmp = nodedepth;
                # printf("pre=%d base=%d np=%d oldnp=%d node=%s \n", nodepre, nodebase, tmp, oldnodedepth_orig, node);

                if (nodedepth != 0 && oldnodedepth_orig == -1) {
                        nodepre = nodedepth-1;
                        nodefirst = 1;
                        nodedepth = 0;
                } else if (nodebase != 0) {
                        nodedepth = int((nodedepth-nodepre)/nodebase);
                }

                # if whose depth is 1 less than him, who is his parent
                if (nodedepth-oldnodedepth == 1) {
                        nodep[nodedepth-1] = oldnode;
                }

                # for debugging
                # printf("%d %s\n", nodedepth, node);
                # printf("\t\"%s\";\n",node);
                # print the vectors

                if (oldnodedepth != -1) {
                        # if need filter or whose parent have been filter, not print it, and set the flat of filter to 1
                        if (need_filter(node) || filter[nodep[nodedepth-1]] == 1) {
                                filter[node] = 1;
                        #       printf("node = %s, filter[node] = %d\n", node, filter[node]);
			} else if (nodep[nodedepth-1] != "") {
                                if (output == "dot") {
                                    printf("\t\"%s\" -> \"%s\";\n", nodep[nodedepth-1], node, nodep[nodedepth-1], node);
                                } else {
                                    for (i = 0; i < nodedepth; i++)
                                        printf("%s;", nodep[i]);
                                    printf("%s 1\n", node);
                                }
                        #       printf("\t\"%s\" -> \"%s\"[label=\"%s>%s\"];\n", nodep[nodedepth-1], node, nodep[nodedepth-1], node);
                        }
                }

                # save the old depth and the old node
                oldnodedepth_orig = tmp;
                oldnodedepth = nodedepth;
                oldnode = node;
        } END {
#                if (output == "dot")
#			printf("}");
        }'

echo ""
if [ $has_subgraph == "1" ]
then
	subgraph
fi
echo "}"
cflow -d 3 wget.c | tree2dotx -e 1 -r 1 | awk '!a[$0]++' > out.dot && cat out.dot
tree2dotx -e 0/1 指定是否展示子图(函数所在文件)
tree2dotx -r 0/1 指定是否按照函数出现顺序展示图像
图像
还可以将 xdot 显示的图像输出为图片
dot -Tgif out.dot -o out.gif
一些问题
-
cflow 能同时分析一个源文件中多个函数的 call graph 吗?
答:cflow 默认只分析 main 函数的 call graph,如果 main 不存在,将分析该文件的所有函数。可以通过 -m 选项分析指定的函数,如果指定的函数不存在,也会分析该文件的所有函数。可以利用这个特点,通过 -m 指定一个空的函数名,让 cflow 分析所有函数的 call graph,如:# cflow -m= file1.c -
cflow 可以同时分析多个源文件吗?
答:可以,使用如下两种命令都可以:# cflow -m= file1.c file2.c # cflow -m= *.c需要注意的是,如果多个源文件出现同名函数,cflow 会警告,并且只分析其中一个 main 函数。
-
cflow 输出内容为空
使用 --verbose 选项调试
参考
https://graphviz.gitlab.io/_pages/pdf/dotguide.pdf
https://blog.csdn.net/qq_23599965/article/details/88839012


 2791
2791

 被折叠的 条评论
为什么被折叠?
被折叠的 条评论
为什么被折叠?
 到【灌水乐园】发言


