


前端数据处理中往往会做数据过滤
下边是个简单的例子。
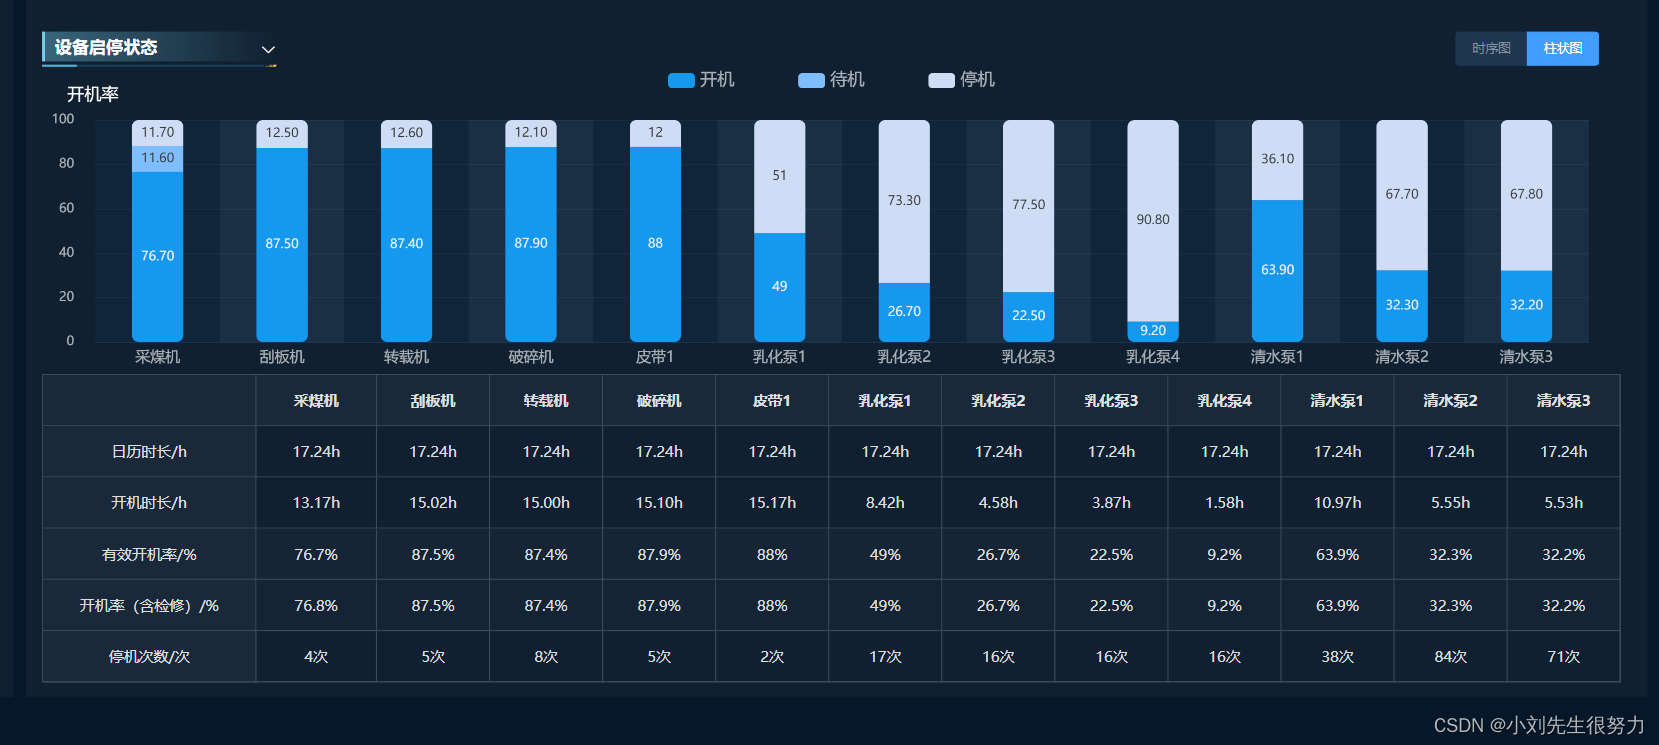
我这是echarts 图数据
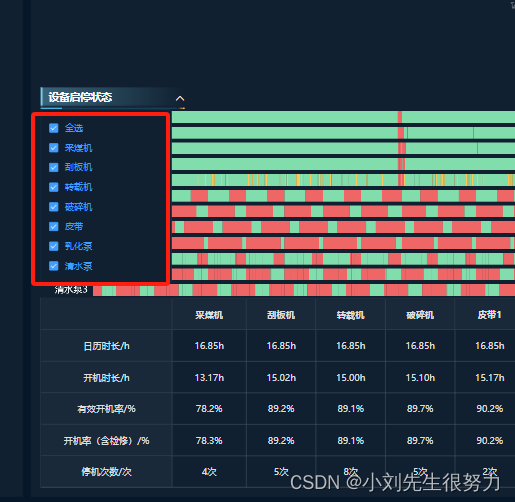
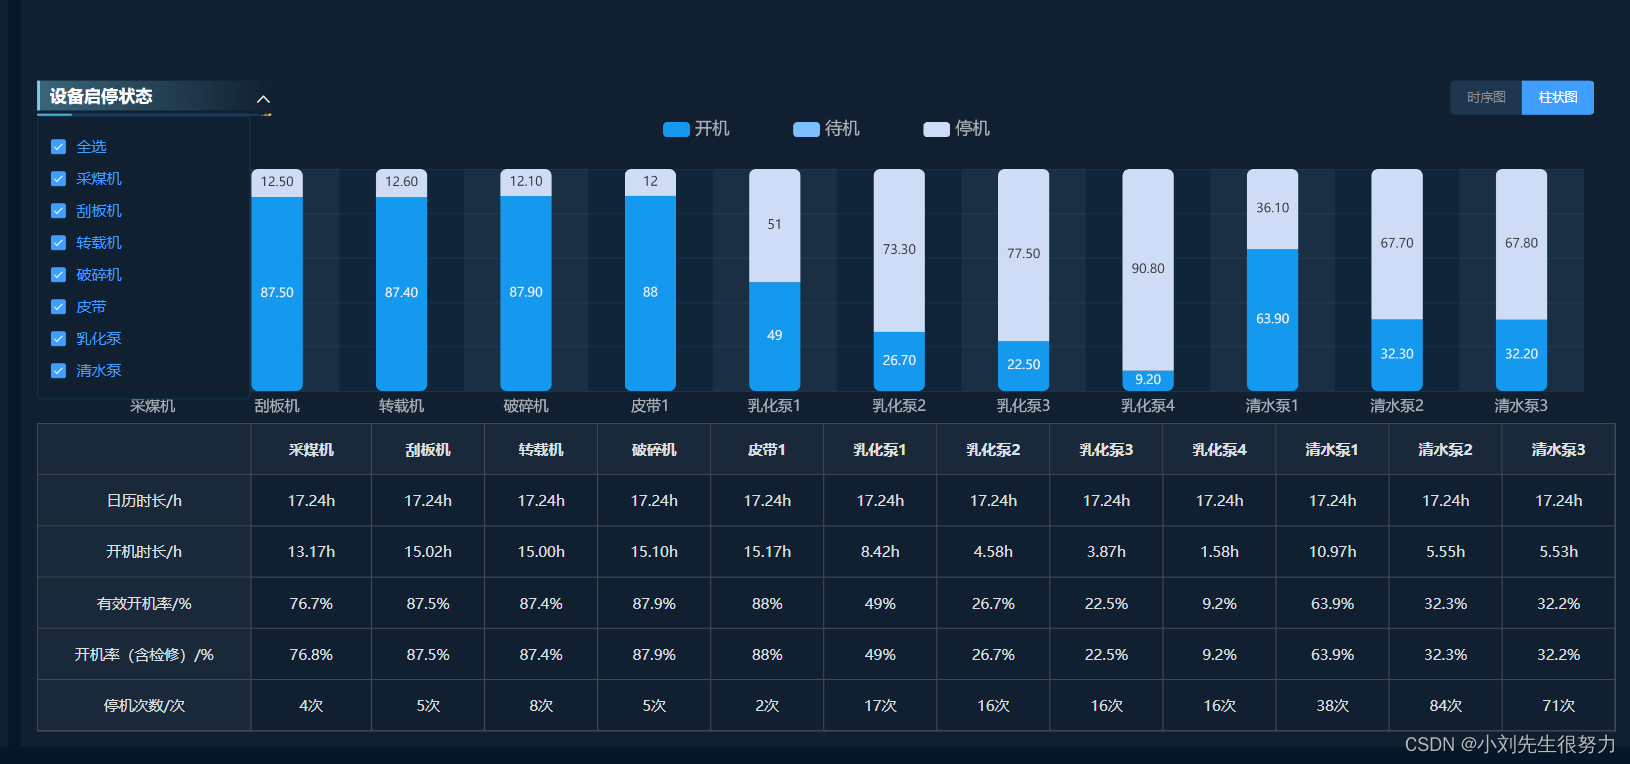
当单选选中或者全选是都要改变选中的数据 value【】
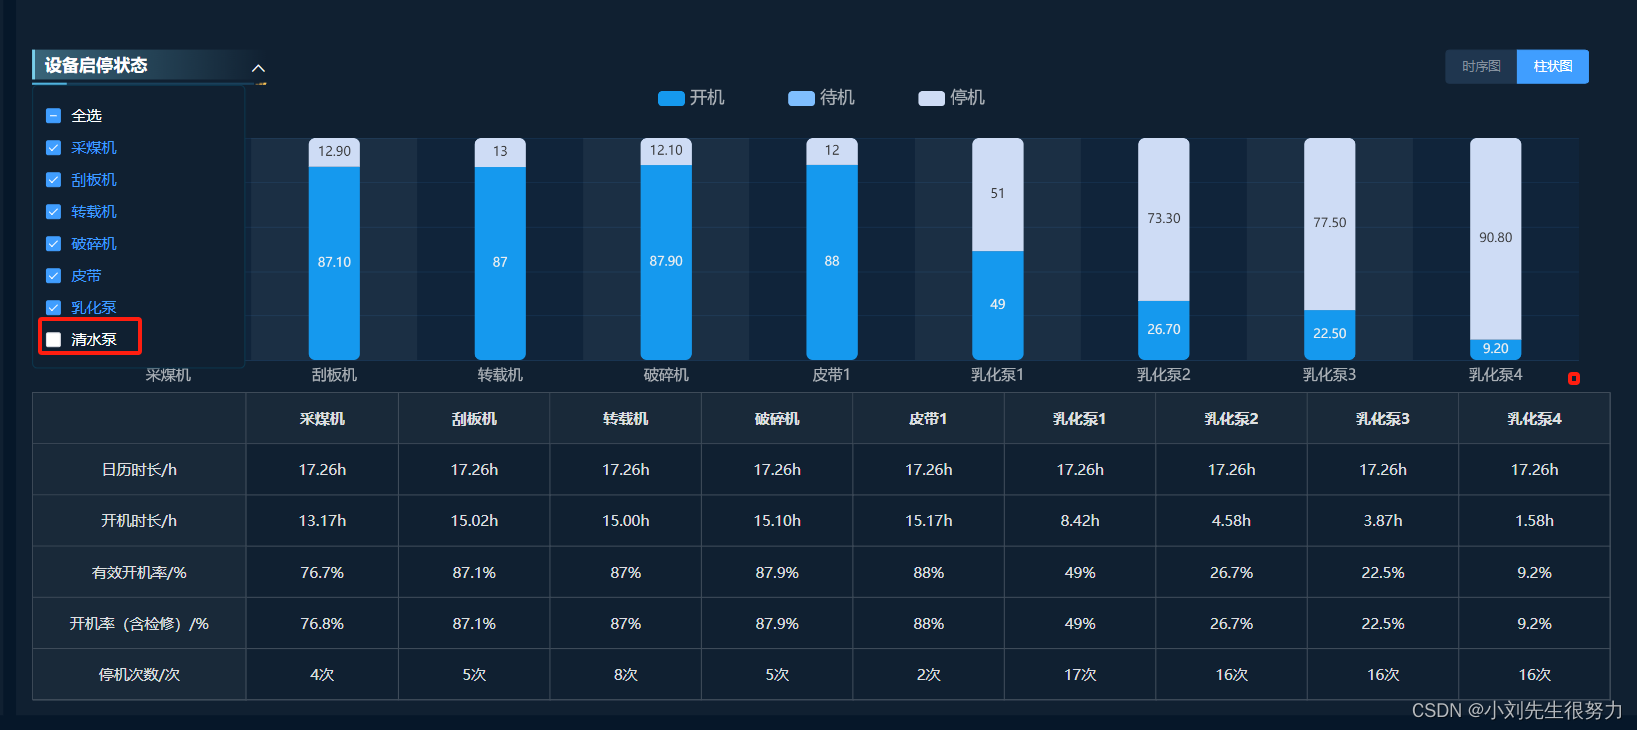
我这里是用选中的数据在和默认的数据进行比对,然后去用接口返回的数据处理过滤
下边的例子看需求
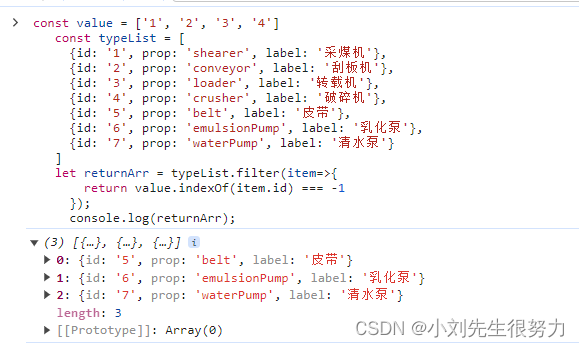
区别在于 value.indexOf(item.id) === -1 还是 value.indexOf(item.id) !==-1
const value = ['1', '2', '3', '4']
const typeList = [
  {id: '1', prop: 'shearer', label: '采煤机'},
  {id: '2', prop: 'conveyor', label: '刮板机'},
  {id: '3', prop: 'loader', label: '转载机'},
  {id: '4', prop: 'crusher', label: '破碎机'},
  {id: '5', prop: 'belt', label: '皮带'},
  {id: '6', prop: 'emulsionPump', label: '乳化泵'},
  {id: '7', prop: 'waterPump', label: '清水泵'}
]
let returnArr = typeList.filter(item=>{
    return value.indexOf(item.id) === -1  // 得到
  });
  console.log(returnArr);
const value = ['1', '2', '3', '4']
const typeList = [
  {id: '1', prop: 'shearer', label: '采煤机'},
  {id: '2', prop: 'conveyor', label: '刮板机'},
  {id: '3', prop: 'loader', label: '转载机'},
  {id: '4', prop: 'crusher', label: '破碎机'},
  {id: '5', prop: 'belt', label: '皮带'},
  {id: '6', prop: 'emulsionPump', label: '乳化泵'},
  {id: '7', prop: 'waterPump', label: '清水泵'}
]
let returnArr = typeList.filter(item=>{
    return value.indexOf(item.id) !== -1
  });
  console.log(returnArr);
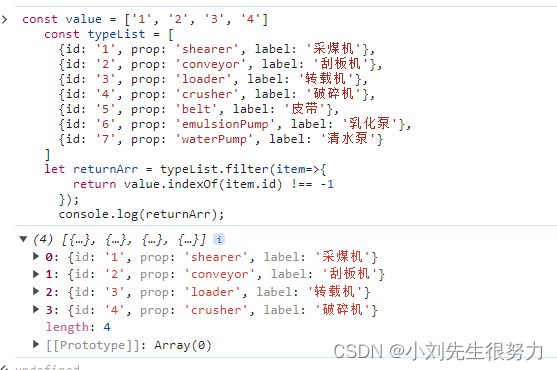
我这里用的是 !==-1
然后去处理数据
   newData = data.filter(item => {
  return filterData.find(el => {
    return el.prop === item.deviceType
  })
})
完整代码
<template>
<section class="device-box">
<Titles />
<div class="container">
<sidebar @setDate="getDate"></sidebar>
<div class="content">
<div v-if="dateInfo.id === 1" class="track-box">
<mode-title title="煤机轨迹" />
<zmj-Echarts
:isEchartAbsolute="true"
echartsId="trackLine"
ref="trackLine"
class="trackLine"
></zmj-Echarts>
</div>
<div class="wrapper">
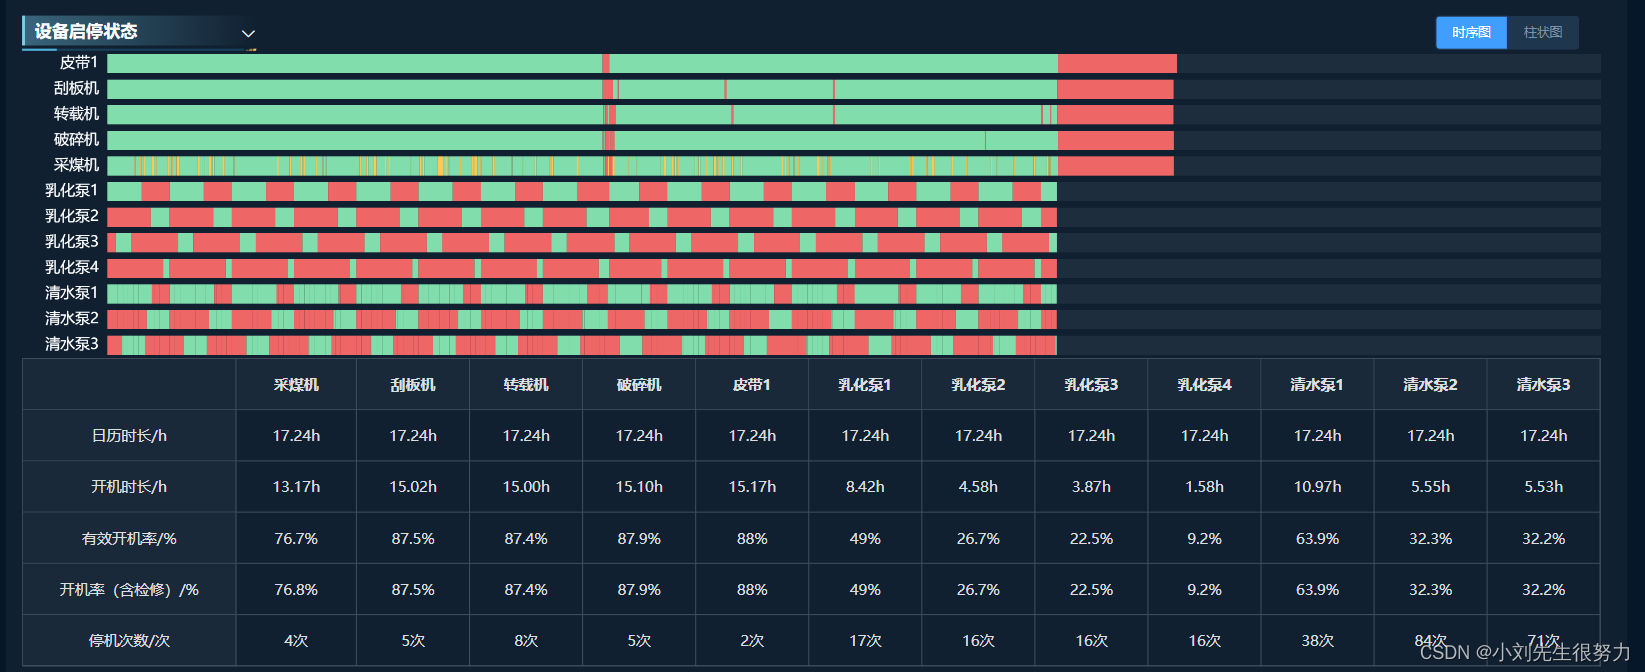
<mode-title title="设备启停状态"></mode-title>
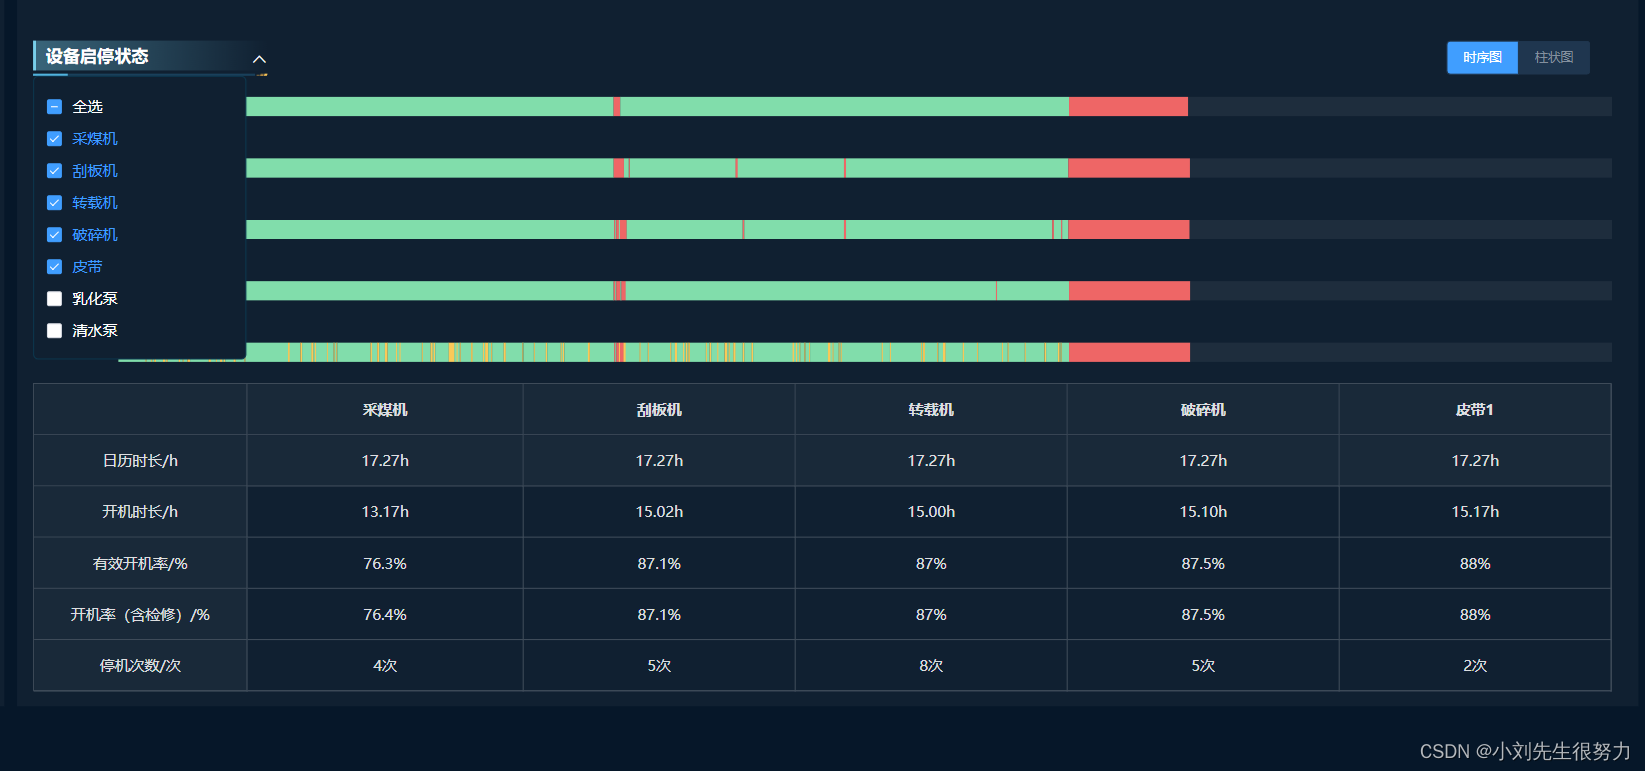
<el-radio-group v-model="chartType" class="radio-box" size="small" @change="handleChangeChart">
<el-radio-button label="1">时序图</el-radio-button>
<el-radio-button label="2">柱状图</el-radio-button>
</el-radio-group>
<div class="check-box" @click="showCheck">
<i v-show="!isShowCheck" class="el-icon-arrow-down"></i>
<i v-show="isShowCheck" class="el-icon-arrow-up"></i>
<div v-show="isShowCheck" class="check-box-item">
<el-checkbox
v-model="checkAll"
:indeterminate="isIndeterminate"
@change="handleCheckAllChange"
>全选
</el-checkbox>
<el-checkbox-group v-model="checkList" @change="handleCheckedChange">
<el-checkbox
v-for="value in checkAllList"
:key="value.id"
:label="value.id"
>{{ value.label }}</el-checkbox>
</el-checkbox-group>
</div>
</div>
<zmj-Echarts
v-show="chartType === '1'"
:isEchartAbsolute="true"
echartsId="trackCustom"
ref="trackCustom"
class="runTimeBar"
></zmj-Echarts>
<zmj-Echarts
v-show="chartType === '2'"
:isEchartAbsolute="true"
echartsId="runTimeBar"
ref="runTimeBar"
class="runTimeBar"
></zmj-Echarts>
<el-table :data="tableData" border>
<el-table-column prop="type" label="" fixed width="200" align="center"></el-table-column>
<el-table-column
v-for="item in tableHead"
:key="item.label"
:prop="item.prop"
:label="item.label"
align="center">
<template #default="{ row }">
{{ row[item.deviceType] }}{{ row.unit }}
</template>
</el-table-column>
</el-table>
</div>
</div>
</div>
</section>
</template>
<script>
import ModeTitle from '@/views/workFaceV2Views/dataQualityAnalyse/components/modeTitle.vue'
import { trackLine } from './echarts/trackChart'
import { timeChart } from './echarts/timeChart'
import { watchMixin } from '@/mixins/watch.mixin'
import Sidebar from '../components/sidebarDate/sidebarDate.vue'
import { runTimeBar } from './echarts/runTime'
const typeList = [
{id: '1', prop: 'shearer', label: '采煤机'},
{id: '2', prop: 'conveyor', label: '刮板机'},
{id: '3', prop: 'loader', label: '转载机'},
{id: '4', prop: 'crusher', label: '破碎机'},
{id: '5', prop: 'belt', label: '皮带'},
{id: '6', prop: 'emulsionPump', label: '乳化泵'},
{id: '7', prop: 'waterPump', label: '清水泵'}
]
const deviceType = [
{
type: '日历时长/h',
prop: 'calendarDuration',
unit: 'h'
},
{
type: '开机时长/h',
prop: 'powerOnDuration',
unit: 'h'
},
{
type: '有效开机率/%',
prop: 'effectivePowerOnRate',
unit: '%'
},
{
type: '开机率(含检修)/%',
prop: 'validOperationRate',
unit: '%'
},
{
type: '停机次数/次',
prop: 'stopNum',
unit: '次'
}
]
export default {
mixins: [watchMixin],
components: { Sidebar, ModeTitle },
data () {
return {
chartType: '1',
dateInfo: {},
isShowCheck: false,
checkAll: true,
isIndeterminate: false,
checkList: [],
checkAllList: typeList.map(v => ({ id: v.id, label: v.label })),
tableHead: typeList.map(v => ({ prop: v.id, label: v.label })),
tableData: []
}
},
watch: {
checkList: {
deep: true,
handler (val) {
}
}
},
mounted () {
this.checkList = this.checkAllList.map(v => v.id)
},
methods: {
onLoad () {
},
getDate (value) {
this.dateInfo = value
this.shearerTrack()
this.areaAnalysis(typeList)
},
shearerTrack () {
const params = {
workFaceCode: this.params.workFaceCode,
startTime: `${this.dateInfo.date[0]} 00:00:00`,
endTime: `${this.dateInfo.date[1]} 00:00:00`
}
window.$axiosGet('shearerTrackClass', params).then((res) => {
console.log(res, '生产班次煤机轨迹图');
this.$nextTick(() => {
this.$refs?.trackLine?.upDataEcharts(trackLine(res, this.dateInfo.date[0]))
})
})
},
// 设备启停状态柱状图 rateBar
// 设备启停状态时序图 rateTime
// 设备启停状态分析表格 analysisTable
areaAnalysis (newCheckoutData) {
const params = {
workFaceCode: 9999990001, // this.params.workFaceCode,
startTime: `${this.dateInfo.date[0]} 00:00:00`,
endTime: `${this.dateInfo.date[1]} 00:00:00`,
deviceTypeList: this.checkList
}
window.$axiosGetAll(['rateTime', 'rateBar', 'analysisTable'], [params, params, params]).then((res) => {
const [rateTime, rateBar, tableData] = res
let newData = tableData.filter(item => {
return newCheckoutData.find(el => {
return el.id == item.deviceType
})
})
this.tableHead = newData?.map(item => {
if(item.deviceType === 1) {
return {deviceType: '1', prop: 'shearer', label: '采煤机'}
}else if(item.deviceType === 2) {
return{deviceType: '2', prop: 'conveyor', label: '刮板机'}
}else if(item.deviceType === 3) {
return {deviceType: '3', prop: 'loader', label: '转载机'}
}else if(item.deviceType === 4) {
return {deviceType: '4', prop: 'crusher', label: '破碎机'}
}else if(item.deviceType === 5) {
return {deviceType: '5' + '-' + item.deviceNo, prop: 'belt', label: '皮带'+ item.deviceNo}
}else if(item.deviceType === 6) {
return{deviceType: '6' + '-' + item.deviceNo, prop: 'emulsionPump', label: '乳化泵'+ item.deviceNo}
}else if(item.deviceType === 7) {
return {deviceType: '7' + '-' + item.deviceNo, prop: 'waterPump', label: '清水泵'+ item.deviceNo}
}
})
tableData.forEach(t => {
this.tableData = deviceType.map(v => {
if (v.prop === 'calendarDuration' || v.prop === 'powerOnDuration') {
t[v.prop] = (t[v.prop] / 3600).toFixed(2)
}
if(t.deviceNo){
v[t.deviceType + '-' + t.deviceNo] = t[v.prop]
}else{
v[t.deviceType] = t[v.prop]
}
return v
})
})
this.$nextTick(() => {
this.$refs['trackCustom'] && this.$refs['trackCustom'].upDataEcharts(timeChart(newCheckoutData, rateTime, this.dateInfo.date[0]))
this.$refs['runTimeBar'] && this.$refs['runTimeBar'].upDataEcharts(runTimeBar(newCheckoutData, rateBar, this.checkAllList))
})
})
},
handleChangeChart (value) {
this.chartType = value
value === '2' && this.$refs['runTimeBar'] && this.$refs['runTimeBar'].echartsAutoResize()
value === '1' && this.$refs['trackCustom'] && this.$refs['trackCustom'].echartsAutoResize()
},
showCheck () {
this.isShowCheck = !this.isShowCheck
},
handleCheckAllChange (val) {
this.checkList = val ? this.checkAllList.map(v => v.id) : []
this.isIndeterminate = false
let newCheckoutData = this.addList(this.checkList, typeList)
this.areaAnalysis(newCheckoutData)
},
handleCheckedChange (value) {
let checkedCount = value.length
this.checkAll = checkedCount === this.checkAllList.length
this.isIndeterminate = checkedCount > 0 && checkedCount < this.checkAllList.length
let newCheckoutData = this.addList(value, typeList)
this.areaAnalysis(newCheckoutData)
},
addList (value, typeList) {
let returnArr = typeList.filter(item=>{
return value.indexOf(item.id) !== -1
});
return returnArr;
}
}
}
</script>
<style scoped lang="scss">
.device-box {
padding: 12px 24px 0;
width: 100%;
height: 100%;
overflow: hidden;
box-sizing: border-box;
}
.container {
display: flex;
height: 936px;
}
.content {
width: 1520px;
height: 100%;
background: rgba(255, 255, 255, 0.04);
padding: 12px 25px 0 15px;
}
.track-box {
height: 300px;
.trackLine {
height: 267px;
}
}
.runTimeBar {
height: 288px;
}
.wrapper {
position: relative;
}
.check-box {
width: 240px;
height: 33px;
position: absolute;
top: 0;
padding-right: 20px;
cursor: pointer;
display: flex;
align-items: center;
justify-content: flex-end;
}
.check-box-item {
position: absolute;
top: 33px;
left: 0;
padding: 12px;
background: #102031;
border-radius: 5px;
border: 1px solid #0B374E;
z-index: 99;
min-width: 200px;
overflow: hidden;
::-webkit-scrollbar {
/*滚动条整体样式*/
width: 10px;
}
::-webkit-scrollbar-thumb {
/*滚动条里面小方块*/
border-radius: 10px;
background: #285572;
}
::-webkit-scrollbar-track {
border-radius: 10px;
background: #072F4D;
}
}
.radio-box {
position: absolute;
right: 20px;
top: 0;
}
::v-deep {
.el-checkbox-group {
display: flex;
flex-direction: column;
overflow: auto;
}
.el-checkbox {
color: #fff;
margin: 0;
line-height: 30px;
}
.el-table::before,
.el-table--border::after,
.el-table__fixed::before {
background-color: #3E4B59;
}
.el-table--border {
border-color: #3E4B59;
}
.el-table__body tr.hover-row > td.el-table__cell {
background-color: #192939;
}
.el-table__body {
tr.hover-row td.el-table__ceil {
background-color: #192939;
}
}
.el-table {
background-color: #102031;
&, thead {
color: rgba(255, 255, 255, 0.85);
}
tr {
background-color: #102031;
}
td.el-table__cell, th.el-table__cell.is-leaf {
border-color: #3E4B59;
}
th.el-table__cell {
background-color: #192939;
}
.el-table__row {
.el-table__cell:first-child {
background-color: #192939;
}
}
}
.el-radio-button:first-child .el-radio-button__inner {
border-color: #1F364F;
}
.el-radio-button__inner {
background: #1F364F;
color: #84909E;
border-color: #1F364F;
}
}
</style>
js 文件
runTime.js文件
import { formatNumber } from '@/utils/utils'
const axisColor = 'rgba(255,255,255,0.65)'
const timeTemToHore = (data) => {
  return (data/3600).toFixed(1)
}
const weekMapping = {
  0: '周日',
  1: '周一',
  2: '周二',
  3: '周三',
  4: '周四',
  5: '周五',
  6: '周六',
}
export const runTimeBar = (filterData, data, typeList) => {
  let newData = []
  if(filterData.length === 0){
    newData = []
  }else{
    newData = data.filter(item => {
      return filterData.find(el => {
        return el.id == item.deviceType
      })
    })
  }
  if (newData?.length) {
    let powerOffTime = []
    let powerOnTime = []
    let standbyTime = []
    let xAxisData = []
    let emulsionPump = newData?.map(item => {
      if(item.deviceType === 1) {
        return item.deviceType = '采煤机'
      }else if(item.deviceType === 2) {
        return item.deviceType = '刮板机'
      }else if(item.deviceType === 3) {
        return item.deviceType = '转载机'
      }else if(item.deviceType === 4) {
        return item.deviceType = '破碎机'
      }else if(item.deviceType === 5) {
        return item.deviceType = '皮带'+ item.deviceNo
      }else if(item.deviceType === 6) {
        return item.deviceType = '乳化泵'+ item.deviceNo
      }else if(item.deviceType === 7) {
        return item.deviceType = '清水泵'+ item.deviceNo
      }
    })
    newData.map(item => {
      // deviceNo 设备号
      xAxisData.push(item.deviceType) // deviceType 设备类型
      powerOffTime.push(formatNumber(item.powerOffRate, 2)) // powerOffRate 停机率
      powerOnTime.push(formatNumber(item.powerOnRate, 2))  // powerOnRate 开机率
      standbyTime.push(formatNumber(item.standbyRate, 2)) // standbyRate 待机率
    })
    let barWidth = xAxisData.length > 12 ? null : 48
    return {
      tooltip: {
        trigger: 'axis'
      },
      color:['#1599EE', '#7FBEFE', '#CEDCF5'],
      grid: {
        left: 50,
        right: 30,
        top: 50,
        bottom: 30
      },
      legend: {
        data: ['开机', '待机', '停机'],
        itemGap: 60,
        textStyle:{
          color:axisColor,
          fontSize: 16
        }
      },
      xAxis: [
        {
          type: 'category',
          axisLabel: {
            width: 0,
            fontSize: 14,
            // 解决最后一个值不显示问题
            showMaxLabel: true,
            color: axisColor,
            // formatter(data){
            //   return typeList.find(v => v.id === arr)?.label
            // }
          },
          // boundaryGap: true,
          axisTick: {
            show: false
          },
          axisLine: {
            show: false
          },
          data: emulsionPump,
          splitArea: {
            show: true,
            interval: 0,
            areaStyle: {
              color: ['RGBA(15, 40, 68, .5)', 'RGBA(38, 62, 88, .5)']
            }
          }
        }
      ],
      yAxis: {
        name: '开机率 ',
        nameTextStyle:{
          color: '#fff',
          fontSize: 16,
        },
        type: 'value',
        // max: dateType === 4 ? 750 : 24,
        max: 100,
        min: 0,
        axisLabel: {
          color: axisColor,
          margin: 20
        },
        splitLine: {
          lineStyle: {
            color: ['#193451'],
            width: 1,
            type: 'solid'
          }
        },
        color: axisColor
      },
      series: [
        {
          name: '开机',
          type: 'bar',
          stack: '停机',
          barWidth,
          data: powerOnTime,
          label: {
            show: true,
            formatter: params => {
              return params.value === 0 ? '': params.value
            }
          },

          itemStyle: {
            barBorderRadius: [0, 0, 6, 6],
          }
        },
        {
          name: '待机',
          type: 'bar',
          stack: '停机',
          barWidth,
          data: standbyTime,
          label: {
            show: true,
            formatter: params => {
              return params.value === 0 ? '': params.value
            }
          }
        },
        {
          name: '停机',
          type: 'bar',
          stack: '停机',
          barWidth,
          data: powerOffTime,
          label: {
            show: true,
            formatter: params => {
              return params.value === 0 ? '': params.value
            }
          },
          itemStyle: {
            barBorderRadius: [6, 6, 0, 0],
          }
        }
      ]
    }
  } else {
    return {
      title: {
        left: 'center',
        top: 'center',
        textStyle: {
          fontSize: 14
        },
        subtext: '暂无数据'
      }
    }
  }
}
timeChart.js 文件
const axisColor = 'rgba(255,255,255,0.65)'
export const timeChart = (filterData, data, time) => {
  let newData = []
  if(filterData.length === 0){
    newData = []
  }else{
    newData = data.filter(item => {
      return filterData.find(el => {
        return el.prop === item.deviceType
      })
    })
  }
  if (newData  && newData.length) {
    let seriesDate = []
    const timeDuration = (time) => {
      return parseInt(time / 3600) + '小时' + parseInt((time % 3600) / 60) + '分' + (time % 3600) % 60 + '秒'
    }
    newData?.reverse().forEach((item, i) => {
      if(item.startStopRecord && item.startStopRecord.length) {
        item.startStopRecord.forEach((v, j) => {
          let color, name
          if(v.status === 0){
            color = '#EE6666'
            name = '停机'
          }else if(v.status === 1){
            color = '#81DDAB'
            name = '开机'
          }else if(v.status === 2){
            color = '#FAC958'
            name = '待机'
          }
          seriesDate.push({
            itemStyle: { normal: { color:color } },
            name: name,
            value: [i, window.$moment(v.startTime).valueOf(), window.$moment(v.endTime).valueOf(), v.duration],
          })
          if(j === item.startStopRecord.length - 1){
            seriesDate.push({
              itemStyle: { normal: { color:'#1e2d3d'} },
              name: '--',
              value: [i, window.$moment(v.endTime).valueOf(), window.$moment().format('YYYY-MM-DD 23:59:59').valueOf()],
            })
          }
        })
      }else{
        seriesDate.push({
          itemStyle: { normal: { color:'#1e2d3d'} },
          name: '--',
          value: [i, window.$moment().format('YYYY-MM-DD 00:00:00').valueOf(), window.$moment().format('YYYY-MM-DD 23:59:59').valueOf()],
        })
      }
    })
    return {
      tooltip: {
        trigger: 'item',
        formatter (params) {
          return `
              <div style="text-align:left;overflow:hidden;">
                ${params.marker} ${params.name}<br />
                从 ${window.$moment(params.value[1]).format('MM-DD HH:mm:ss')}<br />
                至 ${window.$moment(params.value[2]).format('MM-DD HH:mm:ss')}<br />
                ${params.value[3] ? '持续:' + timeDuration(params.value[3]) : ''}
              </div>
              `
        },
      },
      grid: {
        left: 80,
        right: 0,
        top: 0,
        bottom: 0,
      },
      // color:['#1599EE', '#7FBEFE', '#CEDCF5'],
      // legend: {
      //   data: ['开机', '待机', '停机'],
      //   itemGap: 60,
      //   textStyle:{
      //     color:axisColor,
      //     fontSize: 16
      //   }
      // },
      xAxis: [
        {
          type: 'time',
          show: false,
          min:  window.$moment(time).format('YYYY-MM-DD 00:00:00').valueOf(),
          max:  window.$moment(time).format('YYYY-MM-DD 23:59:59').valueOf(),
          axisLabel:{
            // 坐标轴颜色
            color: '#ddd',
            fontSize: 14,
            rotate: 0,
            showMaxLabel: true,
            formatter (value) {
              if (window.$moment(value).format('HH:mm:ss') === '23:59:59') {
                return '24:00:00'
              } else {
                return window.$moment(value).format('HH:mm:ss')
              }
            },
          },
          axisPointer: {
            type: 'shadow',
          },
          // 横坐标,刻度线
          axisTick: {
            show: false,
          },
          axisLine: {
            show: false,
          },
        },
      ],
      yAxis: {
        // 横坐标,刻度线
        axisTick: {
          show: false,
        },
        axisLine: {
          show: false,
        },
        data: newData?.map((item, i) =>{
          if(item.deviceType === 'shearer') {
            item.deviceType = '采煤机'
          }else if(item.deviceType === 'conveyor') {
            item.deviceType = '刮板机'
          }else if(item.deviceType === 'loader') {
            item.deviceType = '转载机'
          }else if(item.deviceType === 'crusher') {
            item.deviceType = '破碎机'
          }else if(item.deviceType === 'belt') {
            item.deviceType = '皮带'+ item.deviceId
          }else if(item.deviceType === 'emulsionPump') {
            item.deviceType = '乳化泵'+ item.deviceId
          }else if(item.deviceType === 'waterPump') {
            item.deviceType = '清水泵'+ item.deviceId
          }else if(item.deviceType === 'rear_conveyor') {
            item.deviceType = '后部刮板机'
          }else if(item.deviceType === 'electric') {
            item.deviceType = '电控'
          }
          return item.deviceType
        }),
        axisLabel:{
          color: '#fff',
          fontSize: 14,
          rotate: 0,
        },
      },
      series: [
        {name: '开机', type: 'bar', color:'#81DDAB', data: []},
        // {name: '待机', type: 'bar', color:'#FAC958', data: []},
        {name: '停机', type: 'bar', color:'#FA7272', data: []},
        {
          type: 'custom',
          color:'#1e2d3d',
          renderItem: function (params, api) {
            let categoryIndex = api.value(0)
            let start = api.coord([api.value(1), categoryIndex])
            let end = api.coord([api.value(2), categoryIndex])
            let height = 18
            return {
              type: 'rect',
              shape: window.$echarts.graphic.clipRectByRect({
                x: start[0],
                y: start[1] - height / 2,
                width: end[0] - start[0],
                height: height,

              }, {
                x: params.coordSys.x,
                y: params.coordSys.y,
                width: params.coordSys.width,
                height: params.coordSys.height,

              }),
              style: api.style(),
            }
          },
          encode: {
            x: [1, 2],
            y: 0,
          },
          data: seriesDate,
        },
      ],
    }
  } else {
    return {
      title: {
        left: 'center',
        top: 'center',
        textStyle: {
          fontSize: 14,
        },
        subtext: '暂无数据',
      },
    }
  }
}


 6968
6968

 被折叠的 条评论
为什么被折叠?
被折叠的 条评论
为什么被折叠?
 到【灌水乐园】发言


