


我做的是Machine Learning, Spring 2019。只做了实验题即编程题。
Experiments with Bagging Ridge Regression


import numpy as np

# 从文件得到数据
def file2matrix(filename):
    fr = open(filename)
    lines = fr.readlines()
    numberOfLines = len(lines)
    returnMat = np.zeros((numberOfLines, 11))
    classLabelVector = []
    returnMat[:, 0] = 1
    index = 0
    for line in lines:
        line = line.strip('\n')
        listFromLine = line.split()
        returnMat[index, 1:] = listFromLine[:10]
        classLabelVector.append(int(listFromLine[-1]))
        index += 1
    return returnMat, np.array(classLabelVector).reshape(-1, 1)

# 岭回归
def ridgeRegress(xMat, yMat, lam):
    xTx = xMat.T * xMat
    denom = xTx + np.eye(xMat.shape[1]) * lam
    ws = denom.I * (xMat.T * yMat)
    return ws

# 计算错误率
def errCnt(x, y, w):
    n = x.shape[0]
    cnt = (np.multiply(x * w, y) <= 0).sum()
    return cnt / n
x, y = file2matrix('hw2_lssvm_all.dat.txt')
x = np.mat(x)
y = np.mat(y)
train_x = x[:400]
train_y = y[:400]
test_x = x[400:]
test_y = y[400:]
ei_list = []
eo_list = []
lam_list = [0.05, 0.5, 5, 50, 500]
for lam in lam_list:
w = ridgeRegress(train_x, train_y, lam)
ein = errCnt(train_x, train_y, w)
eout = errCnt(test_x, test_y, w)
ei_list.append(ein)
eo_list.append(eout)
min_ein = min(ei_list)
min_ein_index = ei_list.index(min_ein)
min_eout = min(eo_list)
min_eout_index = eo_list.index(min_eout)
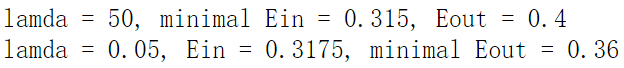
print("lamda = {}, minimal Ein = {}, Eout = {}".format(lam_list[min_ein_index], min_ein, eo_list[min_ein_index]))
print("lamda = {}, Ein = {}, minimal Eout = {}".format(lam_list[min_eout_index], ei_list[min_eout_index], min_eout))
Experiments with Adaptive Boosting

def bootstrap(x, y):
    n = x.shape[0]
    index = np.random.randint(0, n, n)
	return x[index], y[index]

def bagging_errCnt(x, y, w):
    m = x.shape[0]
    n = w.shape[1]
    cnt = (np.multiply(x * w, y) <= 0).sum(axis=1)
    vote = cnt > (n/2)
    err = vote.sum()
    return err / m
x, y = file2matrix('hw2_lssvm_all.dat.txt')
x = np.mat(x)
y = np.mat(y)
train_x = x[:400]
train_y = y[:400]
test_x = x[400:]
test_y = y[400:]
N = 250
lam_list = [0.05, 0.5, 5, 50, 500]
w_aggre = np.mat(np.zeros((11, N)))
ei_list = []
eo_list = []
for lam in lam_list:
for i in range(N):
b_train_x, b_train_y = bootstrap(train_x, train_y)
w = ridgeRegress(b_train_x, b_train_y, lam)
w_aggre[:, i] = w[:]
Ein = bagging_errCnt(train_x, train_y, w_aggre)
ei_list.append(Ein)
Eout = bagging_errCnt(test_x, test_y, w_aggre)
eo_list.append(Eout)
min_ein = min(ei_list)
min_ein_index = ei_list.index(min_ein)
min_eout = min(eo_list)
min_eout_index = eo_list.index(min_eout)
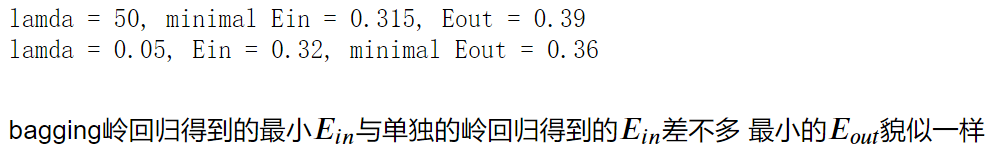
print("lamda = {}, minimal Ein = {}, Eout = {}".format(lam_list[min_ein_index], min_ein,eo_list[min_ein_index]))
print("lamda = {}, Ein = {}, minimal Eout = {}".format(lam_list[min_eout_index], ei_list[min_eout_index], min_eout))
Experiments with Adaptive Boosting

def data2matrix(filename):
    fr = open(filename)
    lines = fr.readlines()
    numberOflines = len(lines)
    returnMat = np.zeros((numberOflines, 2))
    classLabelVector = []
    index = 0

    for line in lines:
        line = line.strip('\n')
        listFromLine = line.split()
        returnMat[index, :] = listFromLine[:2]
        classLabelVector.append(int(listFromLine[-1]))
        index += 1

    return returnMat, classLabelVector

# predict
def stumpClassify(data2matrix, dimen, threshVal, threshIneq):
    retArray = np.ones((data2matrix.shape[0], 1))
    if threshIneq == 'lt':
        retArray[data2matrix[:, dimen] <= threshVal] = -1
    else:
        retArray[data2matrix[:, dimen] > threshVal] = -1

    return retArray

def buildStump(dataMatrix, classLabels, D):
    classLabels = np.mat(classLabels).T
    minError = np.inf
    m, n = dataMatrix.shape
    numSteps = 10
    bestStump = {}; bestClassEst = np.mat(np.ones((m, 1)))

    for i in range(n): # 对每一个特征
        rangeMin = dataMatrix[:, i].min()
        rangeMax = dataMatrix[:, i].max()
        stepSize = (rangeMax - rangeMin) / numSteps

        for j in range(-1, int(numSteps)+1):
            for inequal in ['lt', 'gt']:
                threshVal = (rangeMin + j * stepSize)
                predictVal = stumpClassify(dataMatrix, i, threshVal, inequal)
                errArr = np.mat(np.ones((m, 1)))
                errArr[classLabels == predictVal] = 0
                #err = errArr.sum()
                weightedError = D.T * errArr
                if weightedError < minError:
                    minError = weightedError
                    bestClassEst = predictVal.copy()
                    bestStump['dim'] = i
                    bestStump['threshVal'] = threshVal
                    bestStump['inequal'] = inequal

    return bestClassEst, bestStump, minError
train_x, train_y = data2matrix('hw2_adaboost_train.dat.txt')
test_x, test_y = data2matrix('hw2_adaboost_test.dat.txt')

D = np.mat(np.ones((100, 1))) / 100
bestClassEst, bestStump, weightedError = buildStump(train_x, train_y, D)
import matplotlib.pyplot as plt

postiveIndex = []
negtiveIndex = []

for i in range(len(train_x)):
    if train_y[i] == 1:
        postiveIndex.append(i)
    else:
        negtiveIndex.append(i)

pTrain_x = train_x[postiveIndex]
nTrain_x = train_x[negtiveIndex]

threash = bestStump['threshVal']

plt.scatter(pTrain_x[:, 0], pTrain_x[:, 1], label='+1')
plt.scatter(nTrain_x[:, 0], nTrain_x[:, 1], label='-1')
plt.plot([threash, threash], [0, 1], label="stump")
plt.legend()
plt.show()

def updateD(classEst, classLabel, D, alpha):
    expon = np.multiply(-1 * alpha * classEst, np.mat(classLabel).T)
    D = np.multiply(D, np.exp(expon))
    D = D / D.sum()
    return D

def countEin(classEst, classLabel):
    m = classEst.shape[0]
    error = np.multiply(classEst != np.mat(classLabel).T, np.ones((m,1)))
    errorRate = error.sum() / classEst.shape[0]
    return errorRate

def adaClassify(dat2class, classifierArr):
    datMatrix = np.mat(dat2class)
    m = datMatrix.shape[0]
    aggClassEst = np.zeros((m, 1))

    for i in range(len(classifierArr)):
        classEst = stumpClassify(datMatrix, classifierArr[i]['dim'], \
                                 classifierArr[i]['threshVal'], \
                                 classifierArr[i]['inequal'])
        aggClassEst += classifierArr[i]['alpha'] * classEst
    return np.sign(aggClassEst)

def AdaBoost(train_x, train_y, test_x, test_y, T):
    m = train_x.shape[0]
    D = np.mat(np.ones((100, 1))) / 100
    weakClassArr = []
    aggClassEst = np.mat(np.zeros((100, 1)))
    ein_gt_list = []
    ein_Gt_list = []
    Ut = []
    eout_Gt_list = []

    for t in range(T):
        Ut.append(D.sum())

        classEst, bestStump, error = buildStump(train_x, train_y, D)
        ein_gt_list.append(countEin(classEst, train_y)) # Ein(gt)

        alpha = float(0.5 * np.log((1.0 - error) / max(error, 1e-16)))
        bestStump['alpha'] = alpha
        weakClassArr.append(bestStump)
        D = updateD(classEst, train_y, D, alpha)

        aggClassEst += alpha * classEst
        aggClassEstSign = np.sign(aggClassEst)
        errArr = np.mat(np.ones((m, 1)))
        errArr[aggClassEstSign == np.mat(train_y).T] = 0
        aggErrors = errArr.sum()
        errorRate = aggErrors / m
        #aggErrors = np.multiply(np.sign(aggClassEst) != np.mat(classLabel).T, np.ones((m,1)))
        #errorRate = aggErrors.sum() / m

        # Ein(Gt)
        ei = adaClassify(train_x, weakClassArr)
        ein_Gt_list.append(countEin(ei, train_y))

        # Eout(Gt)
        eo = adaClassify(test_x, weakClassArr)
        eout_Gt_list.append(countEin(eo, test_y))


        print("T = {}, error rate = {}".format(t, errorRate))

    return weakClassArr, ein_gt_list, ein_Gt_list, Ut, eout_Gt_list
weakClassArr, ein_gt_list,\
ein_Gt_list, Ut, eout_Gt_list = AdaBoost(train_x, train_y, test_x, test_y, 300)
classEst = adaClassify(test_x, weakClassArr)
errorRate = countEin(classEst, test_y)
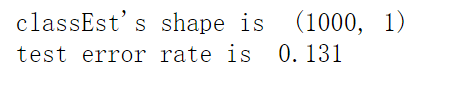
print("classEst's shape is ", classEst.shape)
print('test error rate is ', errorRate)
import matplotlib.pyplot as plt
t = range(300)
plt.plot(t, ein_gt_list)
plt.xlabel('t')
plt.ylabel("$E_{in}$")
plt.title("$E_{in}(g_t)$")
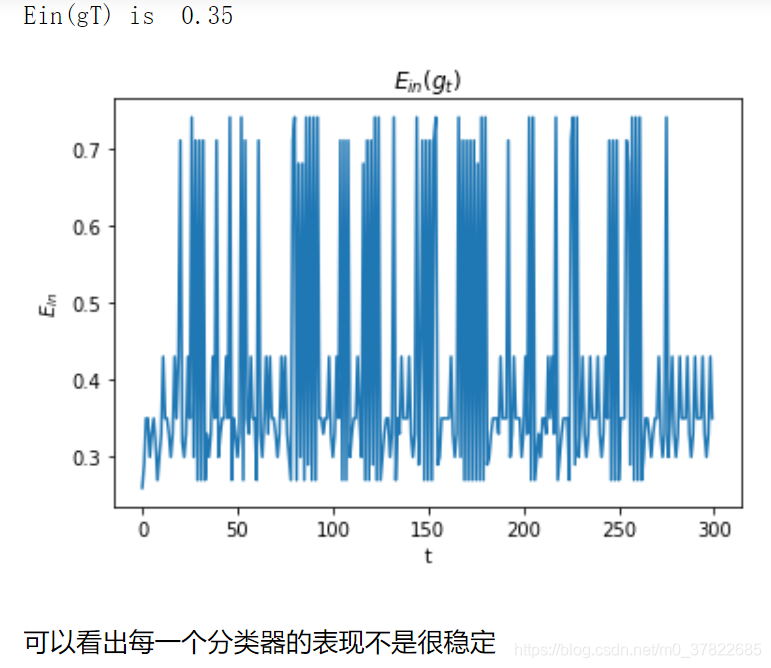
print("Ein(gT) is ", ein_gt_list[-1])
plt.plot(t, ein_Gt_list)
plt.xlabel('t')
plt.ylabel("$E_{in}$")
plt.title("$E_{in}(G_t)$")
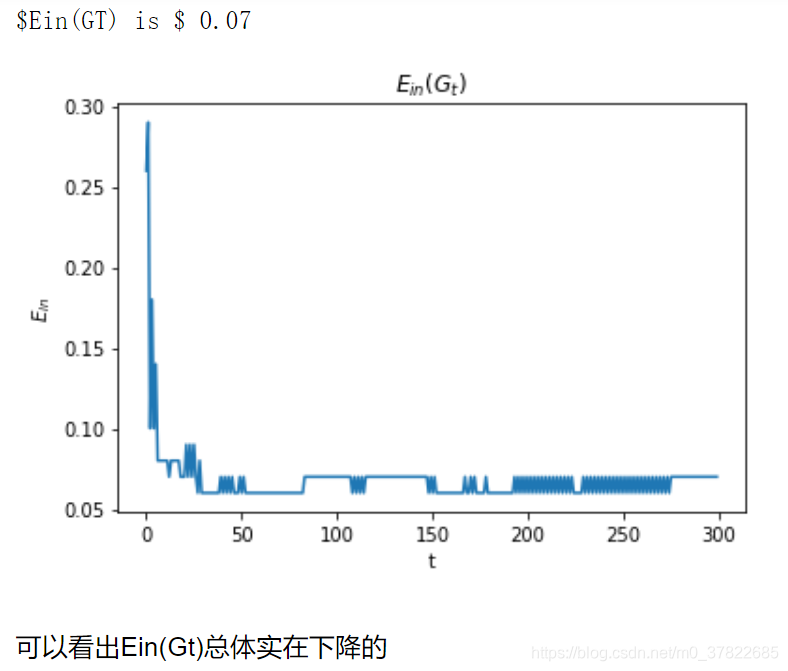
print("$Ein(GT) is $", ein_Gt_list[-1])
plt.plot(t, Ut)
plt.xlabel('t')
plt.ylabel("$U$")
plt.title("$U_{t}$")
print("$U_{T} is $", Ut[-1])
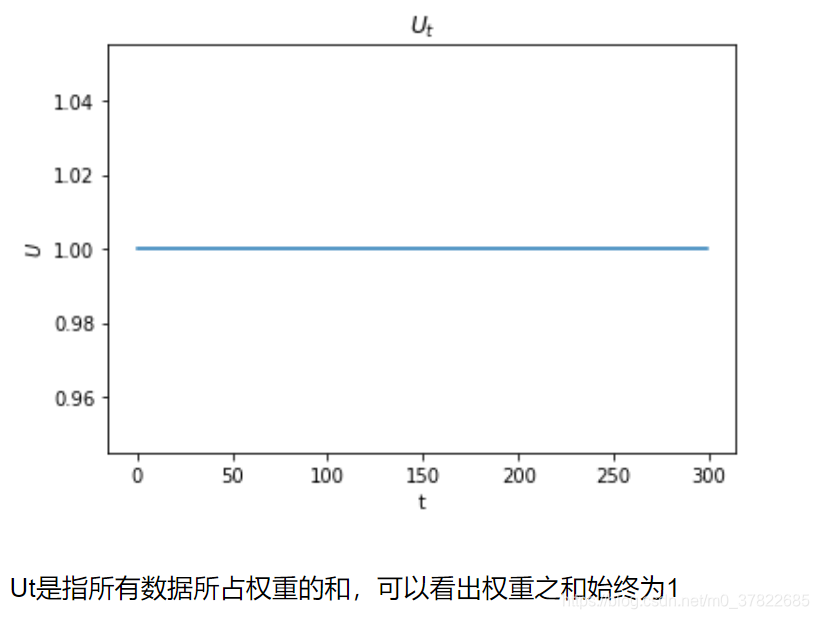
这里提一下,因为在程序中,我们每轮得到的权重都进行了归一化,所以这个权重之和始终为1.若没有归一化的步骤,
U
t
U_t
Ut是减小的。若不归一化可以得到下图:

plt.plot(t, eout_Gt_list, label="$E_{out}(G_t)$")
plt.xlabel('t')
plt.ylabel("$E_{out}$")
plt.title("$E_{out}(G_T)$")
print("$$E_{out}(G_T) is $", eout_Gt_list[-1])


 1303
1303


 被折叠的 条评论
为什么被折叠?
被折叠的 条评论
为什么被折叠?
 到【灌水乐园】发言


