


Seaborn之seaborn.distplot()
Seaborn是基于matplotlib的Python可视化库。 它提供了一个高级界面来绘制有吸引力的统计图形。
Seaborn的displot()集合了matplotlib的hist()与核函数估计kdeplot的功能,增加了rugplot分布观测条显示与利用scipy库fit拟合参数分布的新颖用途。
seaborn.distplot(a, bins=None, hist=True, kde=True, rug=False, fit=None, hist_kws=None, kde_kws=None, rug_kws=None, fit_kws=None, color=None, vertical=False, norm_hist=False, axlabel=None, label=None, ax=None)
Signature:
sns.distplot(
a,
bins=None,
hist=True,
kde=True,
rug=False,
fit=None,
hist_kws=None,
kde_kws=None,
rug_kws=None,
fit_kws=None,
color=None,
vertical=False,
norm_hist=False,
axlabel=None,
label=None,
ax=None,
)
Docstring:
Flexibly plot a univariate distribution of observations.
灵活绘制单变量观测值分布图。
This function combines the matplotlib hist function (with automatic
calculation of a good default bin size) with the seaborn :func:kdeplot
and :func:rugplot functions. It can also fit scipy.stats
distributions and plot the estimated PDF over the data.
该函数结合了matplotlib中的 hist函数(自动计算一个默认的合适的bin大小)、seaborn的kdeplot()和rugplot()函数。它还可以拟合scipy.stats分布并在数据上绘制估计的PDF(概率分布函数)。
Parameters
参数
a : Series, 1d-array, or list.
1维数组或者列表。
Observed data. If this is a Series object with a name attribute,
the name will be used to label the data axis.
观察数据。如果是具有name属性的Series对象,则该名称将用于标记数据轴。
bins : argument for matplotlib hist(), or None, optional
matplotlib hist()的参数,或None。可选参数。
Specification of hist bins. If unspecified, as reference rule is used
that tries to find a useful default.
直方图bins(柱)的数目,若填None,则默认使用Freedman-Diaconis规则指定柱的数目。
hist : bool, optional 布尔值,可选参数
Whether to plot a (normed) histogram.
是否绘制(标准化)直方图。
kde : bool, optional 布尔值,可选参数。
Whether to plot a gaussian kernel density estimate.
是否绘制高斯核密度估计图。
rug : bool, optional 布尔值,可选参数。
Whether to draw a rugplot on the support axis.
是否在横轴上绘制观测值竖线。
fit : random variable object, optional 随机变量对象,可选参数。
An object with fit method, returning a tuple that can be passed to a
pdf method a positional arguments following a grid of values to
evaluate the pdf on.
一个带有fit方法的对象,返回一个元组,该元组可以传递给pdf方法一个位置参数,该位置参数遵循一个值的网格用于评估pdf。
hist_kws : dict, optional 字典,可选参数。
Keyword arguments for :meth:matplotlib.axes.Axes.hist.
底层绘图函数的关键字参数。
kde_kws : dict, optional 字典,可选参数。
Keyword arguments for :func:kdeplot.
底层绘图函数的关键字参数。
rug_kws : dict, optional 字典,可选参数。
Keyword arguments for :func:rugplot.
底层绘图函数的关键字参数。
color : matplotlib color, optional 可选参数。
Color to plot everything but the fitted curve in.
可以绘制除了拟合曲线之外所有内容的颜色。
vertical : bool, optional 布尔值,可选参数。
If True, observed values are on y-axis.
如果为True,则观测值在y轴显示。
norm_hist : bool, optional 布尔值,可选参数。
If True, the histogram height shows a density rather than a count.
如果为True,则直方图的高度显示密度而不是计数。
This is implied if a KDE or fitted density is plotted.
如果绘制KDE图或拟合密度,则默认为True。
axlabel : string, False, or None, optional 字符串,False或者None,可选参数。
Name for the support axis label. If None, will try to get it
横轴的名称。如果为None,将尝试从a.name获取它;
from a.name if False, do not set a label.
如果为False,则不设置标签。
label : string, optional 字符串,可选参数。
Legend label for the relevant component of the plot.
图形相关组成部分的图例标签。
ax : matplotlib axis, optional 可选参数。
If provided, plot on this axis.
返回Axes对象以及用于进一步调整的绘图。
Returns
ax : matplotlib Axes
Returns the Axes object with the plot for further tweaking.
返回Axes对象以及用于进一步调整的绘图。
See Also
kdeplot : Show a univariate or bivariate distribution with a kernel
density estimate.
显示具有核密度估计图的单变量或双变量分布。
rugplot : Draw small vertical lines to show each observation in a
distribution.
绘制小的垂直线以显示分布中的每个观测值。
Examples
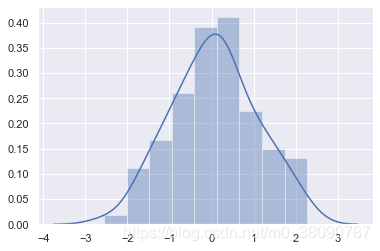
Show a default plot with a kernel density estimate and histogram with bin
size determined automatically with a reference rule:
显示具有核密度估计的默认图和使用参考规则自动确定bin大小的直方图:
… plot::
:context: close-figs
>>> import seaborn as sns, numpy as np
>>> sns.set(); np.random.seed(0)
>>> x = np.random.randn(100)
>>> ax = sns.distplot(x)
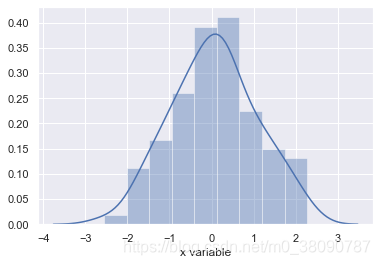
Use Pandas objects to get an informative axis label:
使用Pandas对象获取信息轴标签:
… plot::
:context: close-figs
>>> import pandas as pd
>>> x = pd.Series(x, name="x variable")
>>> ax = sns.distplot(x)
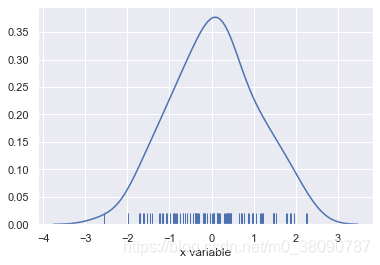
Plot the distribution with a kernel density estimate and rug plot:
使用核密度估计和小的垂直线绘制分布图:
… plot::
:context: close-figs
>>> ax = sns.distplot(x, rug=True, hist=False)
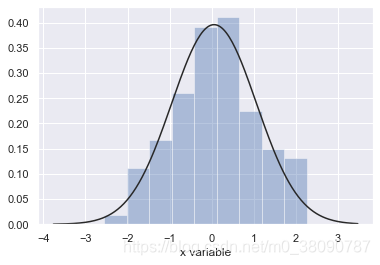
Plot the distribution with a histogram and maximum likelihood gaussian
distribution fit:
使用直方图和最大似然高斯分布拟合绘制分布图:
… plot::
:context: close-figs
>>> from scipy.stats import norm
>>> ax = sns.distplot(x, fit=norm, kde=False)
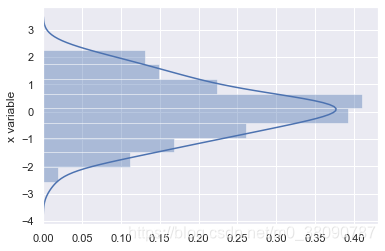
Plot the distribution on the vertical axis:
在垂直轴上绘制分布图:
… plot::
:context: close-figs
>>> ax = sns.distplot(x, vertical=True)
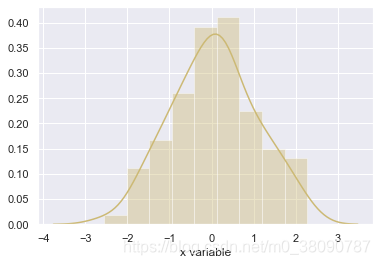
Change the color of all the plot elements:
更改所有绘图元素的颜色:
… plot::
:context: close-figs
>>> sns.set_color_codes()
>>> ax = sns.distplot(x, color="y")
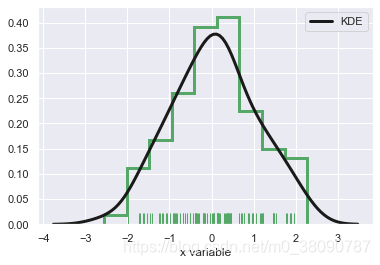
Pass specific parameters to the underlying plot functions:
… plot::
:context: close-figs
>>> ax = sns.distplot(x, rug=True, rug_kws={"color": "g"},
...                   kde_kws={"color": "k", "lw": 3, "label": "KDE"},
...                   hist_kws={"histtype": "step", "linewidth": 3,
...                             "alpha": 1, "color": "g"})
Type: function
类型:方法


 1万+
1万+


 被折叠的 条评论
为什么被折叠?
被折叠的 条评论
为什么被折叠?
 到【灌水乐园】发言


