


#EasyCharts团队出品,
#如有问题修正与深入学习,可联系微信:EasyCharts
library(ggplot2)
mydata<-read.csv("Residual_Analysis_Data.csv",stringsAsFactors=FALSE)
fit <- lm(y2 ~ x, data = mydata)
mydata$predicted <- predict(fit) # Save the predicted values
mydata$residuals <- residuals(fit) # Save the residual values
mydata$Abs_Residuals<-abs(mydata$residuals) #
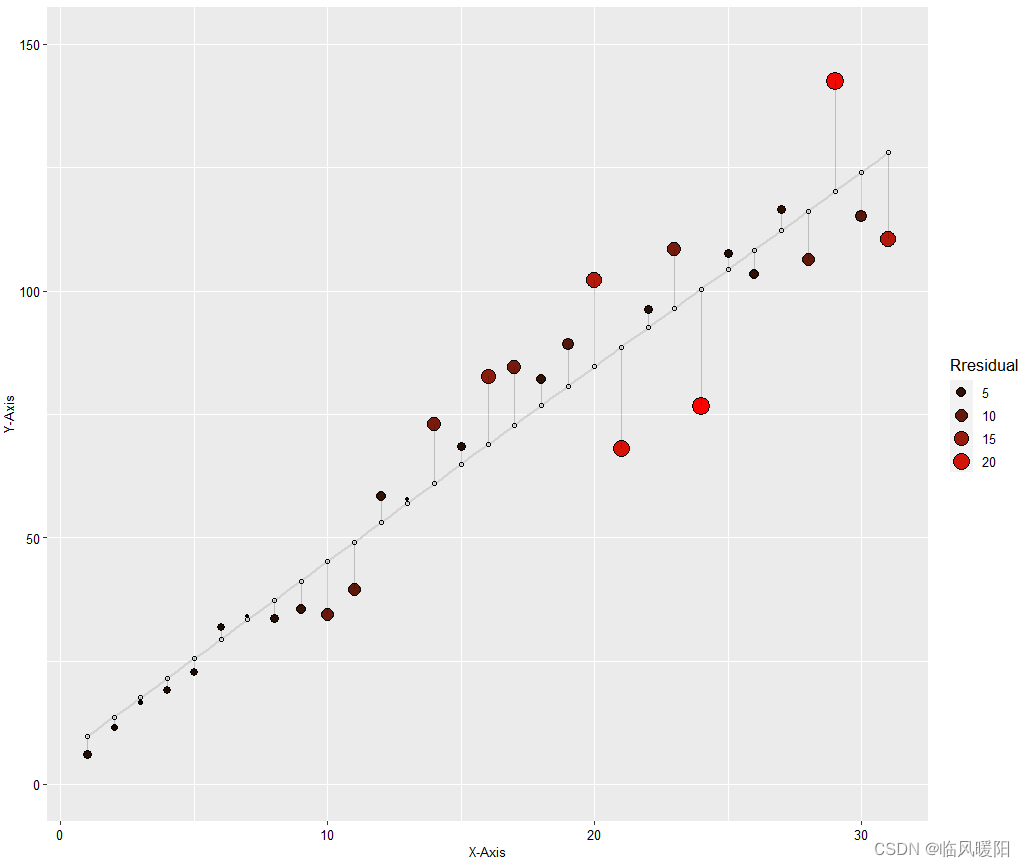
ggplot(mydata, aes(x = x, y = y2)) +
geom_point(aes(fill =Abs_Residuals, size = Abs_Residuals),shape=21,colour="black") + # size also mapped
scale_fill_continuous(low = "black", high = "red") +
geom_smooth(method = "lm", se = FALSE, color = "lightgrey") +
geom_point(aes(y = predicted), shape = 1) +
geom_segment(aes(xend = x, yend = predicted), alpha = .2) +# > Color AND size adjustments made here...
guides(fill = guide_legend((title="Rresidual")),
size = guide_legend((title="Rresidual")))+
ylim(c(0,150))+
xlab("X-Axis")+
ylab("Y-Axis")+
theme(text=element_text(size=15,face="plain",color="black"),
axis.title=element_text(size=10,face="plain",color="black"),
axis.text = element_text(size=10,face="plain",color="black"),
legend.position = "right",
legend.title = element_text(size=13,face="plain",color="black"),
legend.text = element_text(size=10,face="plain",color="black"),
legend.background = element_rect(fill=alpha("white",0)))
d<-mydata
fit <- lm(y5 ~ x+I(x^2), data = d)
# Obtain predicted and residual values
d$predicted <- predict(fit) # Save the predicted values
d$residuals0 <- residuals(fit) # Save the residual values
d$Residuals<-abs(d$residuals0 )
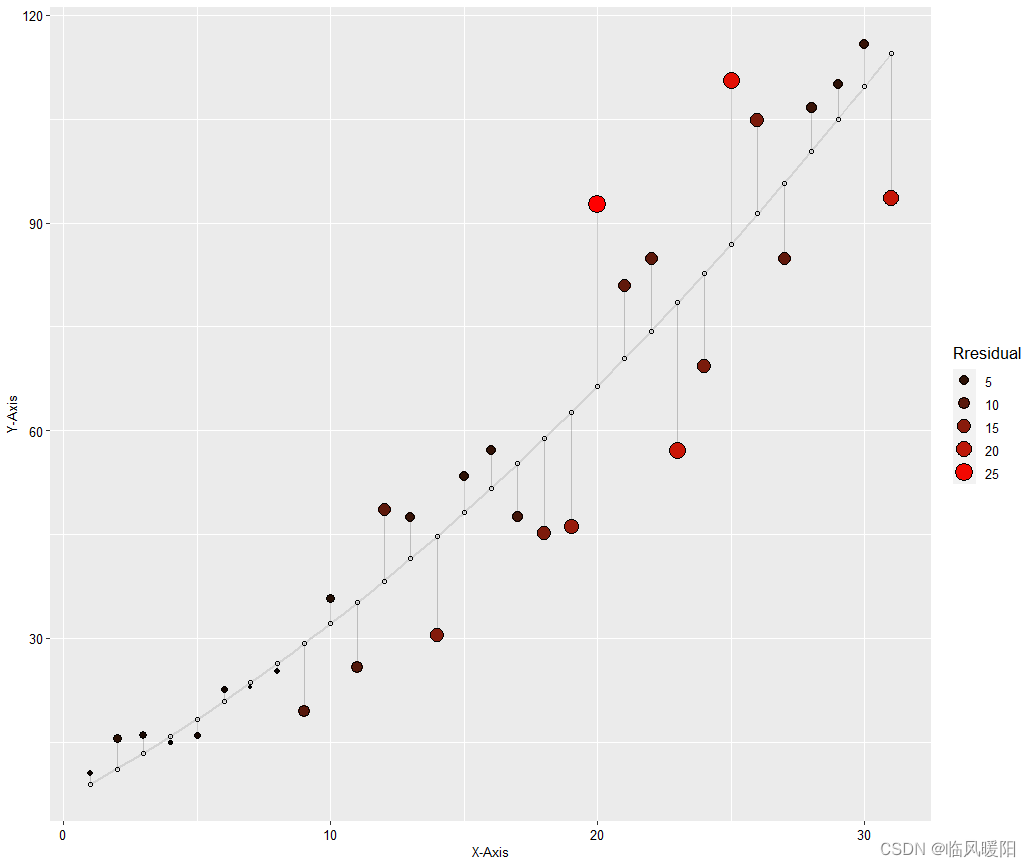
ggplot(d, aes(x = x, y = y5)) +
geom_smooth(method = "lm",formula = y ~ x+I(x^2), se = FALSE, color = "lightgrey") +
geom_segment(aes(xend = x, yend = predicted), alpha = .2) +
geom_point(aes(fill =Residuals, size = Residuals),shape=21,colour="black") + # size also mapped
scale_fill_continuous(low = "black", high = "red") +
#scale_color_gradient2(low = "blue", mid = "white", high = "red") +
geom_point(aes(y = predicted), shape = 1) + # Size legend also removed
#ylim(c(0,150))+
xlab("X-Axis")+
ylab("Y-Axis")+
geom_point(aes(y = predicted), shape = 1) +
guides(fill = guide_legend((title="Rresidual")),
size = guide_legend((title="Rresidual")))+
theme(text=element_text(size=15,face="plain",color="black"),
axis.title=element_text(size=10,face="plain",color="black"),
axis.text = element_text(size=10,face="plain",color="black"),
legend.position = "right",
legend.title = element_text(size=13,face="plain",color="black"),
legend.text = element_text(size=10,face="plain",color="black"),
legend.background = element_rect(fill=alpha("white",0)))
开发工具:RStudio与微信Alt+A截屏工具
参考文献:https://download.csdn.net/download/weixin_39840588/11515554?utm_medium=notify.im.downloadSource.a&username=m0_38127487


 171
171


 被折叠的 条评论
为什么被折叠?
被折叠的 条评论
为什么被折叠?
 到【灌水乐园】发言


