


library(ggplot2)
df<-read.csv("Hist_Density_Data.csv",stringsAsFactors=FALSE)
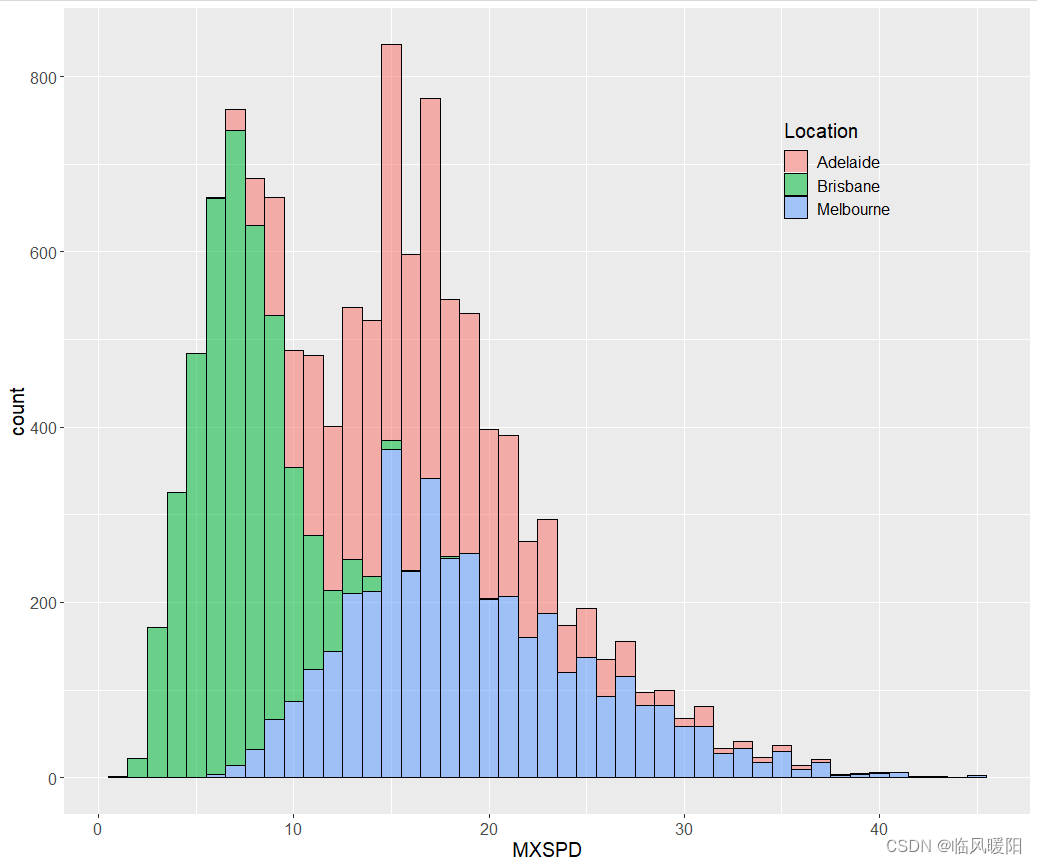
#--------------------------------------------(a2) 多数剧系列直方图-----------------------------------
ggplot(df, aes(x=MXSPD, fill=Location))+
geom_histogram(binwidth = 1,alpha=0.55,colour="black",size=0.25)+#, aes(fill = ..count..) )
theme(
text=element_text(size=15,color="black"),
plot.title=element_text(size=15,family="myfont",face="bold.italic",hjust=.5,color="black"),#,
legend.position=c(0.8,0.8),
legend.background = element_blank()
)
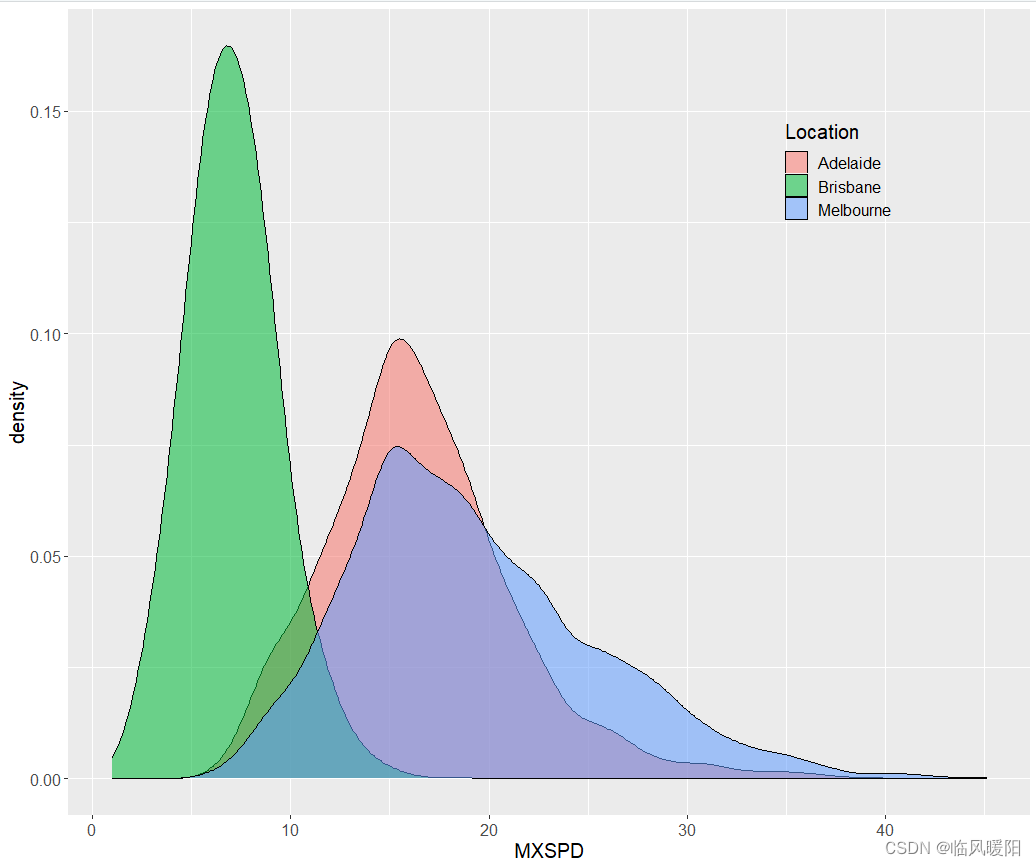
#----------------------------------------(b2)多数剧系列核密度估计图----------------------------------
ggplot(df, aes(x=MXSPD,  fill=Location))+
  geom_density(alpha=0.55,bw=1,colour="black",size=0.25)+
  theme(
    text=element_text(size=15,color="black"),
    plot.title=element_text(size=15,family="myfont",face="bold.italic",hjust=.5,color="black"),#,
    legend.position=c(0.8,0.8),
    legend.background = element_blank()
  )
开发工具:RStudio与Alt+A截屏工具


 296
296


 被折叠的 条评论
为什么被折叠?
被折叠的 条评论
为什么被折叠?
 到【灌水乐园】发言


