


import numpy as np
import matplotlib.pyplot as plt
from matplotlib.markers import MarkerStyle
from matplotlib.transforms import Affine2D
from matplotlib.text import TextPath
from matplotlib.colors import Normalize
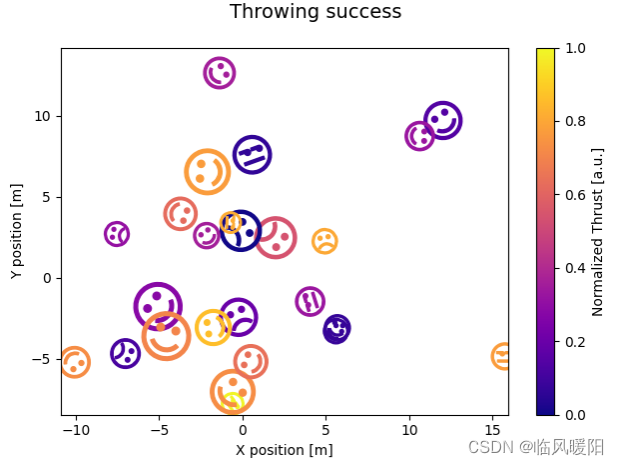
SUCCESS_SYMBOLS = [
TextPath((0, 0), "☹"),
TextPath((0, 0), "😒"),
TextPath((0, 0), "☺"),
]
N = 25
np.random.seed(42)
skills = np.random.uniform(5, 80, size=N) * 0.1 + 5
takeoff_angles = np.random.normal(0, 90, N)
thrusts = np.random.uniform(size=N)
successful = np.random.randint(0, 3, size=N)
positions = np.random.normal(size=(N, 2)) * 5
data = zip(skills, takeoff_angles, thrusts, successful, positions)
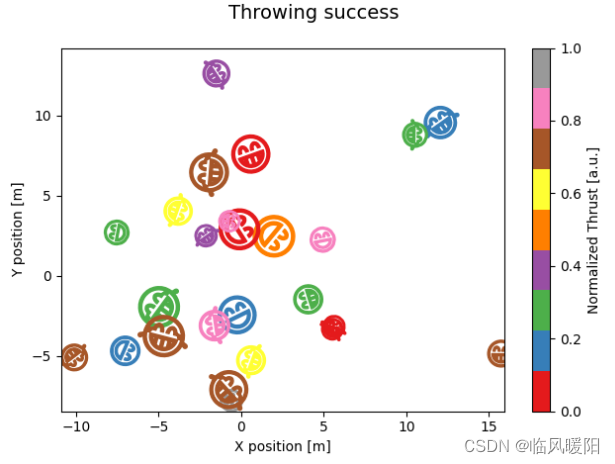
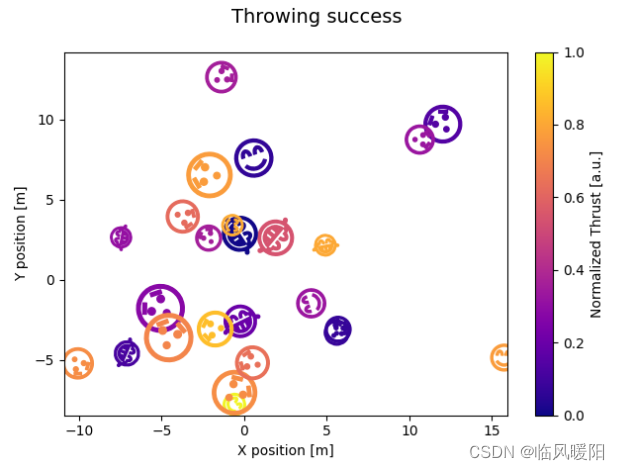
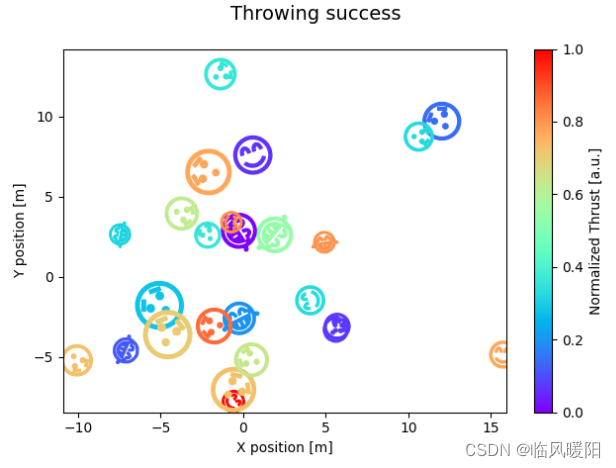
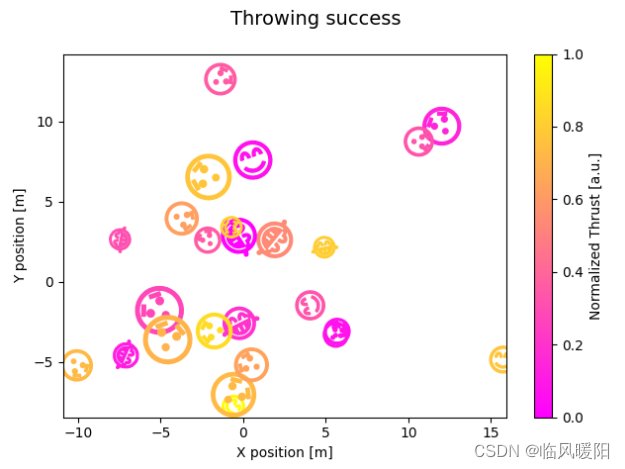
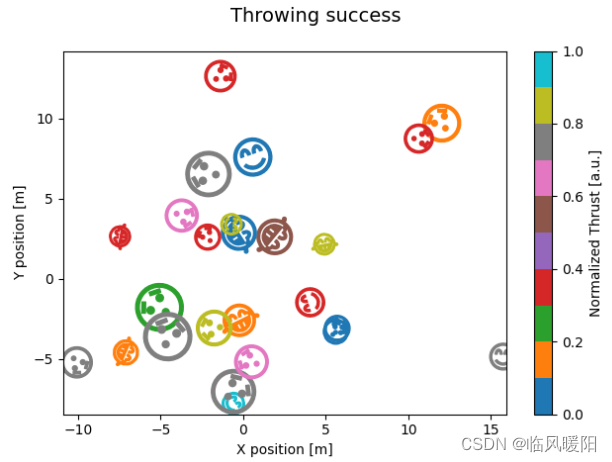
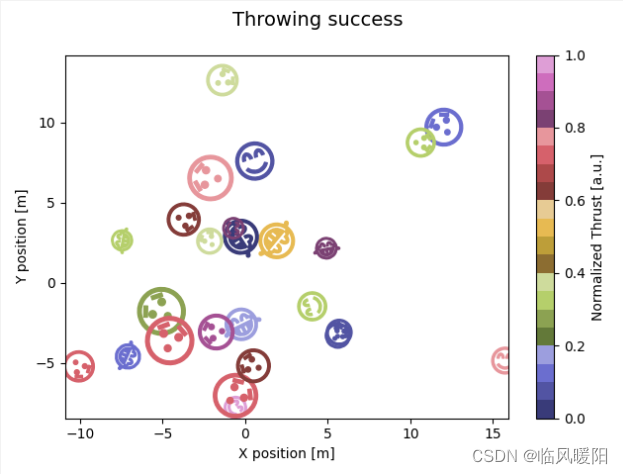
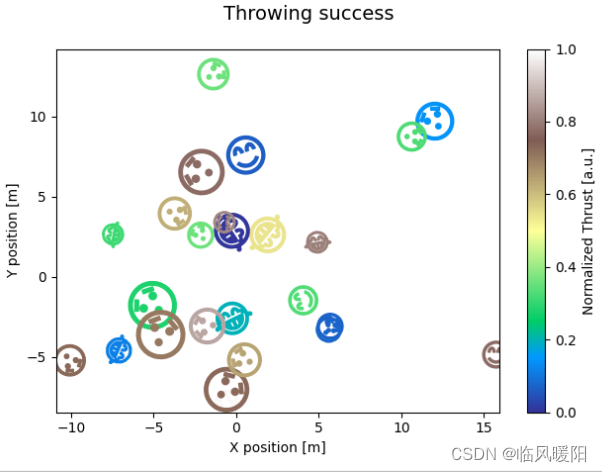
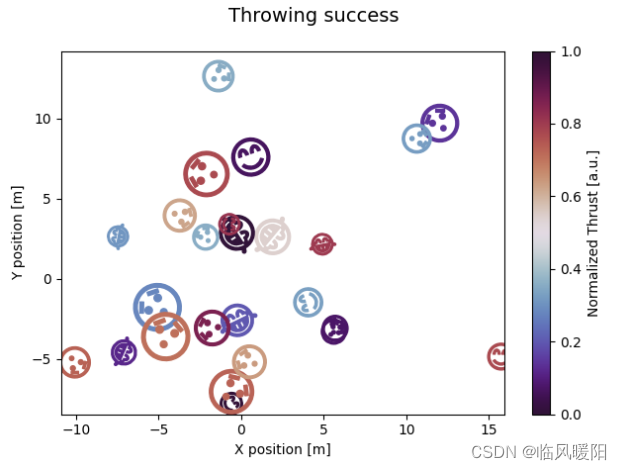
cmap = plt.colormaps["plasma"]
fig, ax = plt.subplots()
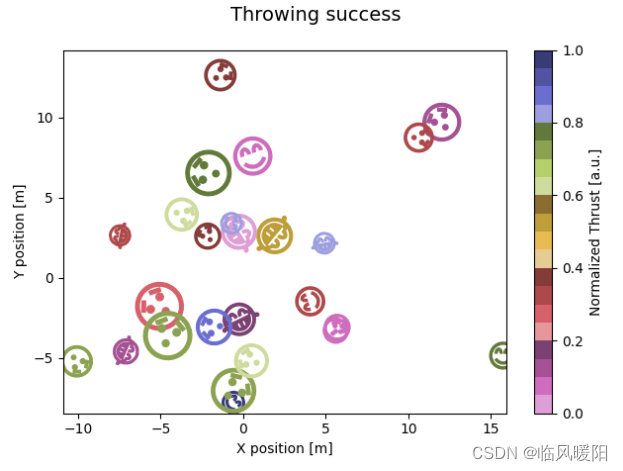
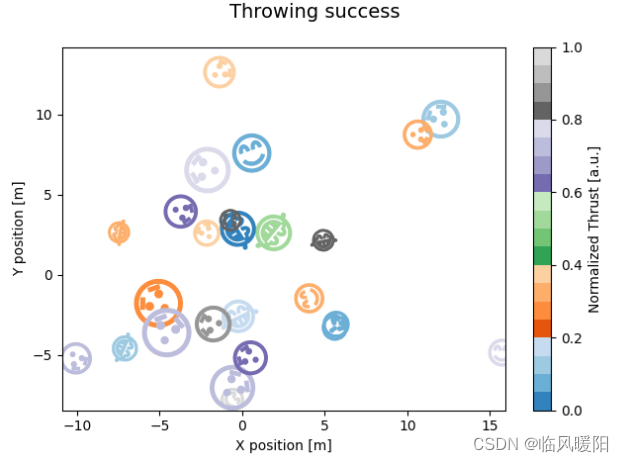
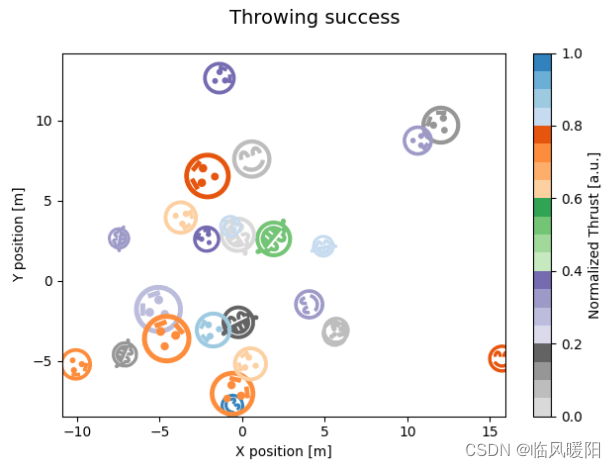
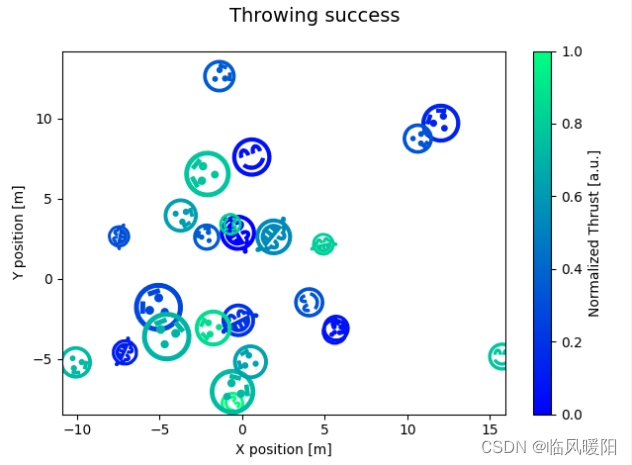
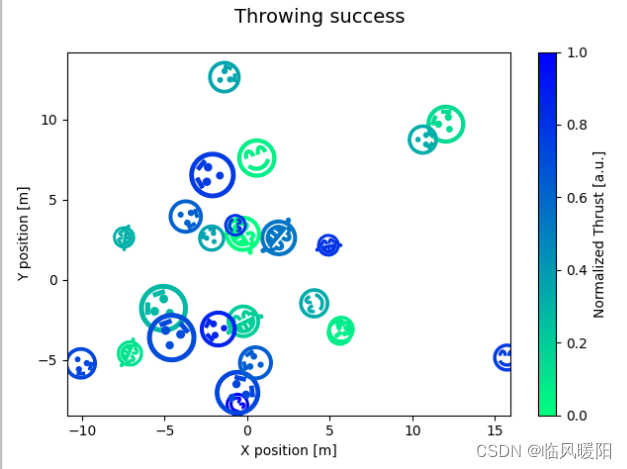
fig.suptitle("Throwing success", size=14)
for skill, takeoff, thrust, mood, pos in data:
t = Affine2D().scale(skill).rotate_deg(takeoff)
m = MarkerStyle(SUCCESS_SYMBOLS[mood], transform=t)
ax.plot(pos[0], pos[1], marker=m, color=cmap(thrust))
fig.colorbar(plt.cm.ScalarMappable(norm=Normalize(0, 1), cmap=cmap),
ax=ax, label="Normalized Thrust [a.u.]")
ax.set_xlabel("X position [m]")
ax.set_ylabel("Y position [m]")
plt.show()
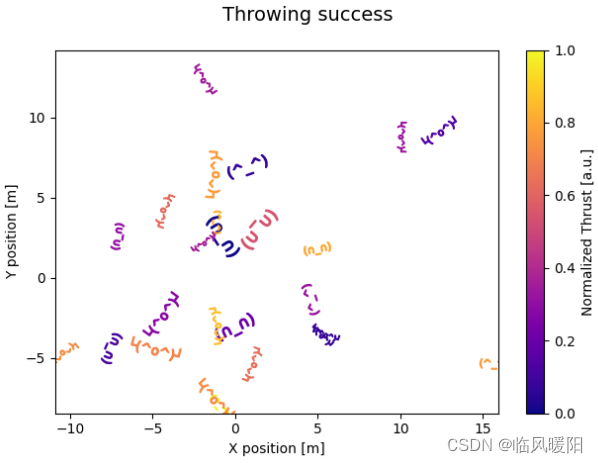
SUCCESS_SYMBOLS = [
    TextPath((0, 0), "(∩_∩)"),
    TextPath((0, 0), "(^_^)"),
    TextPath((0, 0), "└(^o^)┘"),
]
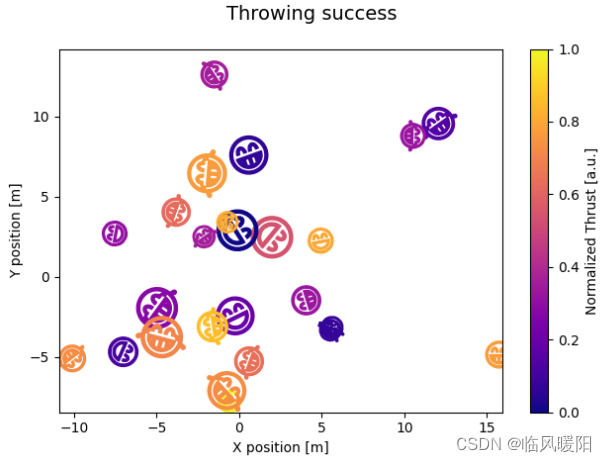
SUCCESS_SYMBOLS = [
    TextPath((0, 0), "😄"),
    TextPath((0, 0), "😁"),
    TextPath((0, 0), "😂"),
]
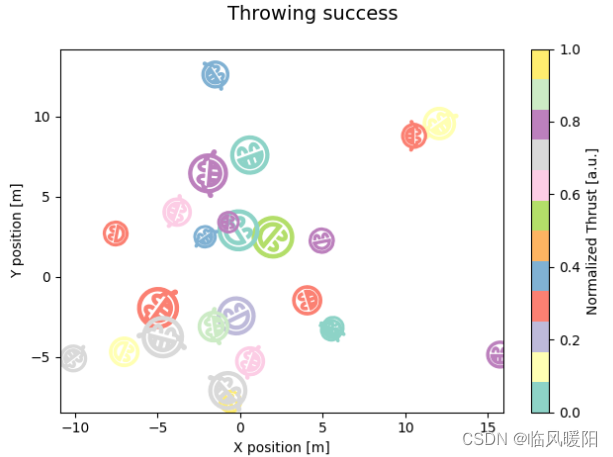
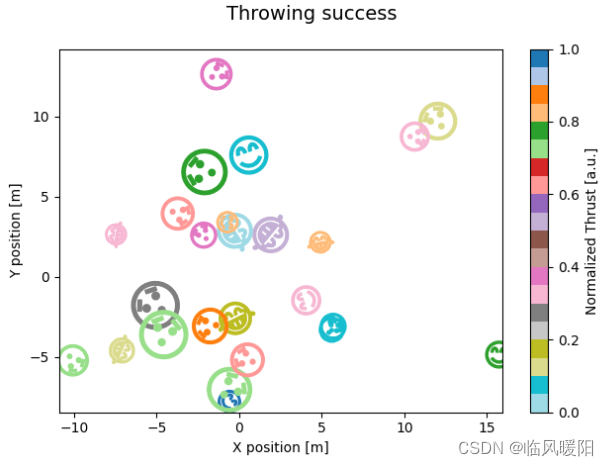
cmap = plt.colormaps["Set3"]
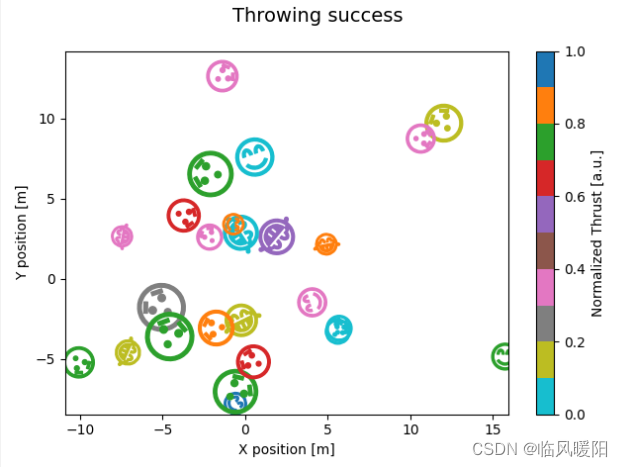
cmap = plt.colormaps["Set1"]
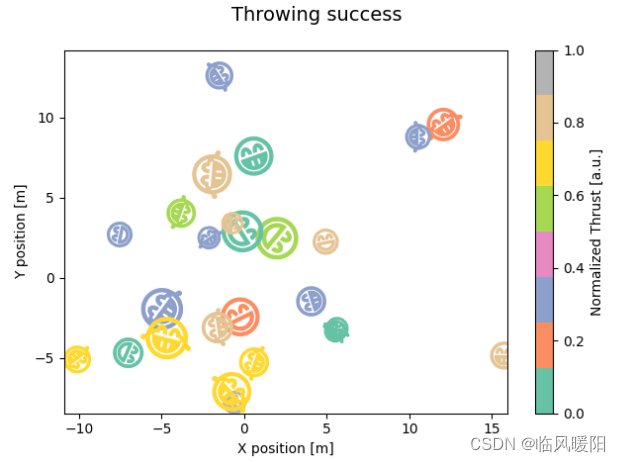
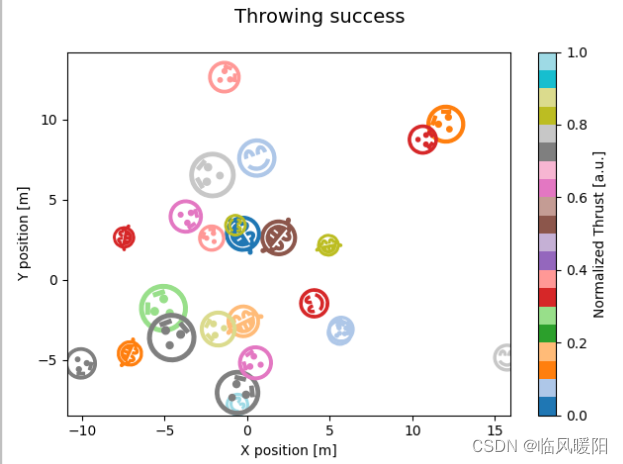
cmap = plt.colormaps["Set2"]
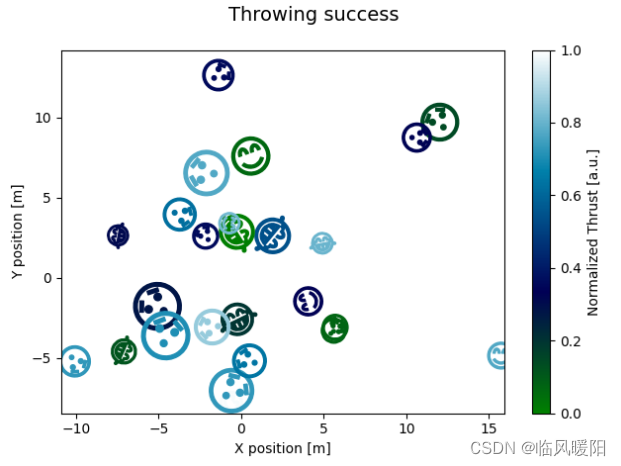
cmap = plt.colormaps["ocean"]
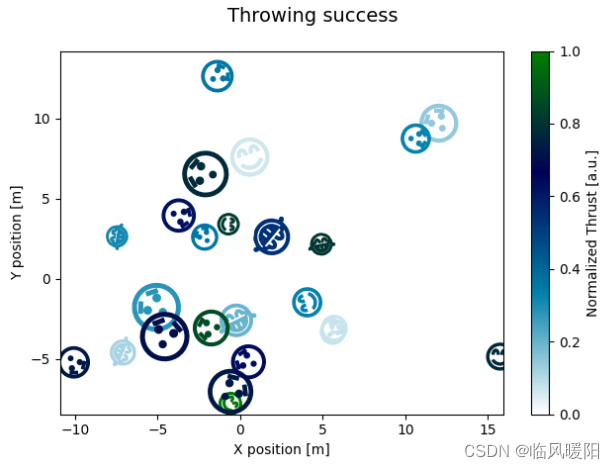
cmap = plt.colormaps["ocean_r"]
cmap = plt.colormaps["plasma"]
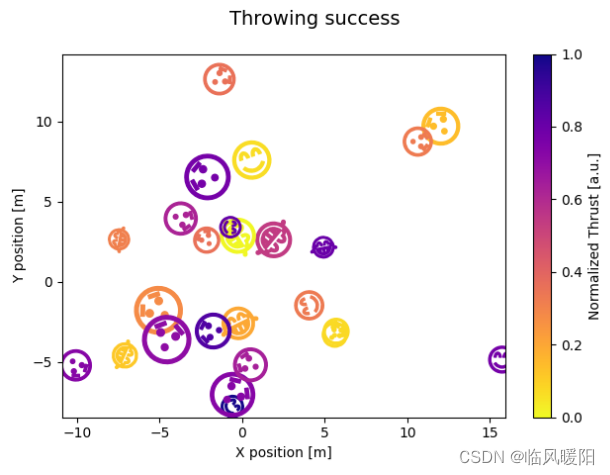
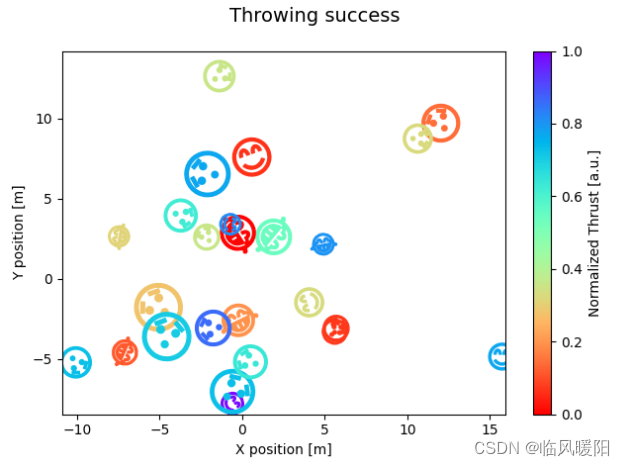
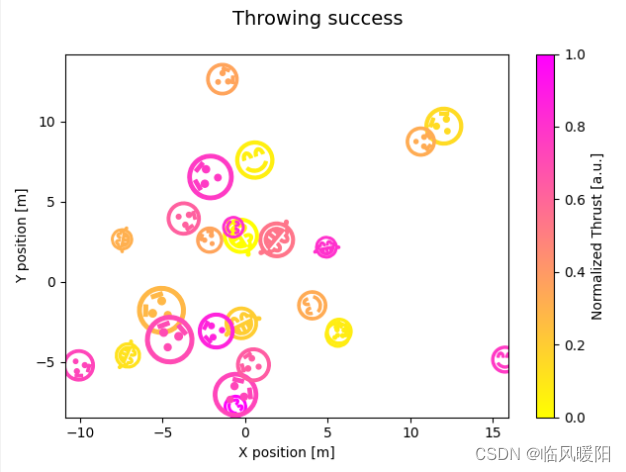
cmap = plt.colormaps["plasma_r"]
cmap = plt.colormaps["prism"]
cmap = plt.colormaps["prism_r"]
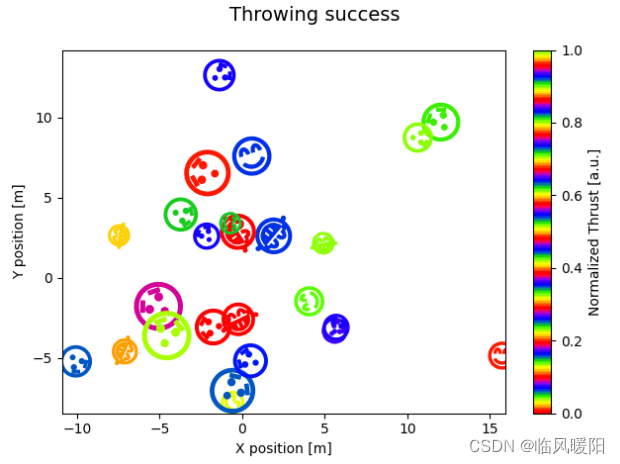
cmap = plt.colormaps["rainbow"]
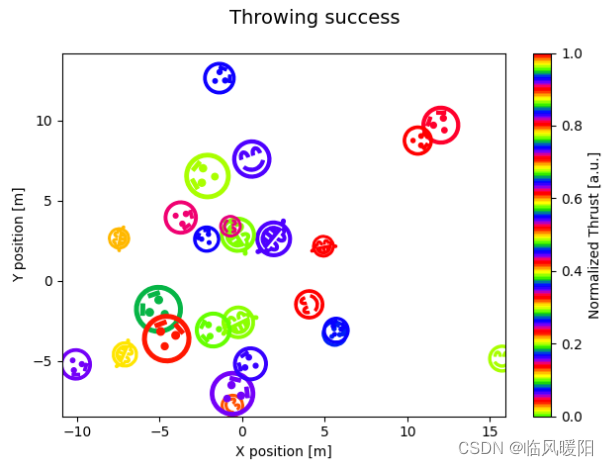
cmap = plt.colormaps["rainbow_r"]
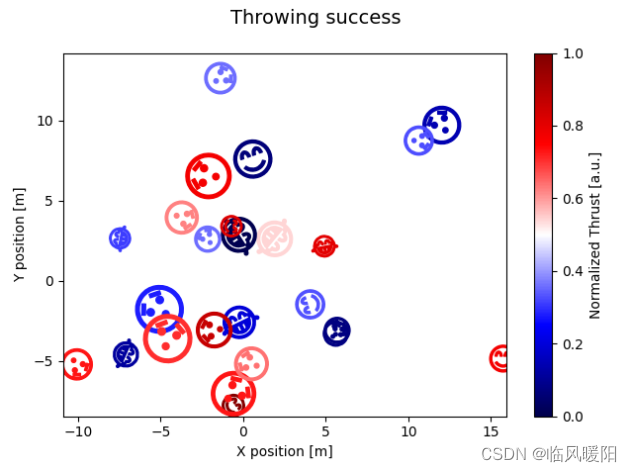
cmap = plt.colormaps["seismic"]
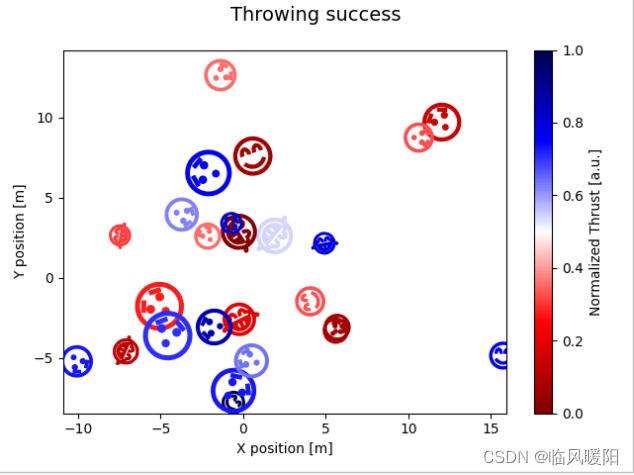
cmap = plt.colormaps["seismic_r"]
cmap = plt.colormaps["spring"]
cmap = plt.colormaps["spring_r"]
cmap = plt.colormaps["summer"]
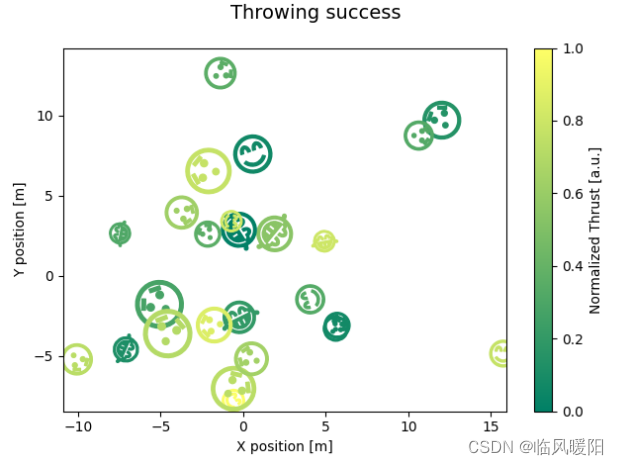
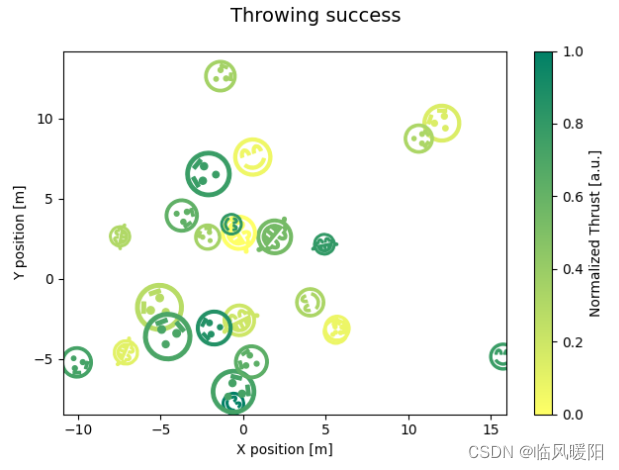
cmap = plt.colormaps["summer_r"]
cmap = plt.colormaps["tab10"]
cmap = plt.colormaps["tab10_r"]
cmap = plt.colormaps["tab20"]
cmap = plt.colormaps["tab20_r"]
cmap = plt.colormaps["tab20b"]
cmap = plt.colormaps["tab20b_r"]
cmap = plt.colormaps["tab20c"]
cmap = plt.colormaps["tab20c_r"]
cmap = plt.colormaps["terrain"]
cmap = plt.colormaps["terrain_r"]
cmap = plt.colormaps["twilight"]
cmap = plt.colormaps["twilight_r"]
cmap = plt.colormaps["twilight_shifted"]
cmap = plt.colormaps["twilight_shifted_r"]
cmap = plt.colormaps["viridis"]
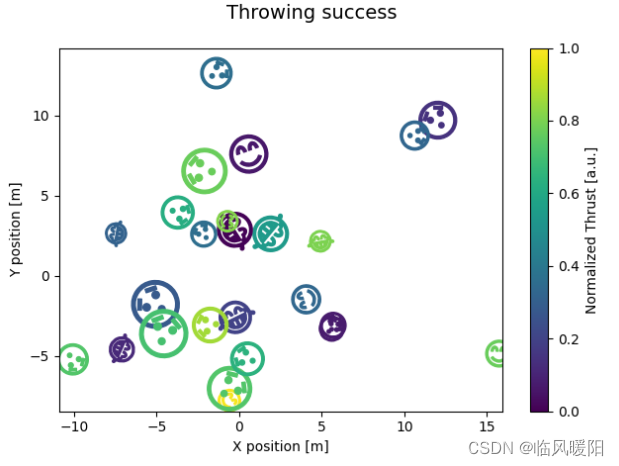
cmap = plt.colormaps["viridis_r"]
cmap = plt.colormaps["winter"]
cmap = plt.colormaps["winter_r"]
参考文献:https://matplotlib.org/stable/gallery/lines_bars_and_markers/multivariate_marker_plot.html#sphx-glr-gallery-lines-bars-and-markers-multivariate-marker-plot-py
百度搜索:表情符号大全
开发工具:PyCharm和微信Alt+A截屏工具


 1747
1747

 被折叠的 条评论
为什么被折叠?
被折叠的 条评论
为什么被折叠?
 到【灌水乐园】发言


