


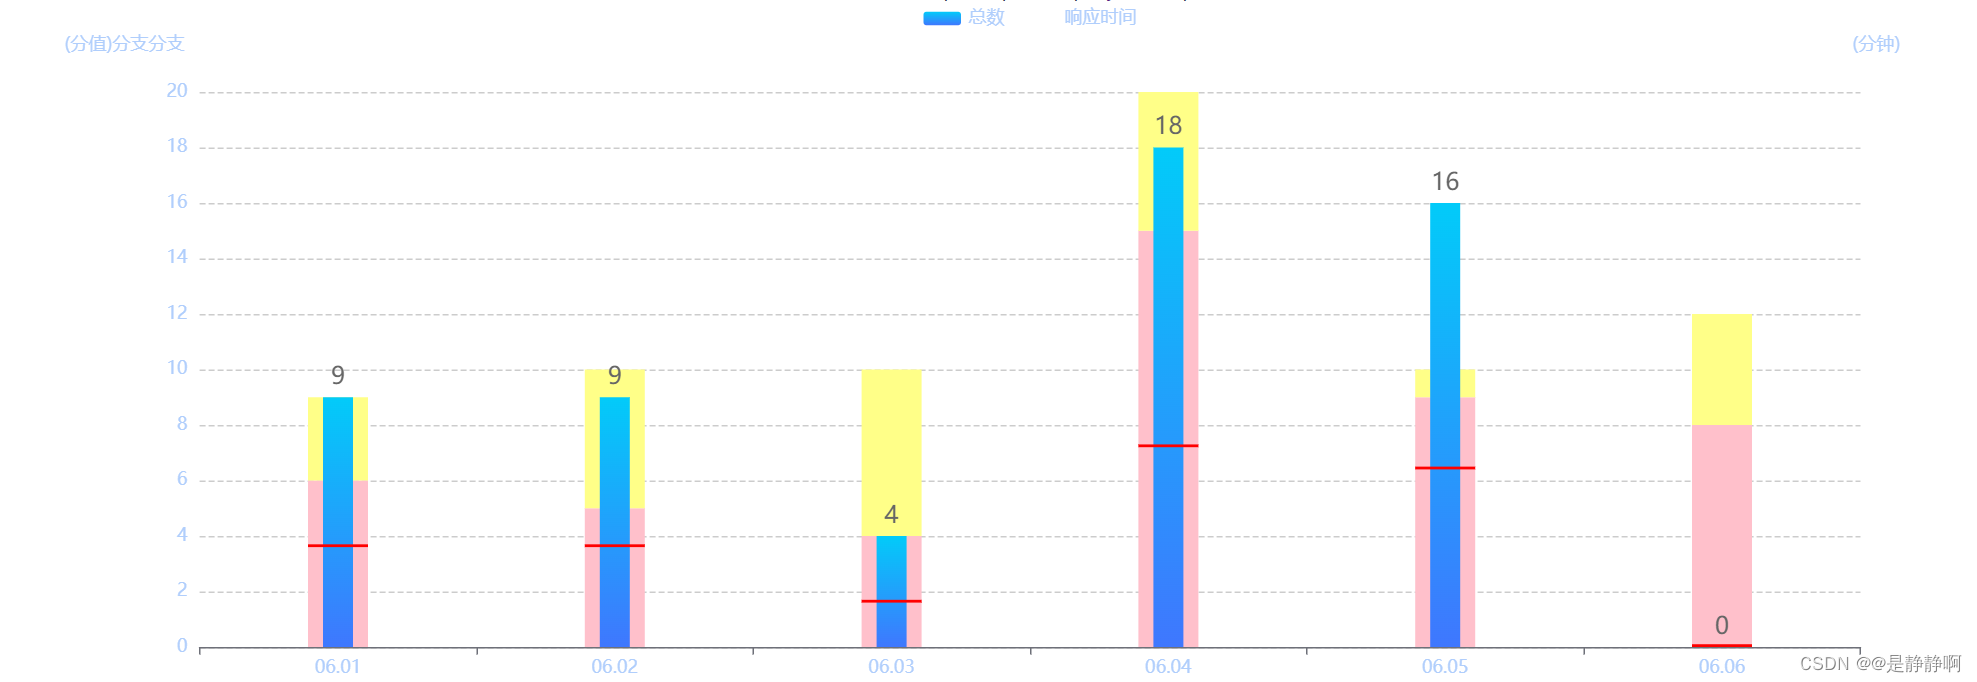
 该文章展示了一段Vue.js代码,使用Echarts库创建了一个包含多个Y轴的柱状图,展示了不同服务指标(如总数、响应时间和评价得分)随时间的变化。代码详细定义了图表的配置,包括颜色、轴标签、图例和数据系列。
效果图
代码
<template>
  <div class="mainFirst">
    <div id="main" style="width: 100%; height: 500px"></div>
  </div>
</template>

<script>
import * as echarts from "echarts";
export default {
  data() {
    return {};
  },
  mounted() {
    this.getMain();
  },
  methods: {
    getMain() {
      let chartDom = document.getElementById("main");
      let myChart = echarts.init(chartDom);
      // 基于准备好的dom,初始化echarts实例
      // 基于准备好的dom,初始化echarts实例
      let xAxis = ["06.01", "06.02", "06.03", "06.04", "06.05", "06.06"];
      let legend = ["总数", "响应时间", "接单时间", "评价得分"];
      let total = [9, 9, 4, 18, 16, 0];
      let res = [0.1, 0.1, 0.1, 0.1, 0.1, 0.1];
      // 	let order = [6.0, 7.3, 3.3, 4.5, 6.3, 10,];
      // 	let score = [1.0, 6, 5, 4.5, 4.3, 3.3, ];

      let option = {
        //默认色板
        color: ["#dd3ee5", "#12e78c", "#fe8104"],
        //标题,可以自定义标题的位置和样式
        title: {
          //text: '服务指标'
        },
        //鼠标hover提示框
        tooltip: {
          trigger: "axis", //触发类型;轴触发,axis则鼠标hover到一条柱状图显示全部数据,item则鼠标hover到折线点显示相应数据,
          axisPointer: {
            //坐标轴指示器,坐标轴触发有效,
            type: "line", //默认为line,line直线,cross十字准星,shadow阴影
            crossStyle: {
              color: "#fff",
            },
          },
        },

        //图例
        legend: {
          data: legend, //注意:图例的名字必须跟下面series数组里面的name一致
          itemHeight: 9, //改变圆圈大小
          textStyle: {
            color: "#B0CEFC", // 图例文字颜色
          },
        },
        //直角坐标系内绘图网格,设置表格显示区域
        grid: {
          // 	x: 38, //图表左上角到左边界的距离
          // 	y: 38, //图表左上角到上边界的距离
          // 	x2: 65, //图表右下角到右边界的距离
          // 	y2: 26, // 图表右下角到下边界的距离
        },
        xAxis: [
          {
            type: "category", //轴类型,横轴默认为类目型'category',纵轴默认为数值型'value',
            data: xAxis,
            axisPointer: {
              //坐标轴指示器
              type: "shadow", //在tooltip的cross基础上,增加阴影类型的X轴指示器
            },
            //坐标轴文字标签
            axisLabel: {
              show: true, //如果为false,则X轴不显示文字标签
              textStyle: {
                color: "#B0CEFC",
              },
            },
          },
          {
            show: false,
            type: "category", //轴类型,横轴默认为类目型'category',纵轴默认为数值型'value',
            data: xAxis,
            axisPointer: {
              //坐标轴指示器
              type: "line", //在tooltip的cross基础上,增加阴影类型的X轴指示器
            },
            //坐标轴文字标签
            axisLabel: {
              show: false, //如果为false,则X轴不显示文字标签
              textStyle: {
                color: "#B0CEFC",
              },
            },
          },
        ],
        yAxis: [
          //第一个Y轴
          {
            position: "left",
            type: "value", //轴类型,横轴默认为类目型'category',纵轴默认为数值型'value',
            name: "(分值)分支分支",
            min: 0, //Y轴最小值
            max: 20, //Y轴最大值
            interval: 2, //Y轴间隔
            //坐标轴文本样式,nameTextStyle和axisLabel区别是,前者管坐标轴顶端文字(坐标轴标题),或者管轴上断点的文字标签
            nameTextStyle: {
              align: "right",
              color: "#B0CEFC",
              padding: 10, //内边距
            },
            //坐标轴文字标签
            axisLabel: {
              show: true,
              textStyle: {
                color: "#B0CEFC",
              },
            },
            //坐标轴线
            axisLine: {
              show: false,
            },
            //分割线/网格样式
            splitLine: {
              show: true,
              lineStyle: {
                color: "#ccc",
                // width: 1,
                type: "dashed", //实心,solid | dotted | dashed,
              },
            },
          },
          //第二个Y轴
          {
            position: "right",
            type: "value",
            name: "      (分钟)",
            min: 0, //Y轴最小值
            max: 20, //Y轴最大值
            interval: 2, //Y轴间隔
            nameTextStyle: {
              color: "#B0CEFC",
              padding: 10,
            },
            axisLabel: {
              show: false,
              textStyle: {
                color: "#B0CEFC",
              },
            },
            axisLine: {
              show: false,
            },
            //分割线/网格
            splitLine: {
              show: false, //是否显示网格
              lineStyle: {
                color: ["blue"],
                width: 1,
                type: "dotted",
              },
            },
          },
        ],
        series: [
          {
            z: 1,
            xAxisIndex: 2,
            stack: "shadowOffsetX",
            name: "响应时间222",
            type: "bar", //数据表现形式(bar为柱形图,line为折线图)
            // yAxisIndex:1, //选择index为1的Y轴作为参考系
            data: [6, 5, 4, 15, 9, 8],
            // stack:'data',
            barWidth: 40, //柱图宽度
            //线条样式,如折线图
            itemStyle: {
              normal: {
                //柱形图圆角,初始化效果
                // barBorderRadius: [10, 10, 10, 10],
                color: "pink",
              },
            },
          },
          {
            z: 2,
            xAxisIndex: 2,
            name: "响应时间222",
            stack: "shadowOffsetX",
            type: "bar", //数据表现形式(bar为柱形图,line为折线图)
            // yAxisIndex:1, //选择index为1的Y轴作为参考系
            data: [3, 5, 6, 5, 1, 4],
            // stack:'data',
            barWidth: 40, //柱图宽度
            //线条样式,如折线图
            itemStyle: {
              normal: {
                //柱形图圆角,初始化效果
                // barBorderRadius: [10, 10, 10, 10],
                color: "#ff8",
              },
            },
          },
          {
            name: "总数",
            data: total,
            z: "4",
            type: "bar", //数据表现形式(bar为柱形图,line为折线图)
            yAxisIndex: 1, //选择index为2的Y轴作为参考系
            xAxisIndex: 1, //选择index为2的Y轴作为参考系
            stack: "total",
            barWidth: 20, //柱图宽度
            color: new echarts.graphic.LinearGradient(
              0,
              1,
              0,
              0,
              [
                { offset: 0, color: "#3F77FE" }, //旧色板:紫色d223e7-f376e0 蓝色4962FC-768BFF 鹅黄色FF5C01-FD9E06 蓝色二 3F77FE-02CBF9
                { offset: 1, color: "#02CBF9" },
              ] //新色板:蓝色4962FC-189CBF 绿色18D070-12ED93
            ), //createChart图例色板:紫色dd3ee5  绿色12e78c  橙色fe8104 青色 01C2F9 暗蓝色4962FC 亮蓝色 4B7CF3
            //图形样式							//橙色图例色板:亮黄色 F4CB29 暗黄色 FD9E06
            itemStyle: {
              normal: {
                //柱形图圆角,初始化效果
                // barBorderRadius: [10, 10, 10, 10],
              },
            },
            //标签:顶部显示柱状图数值
            label: {
              normal: {
                show: true,
                position: "top",
                formatter: "{c}",
                textStyle: {
                  fontSize: 16,
                  color: "#666",
                },
              },
            },
          },
          {
            // xAxisIndex:1,
            name: "响应时间",
            type: "bar", //数据表现形式(bar为柱形图,line为折线图)
            stack: "data",
            yAxisIndex: 1, //选择index为1的Y轴作为参考系
            data: total.map((item) => {
              return item * 0.4;
            }),
            barWidth: 40, //柱图宽度
            //线条样式,如折线图
            itemStyle: {
              normal: {
                //柱形图圆角,初始化效果
                // barBorderRadius: [10, 10, 10, 10],
                color: "rgba(0,0,0,0)",
              },
            },
          },
          {
            // xAxisIndex: 1,
            name: "响应时间",
            type: "bar", //数据表现形式(bar为柱形图,line为折线图)
            yAxisIndex: 1, //选择index为1的Y轴作为参考系
            data: res,
            stack: "data",
            z: "5",
            barWidth: 40, //柱图宽度
            //线条样式,如折线图
            itemStyle: {
              normal: {
                //柱形图圆角,初始化效果
                // barBorderRadius: [10, 10, 10, 10],
                color: "red",
              },
            },
          },
        ],
      };
      myChart.setOption(option);
    },
  },
};
</script>

<style scoped>
.mainFirst {
  display: flex;
  justify-content: space-between;
  padding: 0 20px 10px 20px;
}
</style>


 被折叠的 条评论
为什么被折叠?
被折叠的 条评论
为什么被折叠?
 到【灌水乐园】发言


