


一、信用卡风险评估
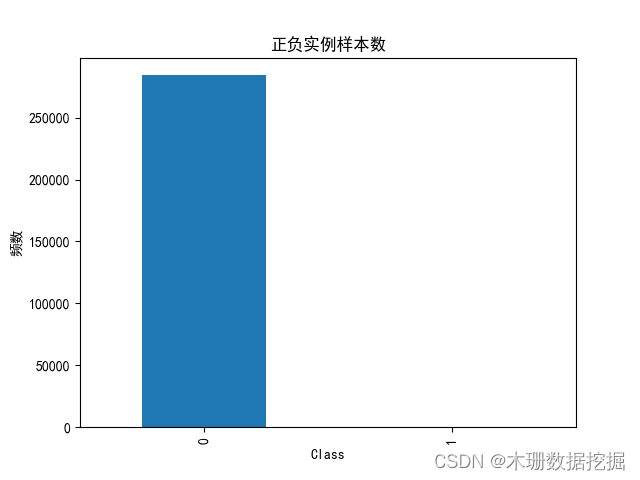
这是一个二分类问题,0表示无风险用户,1表示有风险用户。显然数据集的0类别和1类别是不均衡的,后续建模我们会采用过采样或下采样处理。
import pandas as pd
import matplotlib.pyplot as plt
from pylab import mpl
mpl.rcParams['font.sans-serif']=['Simhei'] #设置中文字体
mpl.rcParams['axes.unicode_minus']=False #解决图像保存时‘-’显示为方框的问题
data=pd.read_csv(r"【逻辑回归数据】creditcard.csv",encoding='utf8')
print(data.head())
labels_count=pd.value_counts(data['Class']) #统计class类中0和1的频数
print(labels_count)
plt.title('正负实例样本数')
plt.xlabel('类别')
plt.ylabel('频数')
labels_count.plot(kind='bar') #画条形图
'''
数据标准化:Z标准化,数据量纲不同则要标准化
'''
from sklearn.preprocessing import StandardScaler
scaler=StandardScaler() #将StandardScaler实例化
data['Amount']=scaler.fit_transform(data[['Amount']]) #将Amount标准化处理
print(data.head())
data=data.drop(['Time'],axis=1) #删除Time列
'''
建模
'''
from sklearn.model_selection import train_test_split
x_whole=data.drop('Class',axis=1)
y_whole=data.Class #将X和Y分离
x_train_w,x_test_w,y_train_W,y_test_W=train_test_split(x_whole,y_whole,
test_size=0.3,random_state=0) #切分数据集,测试集为30%,随机划分
from sklearn.linear_model import LogisticRegression
lr=LogisticRegression()
lr.fit(x_train_w,y_train_W) #做逻辑回归,结果储存在lr里面
print('预测结果')
#预测结果
train_predicted=lr.predict(x_train_w) #得到预测值
print(train_predicted)
from sklearn import metrics
print(metrics.classification_report(y_train_W,train_predicted)) #打印混淆矩阵
#可视化混淆矩阵
def cm_plot (y,yp):
from sklearn.metrics import confusion_matrix
import matplotlib.pyplot as plt
cm=confusion_matrix(y,yp)
plt.matshow(cm,cmap=plt.cm.Blues)
plt.colorbar()
for x in range (len(cm)):
for y in range (len(cm)):
plt.annotate(cm[x,y],xy=(y,x),horizontalalignment='center',
verticalalignment='center')
plt.ylabel('True label')
plt.xlabel('Predicted label')
return plt
cm_plot(y_train_W,train_predicted).show()
#预测结果
test_predicted=lr.predict(x_test_w)
from sklearn import metrics
print(metrics.classification_report(y_test_W,test_predicted))
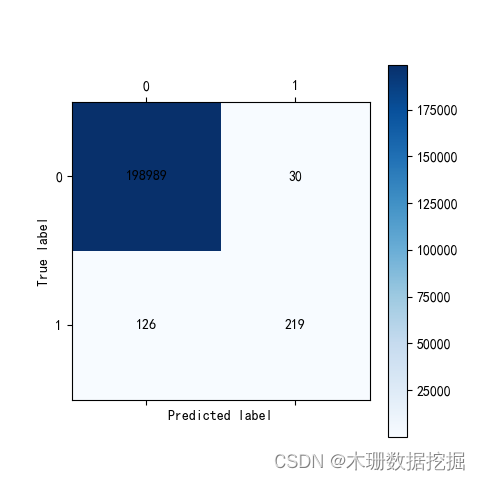
cm_plot(y_test_W,test_predicted)如下图,是没有做数据平衡得出的分类结果,有126个真实标签为1类别,但模型预测为0类别,所以模型倾向于把类别预测为0类别。


 被折叠的 条评论
为什么被折叠?
被折叠的 条评论
为什么被折叠?
 到【灌水乐园】发言


