


前言
实现方法是利用pandas.to_html()与表格展示的美化相结合,使数据展示更美观.
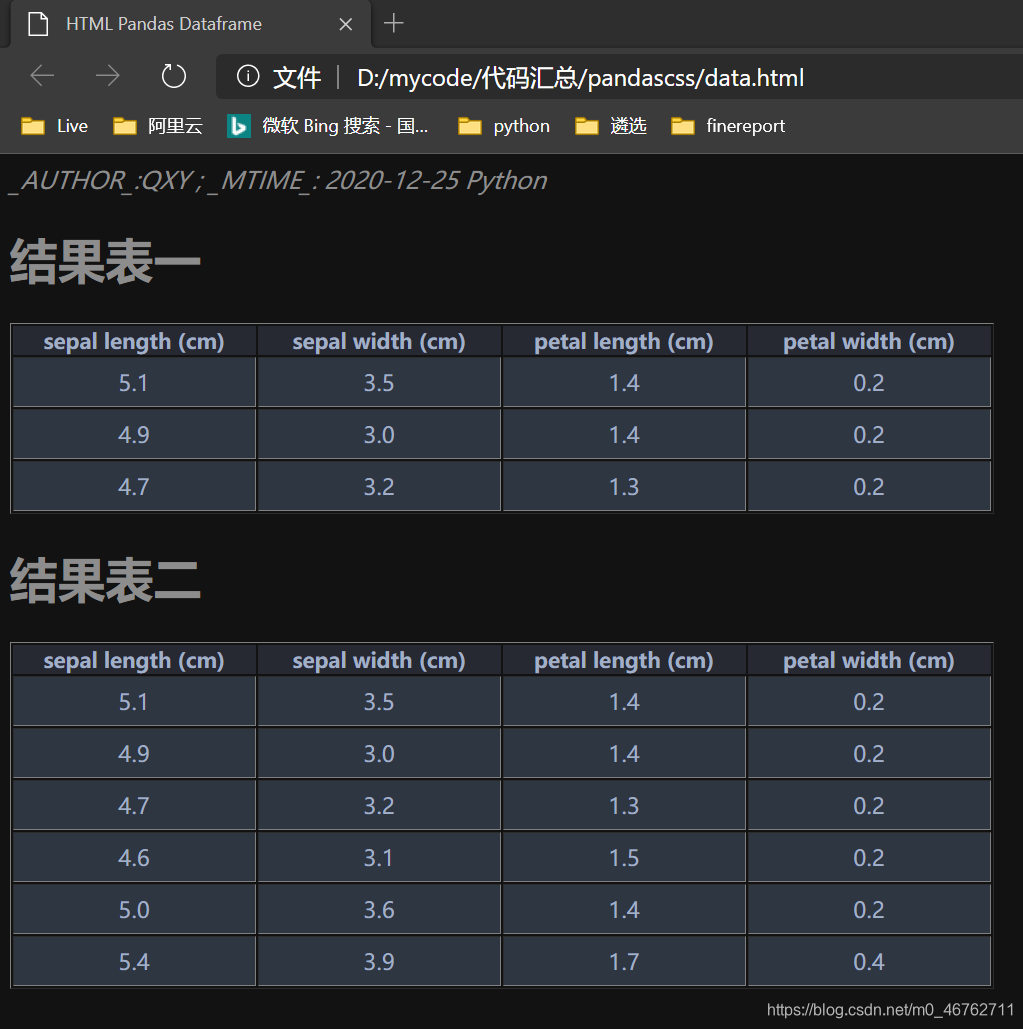
一、效果图
示例:
二、代码
本文将使用鸢尾花数据集作为示例进行展示
1.引入库
import pandas as pd
import os
2.函数定义
设置列名为居中:pd.set_option(‘colheader_justify’, ‘center’),否则将默认展示为靠左对齐
data_group为需要展示的表格的集合,列表形式,
classnames为对应的表名,
name为自定义的html文件名,默认使用‘data.html’,
col_width为自定义最小列宽,默认使用200
"STYLE"定义了各类标签的样式
“AUTHOR:QXY ; MTIME: ‘’’+datetime.date.today().isoformat()+’ Python”此处记录作者、时间
def datas_tohtml(data_group, classnames, name='data.html', col_width=200):
    pd.set_option('colheader_justify', 'center')  # FOR TABLE <th>
    STYLE = \
        '''<html>
        <meta name="color-scheme" content=
最低0.47元/天 解锁文章


 2239
2239


 被折叠的 条评论
为什么被折叠?
被折叠的 条评论
为什么被折叠?
 到【灌水乐园】发言


