


 本文介绍了如何在Python环境中使用pip安装matplotlib模块。首先确保Python已安装,然后升级pip和setuptools,接着通过命令行使用pip安装matplotlib。安装完成后,通过pip list检查安装是否成功,并在Python IDLE中导入matplotlib验证其可用性。
matplotlib是python中强大的画图模块。
首先确保已经安装python,然后用pip来安装matplotlib模块。
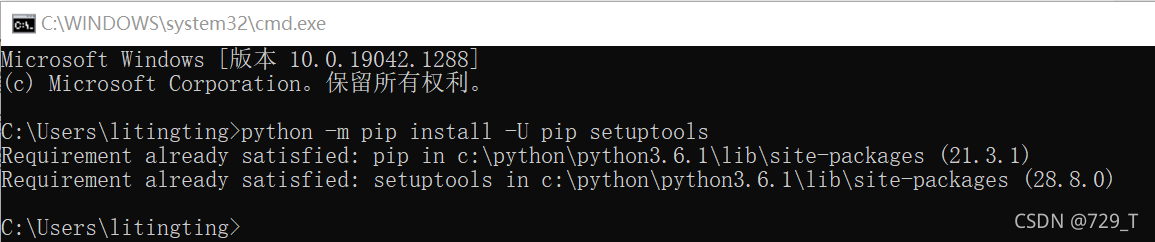
进入到cmd窗口下,建议执行python -m pip install -U pip setuptools进行升级。
接着键入python -m pip install matplotlib进行自动的安装,系统会自动下载安装包。
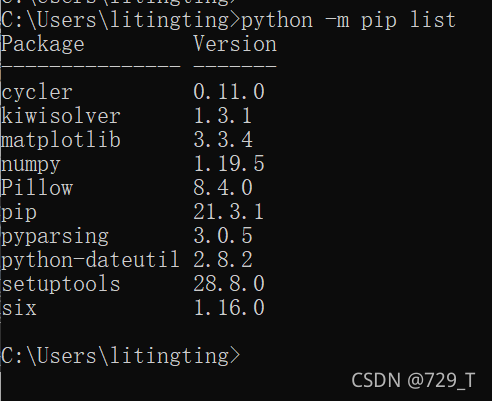
安装完成后,可以用python -m pip list查看本机的安装的所有模块,确保matplotlib已经安装成功。
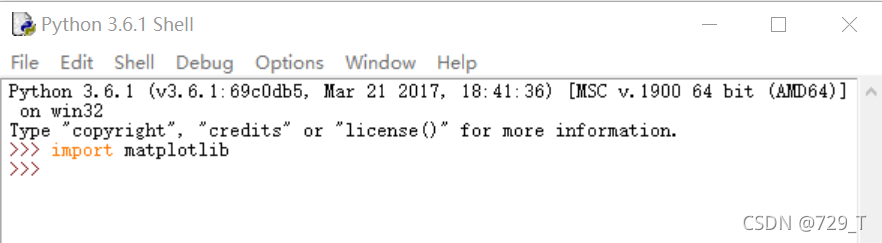
进入到python idle中,运行import matplotlib,如下图所示,如果没有报错提示,那就可以开始使用了。
>>> import matplotlib.pyplot as plt
>>>
>>> import matplotlib.pyplot as plt
>>> labels='frogs','hogs','dogs','logs'
>>> sizes=15,20,45,10
>>> colors='yellowgreen','gold','lightskyblue','lightcoral'
>>> explode=0,0.1,0,0
>>> plt.pie(sizes,explode=explode,labels=labels,colors=colors,autopct='%1.1f%%',shadow=True,startangle=50)
([<matplotlib.patches.Wedge object at 0x000002F7CA617358>, <matplotlib.patches.Wedge object at 0x000002F7CA617CC0>, <matplotlib.patches.Wedge object at 0x000002F7CA630630>, <matplotlib.patches.Wedge object at 0x000002F7CA630F60>], [Text(0.19101297852949148, 1.0832885312940832, 'frogs'), Text(-1.0392305063875689, 0.5999999621611969, 'hogs'), Text(0.19101304051130774, -1.083288520365016, 'dogs'), Text(0.9526279198459328, 0.5500000421181905, 'logs')], [Text(0.10418889737972262, 0.5908846534331362, '16.7%'), Text(-0.6062177953927483, 0.3499999779273648, '22.2%'), Text(0.10418893118798604, -0.5908846474718268, '50.0%'), Text(0.5196152290068723, 0.30000002297355843, '11.1%')])
>>> plt.show()
运行结果:


 1542
1542

 被折叠的 条评论
为什么被折叠?
被折叠的 条评论
为什么被折叠?
 到【灌水乐园】发言


