


 文章介绍了PQEOTF(PerceptualQuantizationEfficiencyOptimizationTransform)在HDR(HighDynamicRange)视频编码中的作用,以及如何根据不同的显示亮度进行调整。作者通过Python代码展示了PQ(PerceptualQuantizer)和亮度转换的过程,强调了在低亮度设备上显示时对高亮部分的处理方法。
文章为本人学习笔记 - 转载请告知,并注明出处
[参考资料]
- 继上一篇,参考如下框图:
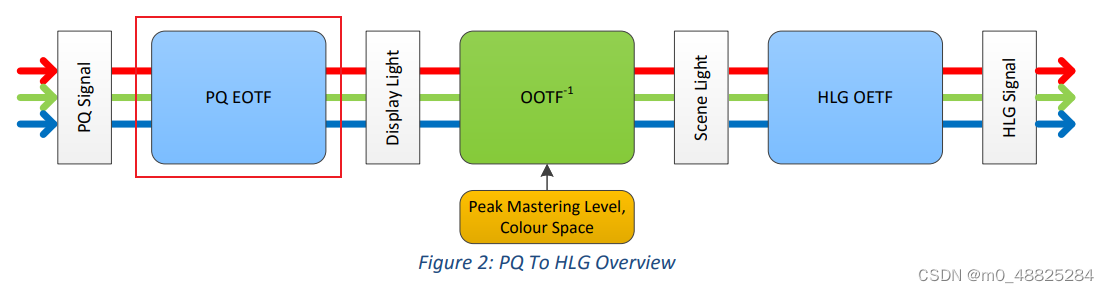
- 先从 PQ EOTF 开始理解。公式如下 (参考:ITU-R BT.2100-0):
https://www.itu.int/dms_pubrec/itu-r/rec/bt/R-REC-BT.2100-0-201607-S!!PDF-E.pdf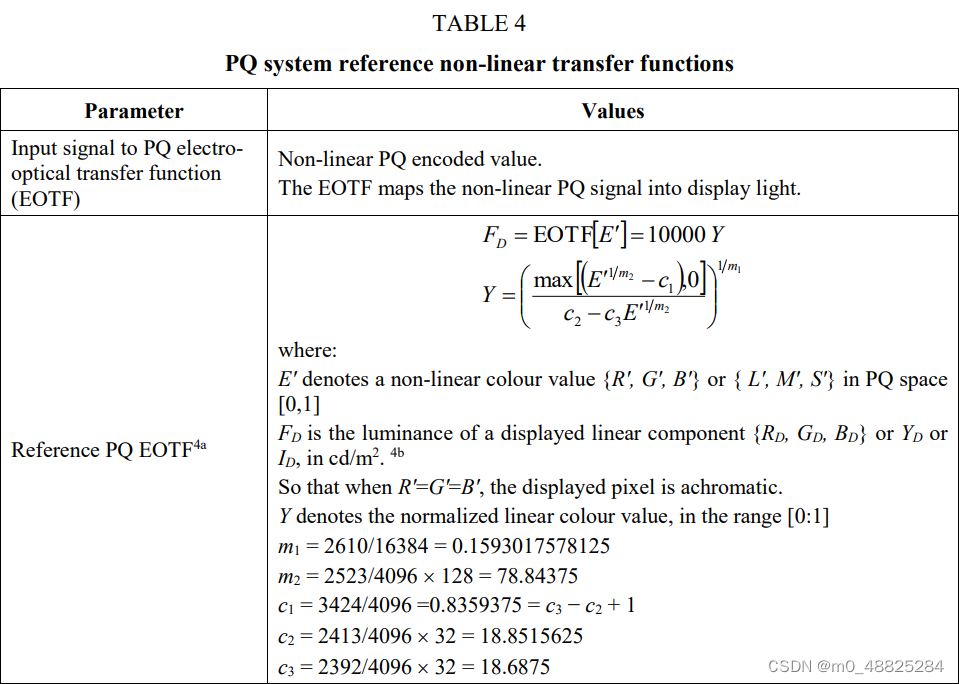
- python 绘图 (参考:https://zhuanlan.zhihu.com/p/109245779)
- 用 python 画 PQ EOTF (FD) (蓝色曲线):
import numpy as np
import matplotlib.pyplot as plt

m1 = 2610/16384
m2 = 2523/4096 * 128
c1 = 3424/4096
c2 = 2413/4096 * 32
c3 = 2392/4096 * 32

E_1 = np.arange(1024)/1023      # range = [0, 1]

a_1 = np.power(E_1, 1/m2) - c1
a_1[a_1 < 0] = 0      # 小于 0 的部分,设为 0

a_2 = c2 - c3 * np.power(E_1, 1/m2)

a_3 = a_1/a_2

Y = np.power(a_3, 1/m1)
FD = 10000 * Y

plt.figure(1)
plt.plot(E_1, FD)

Lw = 6000
FD_1 = (Y * 10000)/Lw
FD_1[FD_1 > 1] = 1      # 大于 1 的部分,设为 1

plt.plot(E_1, 6000 * FD_1)
plt.show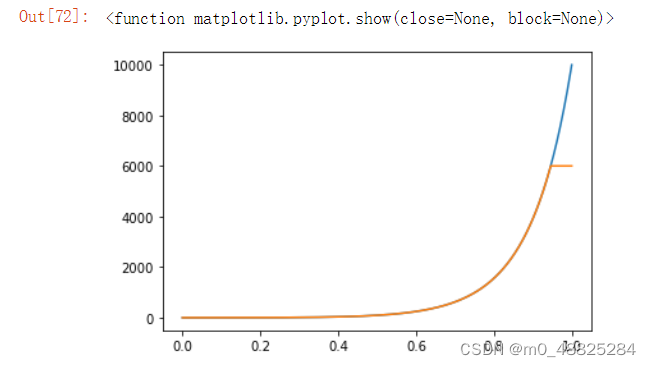
- 上方 FD = 10000 * Y, 是假设用来处理 PQ HDR 视频的 mastering monitor 亮度可达 10000 nits.
- PQ 为绝对亮度系统。若实际用户端播放用的 display brightness 低,例如只有 6000 nits, 则高亮的部分最多只能到 6000 nits, 超过的部分将以 6000 nits 显示。可参考如下公式:
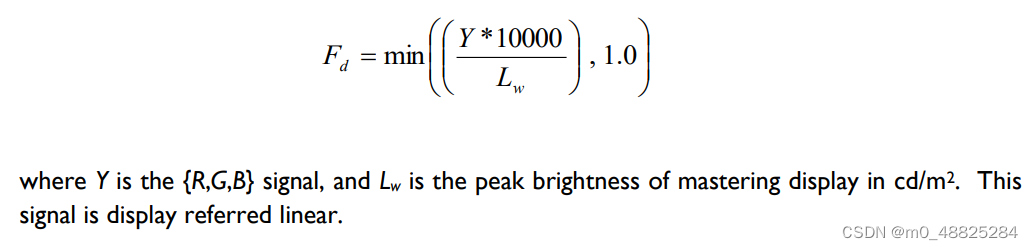
- 将上式的 Fd 乘以 6000,可画出上图的橙色曲线。
- 以上内容若有错,请指正。


 1786
1786

 被折叠的 条评论
为什么被折叠?
被折叠的 条评论
为什么被折叠?
 到【灌水乐园】发言


