


1. 下载
下载连接:https://github.com/ecomfe/echarts-for-weixin.
2. 放到项目上
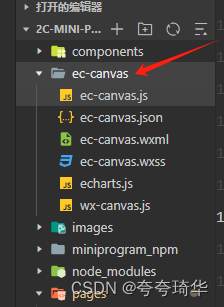
3.在index.son引入组件
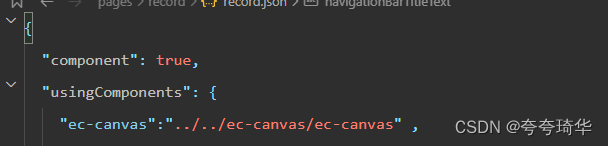
"component": true,
  "usingComponents": {
    "ec-canvas":"../../ec-canvas/ec-canvas" ,
    "select-popup": "../../components/select-pop/select-pop"
  },
4. 页面使用 (force-use-old-canvas=“true” :::: j解决图表不跟页面滚动问题)
//html
<view class="chartBox">
        <ec-canvas force-use-old-canvas="true" id="myChart" option="ops" canvas-id="myChart" ec="{{ec}}"></ec-canvas>
</view>

//css
/* 定义容器大小 */
.chartBox{
  width: 100%;
  height: 500rpx;
  z-index:0
}

/* ec-canvas 组件宽高与父元素一致即可 */
ec-canvas{
  width: 100%;
  height: 500rpx;
}
5. js
// 引入
import * as echarts from '../../ec-canvas/echarts';

data{
	ec: {
	      // 使用 onInit 方法定义
	      onInit: '',
	      // lazyLoad: true //开启懒加载
	    },
	    xdata: [],
    	seriesData: []

}


  // 定义 initChart 方法
// initChart 需要传递四个参数 canvas, width, height, dpr
initChart(canvas, width, height, dpr) {
  // 使用引入的 echarts的init方法对 chart 变量赋值进行初始化
  const chart = echarts.init(canvas, null, {
    width: width,
    height: height,
    devicePixelRatio: dpr // 像素
  });
  canvas.setChart(chart);
  chart.setOption(this.getOption());
  return chart;
},

//设置图表各项数据
  getOption() {
    let option =  {
      // title: {
      //   text: "暂无数据",
      //   x: "center",
      //   y: "center",
      // },
      xAxis: {
        type: 'category',
        boundaryGap : false,
        data: this.data.xdata,
        axisLabel: {
          show: true,
          rotate: 35,//35度角倾斜显示
      },

      },
      yAxis: {
        type: 'value'
      },
      series: [
        {
          dname:'训练时间',
          type:'line',
          smooth:true,
          itemStyle: {normal: {areaStyle: {type: 'default'}}},
          data: this.data.seriesData, //[20,30,40,20,25,30,20] ||
          color: ['#8CDFC6'],
          lineStyle: {
            color: '#8CDFC6' // 设置线的颜色为红色
          }
        }
      ]
    }
    return option;
  },


//获取数据,
getList(id){
    request.request({
      url:'XXXX',
      method:'GET',
      data:data
    }).then(res=>{
    //根据自己返回数据写
      let  data = res.data
      let xdata = []
      let seriesData = []
      for(let i = 0; i< data.length; i++) {
        xdata.push( data[i].time)
        seriesData.push(data[i].runTimeNum)
      }
      this.setData({
        xdata: xdata,
        seriesData: seriesData,
        ec:{
          onInit:this.initChart
        },
      })
    })
  },


 1万+
1万+


 被折叠的 条评论
为什么被折叠?
被折叠的 条评论
为什么被折叠?
 到【灌水乐园】发言


