


目录
在js中for循环添加Echarts中的series属性的主要方法:
 var series = [];
      var finishTime = [];
      for (var i = 0, len = this.newList.length; i < len; i++) {
        //  for循环语法结构 注意这个带有,
        finishTime.push(this.newList[i].finishTime); //  这里是时间获取时间数据
        series.push({
          name: this.newList[i].volume,
          type: "line",
          smooth: true,
          label: {
            normal: {
              show: true,
              position: "top",
              color: "#424242",
              fontSize: 12,
            },
          },
          data: [
            this.newList[i].open,
            this.newList[i].close,
            this.newList[i].height,
            this.newList[i].low,
            this.newList[i].avg,
          ],
        });
      }
1.首先定义变量
var series = [];
var finishTime = [];
2.根据后台查询出来的数据循环添加到变量中
 var series = [];
      var finishTime = [];
      for (var i = 0, len = this.newList.length; i < len; i++) {
        //  for循环语法结构 注意这个带有,
        //  这里是时间获取时间数据
        finishTime.push(this.newList[i].finishTime);
        series.push({
          name: this.newList[i].volume,
          type: "line",
          smooth: true,
          label: {
            normal: {
              show: true,
              position: "top",
              color: "#424242",
              fontSize: 12,
            },
          },
          data: [
            this.newList[i].open,
            this.newList[i].close,
            this.newList[i].height,
            this.newList[i].low,
            this.newList[i].avg,
          ],
        });
      }
3.赋值到Echarts的series属性中
var option = {
        title: {
          text: "添加标题",
          subtext: "副标题",
          left: "left",
        },
        xAxis: {
          type: "category",
          // data: ["Mon", "Tue", "Wed", "Thu", "Fri", "Sat", "Sun"],
          data: finishTime,                        //  1.这里是赋值获取时间数据!!!!!!!!!
        },
        yAxis: {
          type: "value",
          axisLine: {
            show: true,
          },
        },
        legend: {
          //  这个必须要有,如果需要最上面'图例'的话就加,里面也要有data不需要就删掉
          // data: finishTime,  // series里面写name这里可以注释掉,写上会提示重复渲染打印台
        },
        // series: [    //  这是初始化样子
        //   {
        //     name: 'volume',
        //     type: "line",
        //     // stack: "Total",
        //     data: [120, 132, 101, 134, 90, 230, 210],
        //   },
        // ],
        series: series, //  2.这里是赋值给series数据!!!!!!!!!!!!!!!!!!!
      };
4.源码复制编译器即可查看修改
<template>
  <div class="echart">
    <!-- 先创建一个div容器,我用的是ref,可以用id去获取容器 -->
    <div
      ref="chart1"
      id="main_basicLine main_basicLine2"
      style="width: 100%; height: 400px"
    ></div>
  </div>
</template>

 <script>
let myChart5 = null; //  这里js代表全局块引入,或者写入data,每个都要加this.myChart5
export default {
  data() {
    return {
      newList: [
        //  这个数组,我是从接口复制过来放进去的,这样容易看,小技巧~~~,若是接口就直接请求接口 this.newList = res.data 这样即可
        {
          nftTypeId: "0xd40c03b8680d4b6a4d78fc3c6f6a28c854e94a79",
          startTime: "2022-03-04T05:23:15Z",
          endTime: "2022-03-04T05:23:42Z",
          finishTime: "2022-03-04T05:24:01.051Z",
          enumKLine: 0,
          open: 60,
          close: 3220,
          height: 3295,
          low: 3220,
          avg: 357.5,
          volume: 213,
          totalPrice: 700710,
          id: "6221a271856e88c08f1cbf7e",
          objectId: {
            timestamp: 1646371441,
            machine: 8744584,
            pid: -16241,
            increment: 1884030,
            creationTime: "2022-03-04T05:24:01Z",
          },
        },
        {
          nftTypeId: "0xd40c03b8680d4b6a4d78fc3c6f6a28c854e94a79",
          startTime: "2022-03-04T05:22:06Z",
          endTime: "2022-03-04T05:22:51Z",
          finishTime: "2022-03-04T05:23:01.416Z",
          enumKLine: 0,
          open: 320,
          close: 3260,
          height: 320,
          low: 3150,
          avg: 319.5,
          volume: 56,
          totalPrice: 180840,
          id: "6221a235856e88c08f1cbf6e",
          objectId: {
            timestamp: 1646371381,
            machine: 8744584,
            pid: -16241,
            increment: 1884014,
            creationTime: "2022-03-04T05:23:01Z",
          },
        },
        {
          nftTypeId: "0xd40c03b8680d4b6a4d78fc3c6f6a28c854e94a79",
          startTime: "2022-03-04T05:21:24Z",
          endTime: "2022-03-04T05:21:30Z",
          finishTime: "2022-03-04T05:22:01.401Z",
          enumKLine: 0,
          open: 20,
          close: 200,
          height: 300,
          low: 3140,
          avg: 370,
          volume: 24,
          totalPrice: 76680,
          id: "6221a1f9856e88c08f1cbf5b",
          objectId: {
            timestamp: 1646371321,
            machine: 8744584,
            pid: -16241,
            increment: 1883995,
            creationTime: "2022-03-04T05:22:01Z",
          },
        },
        {
          nftTypeId: "0xd40c03b8680d4b6a4d78fc3c6f6a28c854e94a79",
          startTime: "2022-03-04T05:20:21Z",
          endTime: "2022-03-04T05:20:21Z",
          finishTime: "2022-03-04T05:21:01.398Z",
          enumKLine: 0,
          open: 3199,
          close: 3300,
          height: 3300,
          low: 800,
          avg: 320,
          volume: 20,
          totalPrice: 660000,
          id: "6221a1bd856e88c08f1cbf4e",
          objectId: {
            timestamp: 1646371261,
            machine: 8744584,
            pid: -16241,
            increment: 1883982,
            creationTime: "2022-03-04T05:21:01Z",
          },
        },
        {
          nftTypeId: "0xd40c03b8680d4b6a4d78fc3c6f6a28c854e94a79",
          startTime: "2022-03-04T05:19:57Z",
          endTime: "2022-03-04T05:19:57Z",
          finishTime: "2022-03-04T05:20:02.057Z",
          enumKLine: 0,
          open: 98,
          close: 199,
          height: 5199,
          low: 699,
          avg: 99,
          volume: 3,
          totalPrice: 9597,
          id: "6221a182856e88c08f1cbf42",
          objectId: {
            timestamp: 1646371202,
            machine: 8744584,
            pid: -16241,
            increment: 1883970,
            creationTime: "2022-03-04T05:20:02Z",
          },
        },
      ],
    };
  },
  props: ["chartData"],
  mounted() {
    //获取div容器
    let chart1 = this.$refs.chart1;
    myChart5 = this.$echarts.init(chart1);
    //监听窗口的变化,不想屏幕自适应可以不写
    window.addEventListener("resize", function () {
      myChart5.resize();
    });

    this.drawLine();
  },
  methods: {
    drawLine() {
      var series = [];
      var finishTime = [];
      for (var i = 0, len = this.newList.length; i < len; i++) {
        //  for循环语法结构 注意这个带有,
        finishTime.push(this.newList[i].finishTime); //  这里是时间获取时间数据
        series.push({
          name: this.newList[i].volume,
          type: "line",
          smooth: true,
          data: [
            this.newList[i].open,
            this.newList[i].close,
            this.newList[i].height,
            this.newList[i].low,
            this.newList[i].avg,
          ],
        });
      }

      var option = {
        title: {
          text: "添加标题",
          subtext: "副标题",
          left: "left",
        },
        xAxis: {
          type: "category",
          // data: ["Mon", "Tue", "Wed", "Thu", "Fri", "Sat", "Sun"],
          data: finishTime,                        //  1.这里是赋值获取时间数据!!!!!!!!!
        },
        yAxis: {
          type: "value",
          axisLine: {
            show: true,
          },
        },
        legend: {
          //  这个必须要有,如果需要最上面'图例'的话就加,里面也要有data不需要就删掉
          // data: finishTime,  // series里面写name这里可以注释掉,写上会提示重复渲染打印台
        },
        // series: [    //  这是初始化样子
        //   {
        //     name: 'volume',
        //     type: "line",
        //     // stack: "Total",
        //     data: [120, 132, 101, 134, 90, 230, 210],
        //   },
        // ],
        series: series, //  2.这里是赋值给series数据!!!!!!!!!!!!!!!!!!!
      };
      // 使用刚指定的配置项和数据显示图表。
      //防止越界,重绘canvas
      window.onresize = myChart5.resize;
      myChart5.setOption(option);
    },
  },
};
</script>

<style scoped>
</style>
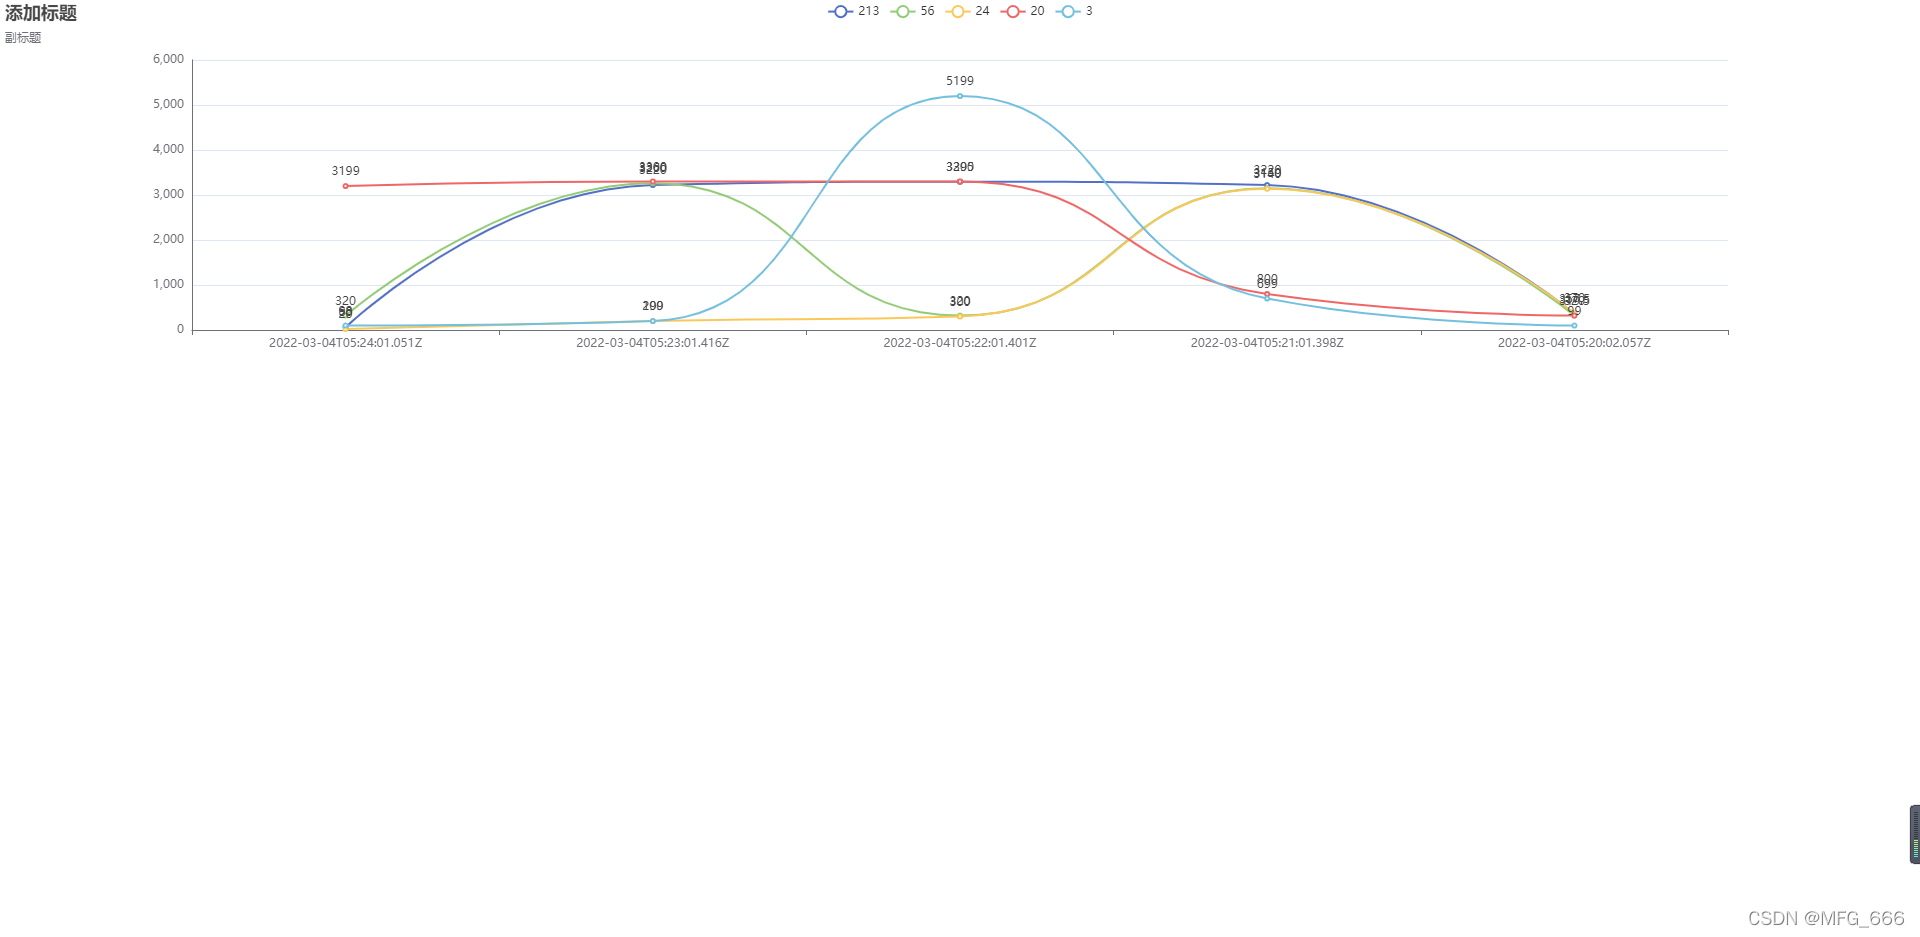
5.效果如下图
参考:https://www.cnblogs.com/chuanqi1995/p/11387423.html
感觉文章好的话记得点个心心和关注,有错的地方麻烦在评论区指正一下,多谢!!!


 1091
1091


 被折叠的 条评论
为什么被折叠?
被折叠的 条评论
为什么被折叠?
 到【灌水乐园】发言


