


使用 Python 监控系统资源
在开发分布式系统或性能敏感的应用时,实时监控系统资源(如 CPU、内存、磁盘、网络和 GPU 使用率)至关重要。本文介绍一个基于 Python 的 SystemMonitor 类,它以单例模式持续采集系统资源信息,存储数据供外部访问,并集成日志记录功能。以下是其核心功能和使用方法。
功能概述
SystemMonitor 是一个轻量级的系统资源监控工具,具有以下特点:
- 单例模式:全局只有一个实例,确保数据一致性。
- 持续运行:初始化后自动开始监控,持续更新数据。
- 数据存储:将最新资源信息存储在内存中,供外部通过方法访问。
- 全面监控:
- CPU:使用率(百分比)。
- 内存:总内存、已用内存和使用率(GB)。
- 磁盘:总空间、已用空间和使用率(GB)。
- 网络:上行和下行速率(MB/s)。
- GPU:使用率和显存使用率(仅限 NVIDIA GPU)。
依赖安装
需要安装以下 Python 库:
pip install psutil pynvml
psutil:用于获取 CPU、内存、磁盘和网络信息。pynvml:用于监控 NVIDIA GPU(可选,若无 GPU 自动跳过)。
核心代码
以下是 SystemMonitor 的代码。
import time
import psutil
import pynvml
import threading
from typing import Dict, Optional
from logger import LoggerManager

class SystemMonitor:
    _instance = None
    _lock = threading.Lock()

    def __new__(cls, *args, **kwargs):
        with cls._lock:
            if cls._instance is None:
                cls._instance = super(SystemMonitor, cls).__new__(cls)
            return cls._instance

    def __init__(self, interval: float = 1.0):
        """
        初始化系统监控器(单例模式),自动开始持续监控。

        参数:
            interval: 采集数据的间隔时间(秒)
        """
        if hasattr(self, '_initialized') and self._initialized:
            return
        self._initialized = True
        self.logger = LoggerManager().get_logger("SYSTEM-MONITOR")
        self.interval = interval
        self.last_net_io = psutil.net_io_counters()
        self._system_info = {}  # 存储最新系统资源信息
        self._info_lock = threading.Lock()  # 保护 _system_info 的读写
        self.logger.info("System monitor initialized")

        # 初始化 GPU 监控
        self.gpu_available = False
        try:
            pynvml.nvmlInit()
            self.gpu_count = pynvml.nvmlDeviceGetCount()
            self.gpu_available = self.gpu_count > 0
            self.logger.info(f"Found {self.gpu_count} NVIDIA GPU(s)")
        except pynvml.NVMLError:
            self.logger.warning("NVIDIA GPU not available or driver not installed")

        # 启动监控线程
        self.running = True
        self.monitor_thread = threading.Thread(target=self._monitor_loop, daemon=True)
        self.monitor_thread.start()
        self.logger.info("System monitor thread started")

    def get_cpu_usage(self) -> float:
        """获取 CPU 使用率(百分比)。"""
        return psutil.cpu_percent(interval=0.1)

    def get_memory_info(self) -> Dict[str, float]:
        """获取内存信息(总内存、已用内存、使用率)。"""
        mem = psutil.virtual_memory()
        return {
            "total_gb": mem.total / (1024 ** 3),  # 转换为 GB
            "used_gb": mem.used / (1024 ** 3),
            "percent": mem.percent
        }

    def get_disk_info(self) -> Dict[str, float]:
        """获取磁盘信息(总空间、已用空间、使用率)。"""
        disk = psutil.disk_usage('/')
        return {
            "total_gb": disk.total / (1024 ** 3),  # 转换为 GB
            "used_gb": disk.used / (1024 ** 3),
            "percent": disk.percent
        }

    def get_network_speed(self) -> Dict[str, float]:
        """获取网络上行和下行速率(MB/s)。"""
        net_io = psutil.net_io_counters()
        bytes_sent = net_io.bytes_sent - self.last_net_io.bytes_sent
        bytes_recv = net_io.bytes_recv - self.last_net_io.bytes_recv
        elapsed = self.interval
        self.last_net_io = net_io
        return {
            "upload_mbps": (bytes_sent / elapsed) / (1024 ** 2),  # 转换为 MB/s
            "download_mbps": (bytes_recv / elapsed) / (1024 ** 2)
        }

    def get_gpu_info(self) -> Optional[Dict[str, float]]:
        """获取 GPU 使用率和显存使用率(仅限 NVIDIA GPU)。"""
        if not self.gpu_available:
            return None

        gpu_info = []
        for i in range(self.gpu_count):
            handle = pynvml.nvmlDeviceGetHandleByIndex(i)
            util = pynvml.nvmlDeviceGetUtilizationRates(handle)
            mem = pynvml.nvmlDeviceGetMemoryInfo(handle)
            gpu_info.append({
                "gpu_id": i,
                "utilization_percent": util.gpu,
                "memory_total_mb": mem.total / (1024 ** 2),  # 转换为 MB
                "memory_used_mb": mem.used / (1024 ** 2),
                "memory_percent": (mem.used / mem.total) * 100
            })
        return gpu_info

    def collect_and_log(self):
        """采集所有系统资源信息,更新存储并记录日志。"""
        with self._info_lock:
            # CPU
            self._system_info["cpu_usage_percent"] = self.get_cpu_usage()

            # 内存
            self._system_info["memory"] = self.get_memory_info()

            # 磁盘
            self._system_info["disk"] = self.get_disk_info()

            # 网络
            self._system_info["network"] = self.get_network_speed()

            # GPU
            self._system_info["gpu"] = self.get_gpu_info()

        # 日志记录
        self.logger.info(f"CPU Usage: {self._system_info['cpu_usage_percent']:.1f}%")
        self.logger.info(
            f"Memory: {self._system_info['memory']['used_gb']:.2f}/"
            f"{self._system_info['memory']['total_gb']:.2f} GB "
            f"({self._system_info['memory']['percent']:.1f}%)"
        )
        self.logger.info(
            f"Disk: {self._system_info['disk']['used_gb']:.2f}/"
            f"{self._system_info['disk']['total_gb']:.2f} GB "
            f"({self._system_info['disk']['percent']:.1f}%)"
        )
        self.logger.info(
            f"Network: Upload {self._system_info['network']['upload_mbps']:.2f} MB/s, "
            f"Download {self._system_info['network']['download_mbps']:.2f} MB/s"
        )
        if self._system_info["gpu"]:
            for gpu in self._system_info["gpu"]:
                self.logger.info(
                    f"GPU {gpu['gpu_id']}: Utilization {gpu['utilization_percent']}%"
                    f", Memory {gpu['memory_used_mb']:.1f}/"
                    f"{gpu['memory_total_mb']:.1f} MB "
                    f"({gpu['memory_percent']:.1f}%)"
                )

    def _monitor_loop(self):
        """监控循环,持续采集和更新系统资源信息。"""
        while self.running:
            self.collect_and_log()
            time.sleep(self.interval)

    def get_system_info(self) -> Dict:
        """
        获取最新的系统资源信息。

        返回:
            包含 CPU、内存、磁盘、网络和 GPU 信息的字典
        """
        with self._info_lock:
            return self._system_info.copy()

    def __del__(self):
        """清理 GPU 资源。"""
        self.running = False
        if self.gpu_available:
            try:
                pynvml.nvmlShutdown()
                self.logger.info("NVIDIA GPU monitoring shutdown")
            except pynvml.NVMLError:
                self.logger.warning("Failed to shutdown NVIDIA GPU monitoring")
使用示例
以下是如何使用 SystemMonitor 监控系统资源并读取数据的示例:
from system_monitor import SystemMonitor
import time

# 初始化(自动开始监控)
monitor = SystemMonitor(interval=1.0)

# 读取数据
for _ in range(5):
    time.sleep(1.0)
    info = monitor.get_system_info()
    print(f"CPU: {info['cpu_usage_percent']:.1f}%")
    print(f"Network: Upload {info['network']['upload_mbps']:.2f} MB/s, "
          f"Download {info['network']['download_mbps']:.2f} MB/s")
输出示例:
CPU: 25.3%
Network: Upload 0.01 MB/s, Download 0.05 MB/s
...
界面显示
from PySide6.QtWidgets import QWidget, QVBoxLayout, QHBoxLayout, QLabel, QScrollArea, QApplication
from PySide6.QtCharts import QChart, QChartView, QLineSeries, QValueAxis
from PySide6.QtCore import QTimer, Qt
from PySide6.QtGui import QPainter
from system_monitor import SystemMonitor

class SystemMonitorWindow(QWidget):
    def __init__(self, parent=None):
        super().__init__(parent)
        self.setWindowTitle("System Monitor")
        self.setMinimumSize(1000, 600)
        self.monitor = SystemMonitor(interval=1.0)
        self.init_ui()
        self.start_timer()

    def init_ui(self):
        # 主布局
        main_layout = QVBoxLayout(self)

        # 滚动区域
        scroll_area = QScrollArea()
        scroll_area.setWidgetResizable(True)
        scroll_content = QWidget()
        content_layout = QVBoxLayout(scroll_content)

        # CPU 和 GPU 行
        cpu_gpu_layout = QHBoxLayout()
        self.cpu_label = QLabel("CPU Usage: N/A")
        self.cpu_label.setStyleSheet("color: #fff;")
        self.cpu_label.setAlignment(Qt.AlignCenter)
        self.gpu_label = QLabel("GPU: N/A")
        self.gpu_label.setStyleSheet("color: #fff;")
        self.gpu_label.setAlignment(Qt.AlignCenter)

        cpu_layout = QVBoxLayout()
        self.cpu_chart = self.create_chart("CPU Usage (%)", 0, 100)
        self.cpu_series = QLineSeries()
        self.cpu_chart.addSeries(self.cpu_series)
        self.cpu_chart.setAxisX(self.create_axis_x(), self.cpu_series)
        self.cpu_chart.setAxisY(self.create_axis_y("Usage (%)", 0, 100), self.cpu_series)
        cpu_chart_view = QChartView(self.cpu_chart)
        cpu_chart_view.setMinimumHeight(400)
        cpu_layout.addWidget(cpu_chart_view)
        cpu_layout.addWidget(self.cpu_label)

        gpu_layout = QVBoxLayout()
        self.gpu_chart = self.create_chart("GPU Usage (%)", 0, 100)
        self.gpu_series = QLineSeries()
        self.gpu_chart.addSeries(self.gpu_series)
        self.gpu_chart.setAxisX(self.create_axis_x(), self.gpu_series)
        self.gpu_chart.setAxisY(self.create_axis_y("Usage (%)", 0, 100), self.gpu_series)
        gpu_chart_view = QChartView(self.gpu_chart)
        gpu_chart_view.setMinimumHeight(400)
        gpu_layout.addWidget(gpu_chart_view)
        gpu_layout.addWidget(self.gpu_label)

        cpu_gpu_layout.addLayout(cpu_layout, 1)
        cpu_gpu_layout.addLayout(gpu_layout, 1)
        content_layout.addLayout(cpu_gpu_layout)

        # 内存和磁盘行
        memory_disk_layout = QHBoxLayout()
        self.memory_label = QLabel("Memory: N/A")
        self.memory_label.setStyleSheet("color: #fff;")
        self.memory_label.setAlignment(Qt.AlignCenter)
        self.disk_label = QLabel("Disk: N/A")
        self.disk_label.setStyleSheet("color: #fff;")
        self.disk_label.setAlignment(Qt.AlignCenter)

        memory_layout = QVBoxLayout()
        self.memory_chart = self.create_chart("Memory Usage (%)", 0, 100)
        self.memory_series = QLineSeries()
        self.memory_chart.addSeries(self.memory_series)
        self.memory_chart.setAxisX(self.create_axis_x(), self.memory_series)
        self.memory_chart.setAxisY(self.create_axis_y("Usage (%)", 0, 100), self.memory_series)
        memory_chart_view = QChartView(self.memory_chart)
        memory_chart_view.setMinimumHeight(400)
        memory_layout.addWidget(memory_chart_view)
        memory_layout.addWidget(self.memory_label)

        disk_layout = QVBoxLayout()
        self.disk_chart = self.create_chart("Disk Usage (%)", 0, 100)
        self.disk_series = QLineSeries()
        self.disk_chart.addSeries(self.disk_series)
        self.disk_chart.setAxisX(self.create_axis_x(), self.disk_series)
        self.disk_chart.setAxisY(self.create_axis_y("Usage (%)", 0, 100), self.disk_series)
        disk_chart_view = QChartView(self.disk_chart)
        disk_chart_view.setMinimumHeight(400)
        disk_layout.addWidget(disk_chart_view)
        disk_layout.addWidget(self.disk_label)

        memory_disk_layout.addLayout(memory_layout, 1)
        memory_disk_layout.addLayout(disk_layout, 1)
        content_layout.addLayout(memory_disk_layout)

        # 网络上行和下行行
        network_layout = QHBoxLayout()
        self.upload_label = QLabel("Upload: N/A")
        self.upload_label.setStyleSheet("color: #fff;")
        self.upload_label.setAlignment(Qt.AlignCenter)
        self.download_label = QLabel("Download: N/A")
        self.download_label.setStyleSheet("color: #fff;")
        self.download_label.setAlignment(Qt.AlignCenter)

        upload_layout = QVBoxLayout()
        self.upload_chart = self.create_chart("Network Upload (MB/s)", 0, 10)
        self.upload_series = QLineSeries()
        self.upload_chart.addSeries(self.upload_series)
        self.upload_chart.setAxisX(self.create_axis_x(), self.upload_series)
        self.upload_chart.setAxisY(self.create_axis_y("Speed (MB/s)", 0, 10), self.upload_series)
        upload_chart_view = QChartView(self.upload_chart)
        upload_chart_view.setMinimumHeight(400)
        upload_layout.addWidget(upload_chart_view)
        upload_layout.addWidget(self.upload_label)

        download_layout = QVBoxLayout()
        self.download_chart = self.create_chart("Network Download (MB/s)", 0, 10)
        self.download_series = QLineSeries()
        self.download_chart.addSeries(self.download_series)
        self.download_chart.setAxisX(self.create_axis_x(), self.download_series)
        self.download_chart.setAxisY(self.create_axis_y("Speed (MB/s)", 0, 10), self.download_series)
        download_chart_view = QChartView(self.download_chart)
        download_chart_view.setMinimumHeight(400)
        download_layout.addWidget(download_chart_view)
        download_layout.addWidget(self.download_label)

        network_layout.addLayout(upload_layout, 1)
        network_layout.addLayout(download_layout, 1)
        content_layout.addLayout(network_layout)

        content_layout.addStretch()
        scroll_area.setWidget(scroll_content)
        main_layout.addWidget(scroll_area)

    def create_chart(self, title: str, min_y: float, max_y: float) -> QChart:
        chart = QChart()
        chart.setTitle(title)
        chart.legend().setVisible(False)
        chart.setAnimationOptions(QChart.SeriesAnimations)
        return chart

    def create_axis_x(self) -> QValueAxis:
        axis = QValueAxis()
        axis.setTitleText("Time (s)")
        axis.setRange(0, 60)
        axis.setTickCount(7)
        axis.setLabelsVisible(False)  # 隐藏刻度值
        return axis

    def create_axis_y(self, title: str, min_y: float, max_y: float) -> QValueAxis:
        axis = QValueAxis()
        axis.setTitleText(title)
        axis.setRange(min_y, max_y)
        axis.setTickCount(11)
        # axis.setLabelsVisible(False)  # 隐藏刻度值
        return axis

    def start_timer(self):
        self.timer = QTimer()
        self.timer.timeout.connect(self.update_ui)
        self.timer.start(1000)
        self.time_elapsed = 0

    def update_ui(self):
        info = self.monitor.get_system_info()
        self.time_elapsed += 1

        # 更新文本标签
        self.cpu_label.setText(f"CPU Usage: {info.get('cpu_usage_percent', 0):.1f}%")
        self.memory_label.setText(
            f"Memory: {info.get('memory', {}).get('used_gb', 0):.2f}/"
            f"{info.get('memory', {}).get('total_gb', 0):.2f} GB "
            f"({info.get('memory', {}).get('percent', 0):.1f}%)"
        )
        self.disk_label.setText(
            f"Disk: {info.get('disk', {}).get('used_gb', 0):.2f}/"
            f"{info.get('disk', {}).get('total_gb', 0):.2f} GB "
            f"({info.get('disk', {}).get('percent', 0):.1f}%)"
        )
        self.upload_label.setText(f"Upload: {info.get('network', {}).get('upload_mbps', 0):.2f} MB/s")
        self.download_label.setText(f"Download: {info.get('network', {}).get('download_mbps', 0):.2f} MB/s")
        gpu_text = "GPU: N/A"
        if info.get("gpu"):
            gpu = info["gpu"][0]
            gpu_text = (
                f"GPU {gpu['gpu_id']}: Utilization {gpu['utilization_percent']}%"
                f", Memory {gpu['memory_used_mb']:.1f}/"
                f"{gpu['memory_total_mb']:.1f} MB "
                f"({gpu['memory_percent']:.1f}%)"
            )
        self.gpu_label.setText(gpu_text)

        # 更新曲线图,使用 time_elapsed % 60 保持 X 轴 0-60
        x_value = self.time_elapsed
        if self.time_elapsed == 61:
            self.time_elapsed = 60
        self.cpu_series.append(x_value, info.get('cpu_usage_percent', 0))
        self.memory_series.append(x_value, info.get('memory', {}).get('percent', 0))
        self.disk_series.append(x_value, info.get('disk', {}).get('percent', 0))
        self.upload_series.append(x_value, info.get('network', {}).get('upload_mbps', 0))
        self.download_series.append(x_value, info.get('network', {}).get('download_mbps', 0))
        gpu_percent = info.get('gpu', [{}])[0].get('utilization_percent', 0) if info.get('gpu') else 0
        self.gpu_series.append(x_value, gpu_percent)

        for series in [self.cpu_series, self.memory_series, self.disk_series,
                       self.upload_series, self.download_series, self.gpu_series]:
            points = series.points()
            if len(points) > 60:
                series.remove(0)
                # points所有x坐标减1
                for point in points:
                    point.setX(point.x() - 1)
                series.replace(points)

if __name__ == "__main__":
    import sys
    app = QApplication(sys.argv)
    window = SystemMonitorWindow()
    window.show()
    app.exec()
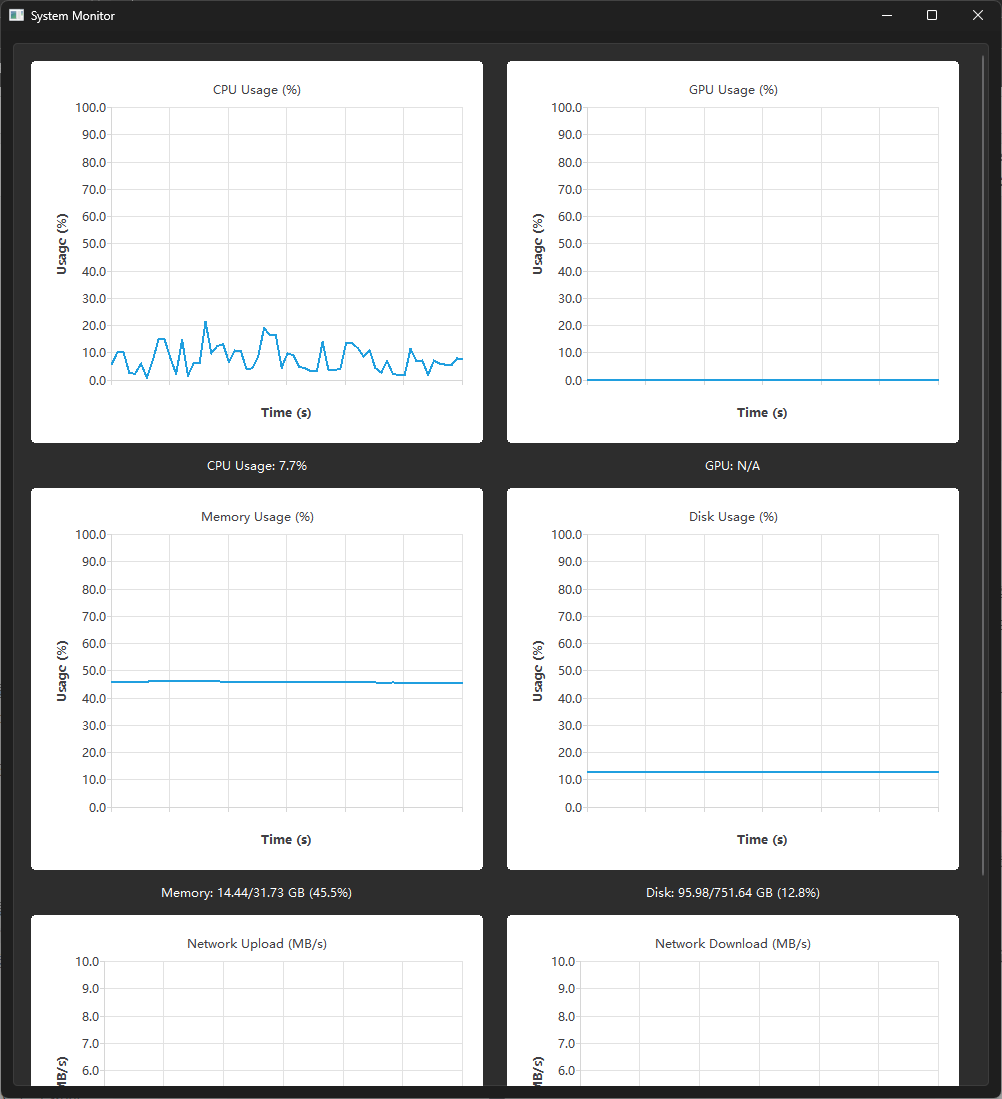
效果:
设计亮点
- 单例模式:通过
__new__和线程锁确保全局唯一实例,适合多线程环境。 - 自动监控:初始化后立即启动后台线程,持续更新数据,无需手动控制。
- 线程安全:使用锁保护共享数据,外部读取安全。
- 灵活扩展:可轻松添加新监控指标或集成远程数据传输(如 ZeroMQ)。
注意事项
- GPU 监控:需要 NVIDIA 显卡和驱动,否则跳过 GPU 数据。
- 磁盘路径:默认监控根分区(
/),Windows 用户可改为C:\\。 - 性能:采集间隔(默认 1 秒)可根据需求调整,避免过高频率影响性能。
扩展方向
- 远程监控:通过 API(如 Flask)或消息队列(如 ZeroMQ)发送数据。
- 告警系统:当资源超阈值时触发通知。
- 可视化:使用 Matplotlib 或 Grafana 展示实时图表。
总结
SystemMonitor 提供了一个简单而强大的解决方案,用于监控系统资源。它结合单例模式、持续运行和线程安全的数据存储,适合从简单脚本到复杂分布式系统的各种场景。欢迎尝试并根据需求扩展!


 1470
1470

 被折叠的 条评论
为什么被折叠?
被折叠的 条评论
为什么被折叠?
 到【灌水乐园】发言


