


之前对vue的使用版本都是vue2以及js,现在用vue3和typescript练练手,记录一下如何在vue3中以按需引入的方式引入echarts。
(1)安装echarts
npm install echarts --save
(2)在项目中新成立一个charts.ts文件,将所需要引用的组件暴露出来,在main.ts中引入,然后以provide(inject)的方式将echarts提供给组件
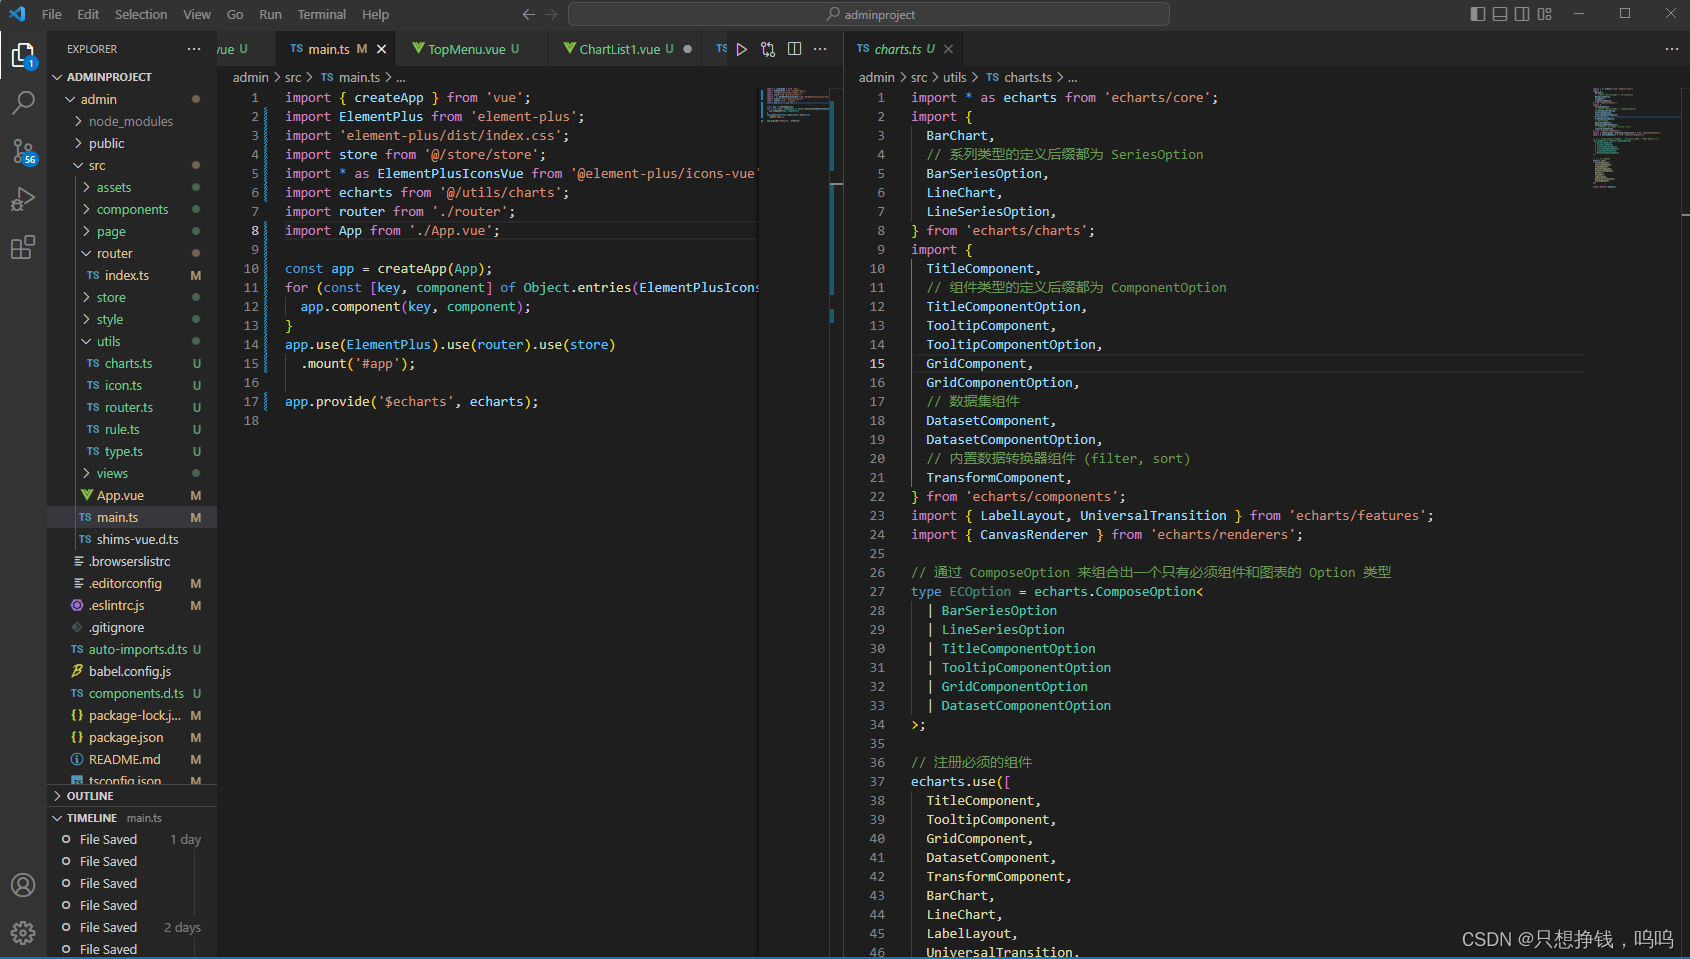
main.ts
import { createApp } from 'vue';
import ElementPlus from 'element-plus';
import 'element-plus/dist/index.css';
import store from '@/store/store';
import * as ElementPlusIconsVue from '@element-plus/icons-vue';
import echarts from '@/utils/charts';
import router from './router';
import App from './App.vue';

const app = createApp(App);
for (const [key, component] of Object.entries(ElementPlusIconsVue)) {
  app.component(key, component);
}
app.use(ElementPlus).use(router).use(store)
  .mount('#app');

app.provide('$echarts', echarts);
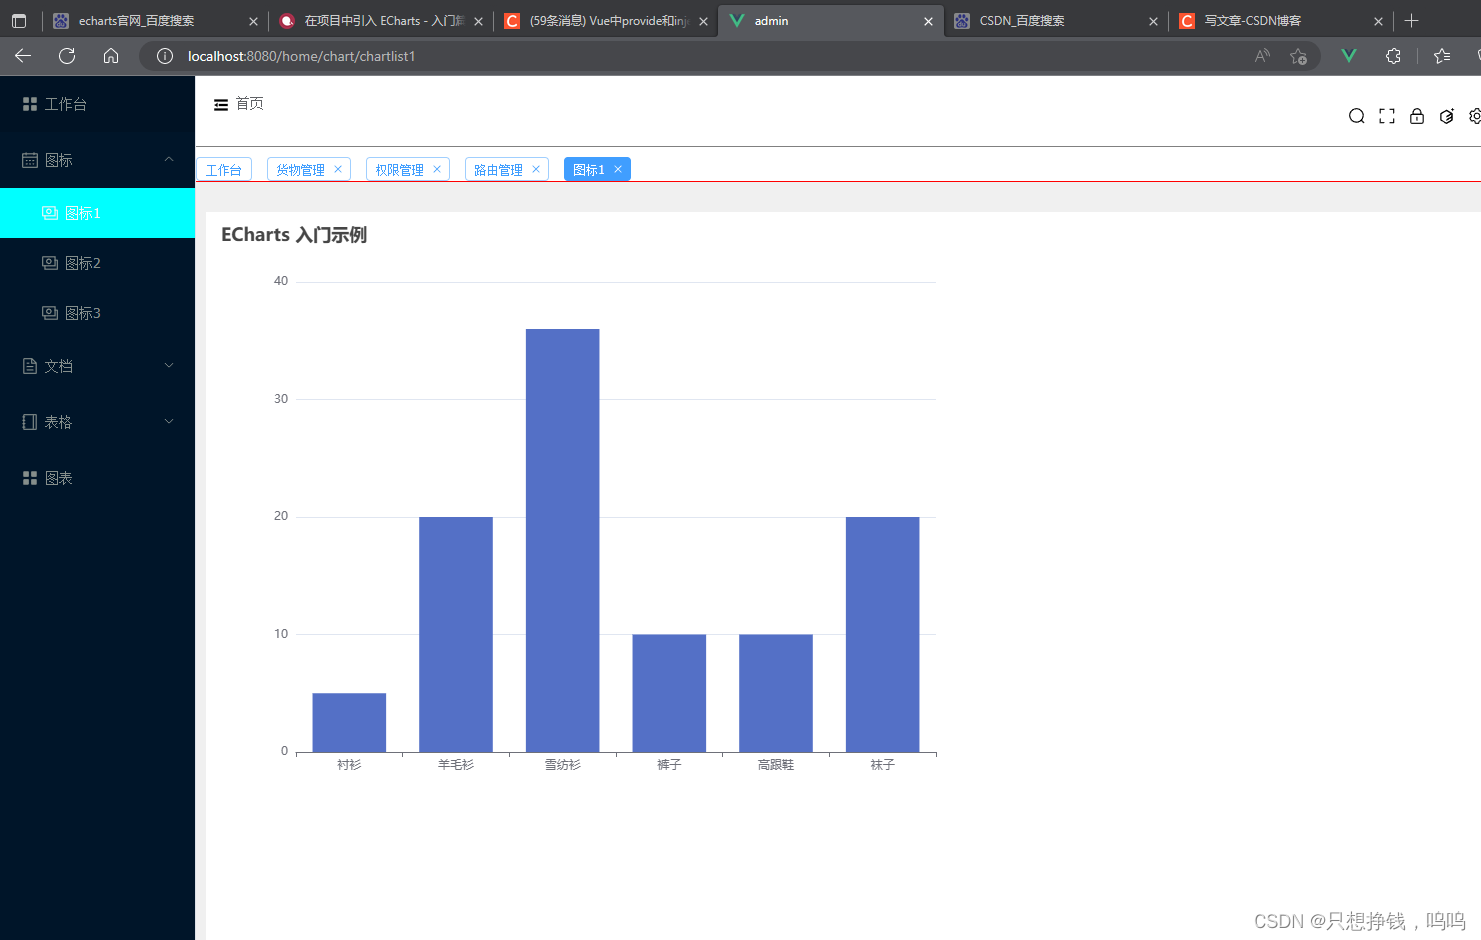
(3)在组件中使用
<template>
  <div id="chartcontainer">这是图标集合页面</div>
</template>

<script lang="ts" setup>
import {
  reactive, ref, defineComponent, inject, onMounted,
} from 'vue';

const echarts = inject('$echarts');=
onMounted(() => {
  const myChart = (echarts as any).init(document.getElementById('chartcontainer'));
  myChart.setOption({
    title: {
      text: 'ECharts 入门示例',
    },
    tooltip: {},
    xAxis: {
      data: ['衬衫', '羊毛衫', '雪纺衫', '裤子', '高跟鞋', '袜子'],
    },
    yAxis: {},
    series: [
      {
        name: '销量',
        type: 'bar',
        data: [5, 20, 36, 10, 10, 20],
      },
    ],
  });
});

</script>

<style lang="scss" scoped>
#chartcontainer {
  width:800px;
  height: 600px;
}
</style>
如下图所示:


 4780
4780


 被折叠的 条评论
为什么被折叠?
被折叠的 条评论
为什么被折叠?
 到【灌水乐园】发言


