


<template>
<div
class="echart"
ref="mychart1"
style="height:400px"
></div>
</template>
<script>
import * as echarts from "echarts";
export default {
name: 'EchartsBar1',
data () {
return {}
},
mounted () {
this.initBar()
},
methods: {
initBar () {
const option = {
title: { // 标题组件
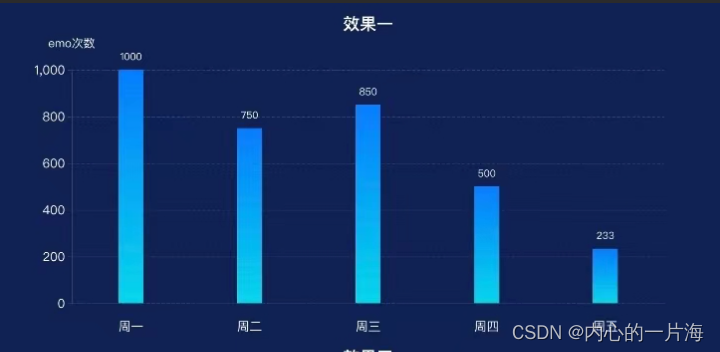
text: '效果一',
top: 10,
// 距离容器左侧的距离。可选left,right等
left: 'center',
textStyle: {
color: '#fff',
fontSize: 20
}
},
grid: { // 直角坐标系内绘图网格
// grid区域是否包含坐标轴的刻度标签。
// false可使多个grid区域坐标轴对齐
containLabel: false,
bottom: '10%',// grid 组件离容器下侧的距离。默认60px
top: '20%' // grid 组件离容器上侧的距离。默认60px
},
xAxis: { // X轴-相关设置
axisLabel: { // X轴-坐标轴刻度标签的相关设置。
show: true, // 是否显示刻度标签。默认为true
color: '#fff',
rotate: 0,// 刻度标签旋转的角度。默认为0
margin: 20, // 刻度标签与轴线之间的距离。 默认8px
fontSize: 15,
// 坐标轴刻度标签的显示间隔。
// 0表示显示所有标签,1表示间隔一个显示标签
interval: 0
},
axisTick: { // X轴-坐标轴刻度相关设置
show: false
},
splitLine: { // X轴-分隔线
show: false
},
axisLine: { // X轴-坐标轴轴线相关设置
show: true,
lineStyle: {
color: '#384267',
type: 'dashed' // 线的类型。可选'solid'等
}
},
data: ['周一', '周二', '周三', '周四', '周五'],
},
yAxis: { // Y轴-相关设置
name: 'emo次数', // Y轴-坐标轴名称
nameTextStyle: { // Y轴-坐标轴名称的文字样式
color: '#fff',
padding: [0, 0, 10, 0],
fontSize: 14
},
axisLabel: { // Y轴-坐标轴刻度标签的相关设置
color: '#fff',
fontSize: 15
},
axisTick: { // Y轴-坐标轴刻度相关设置。
show: true,
lineStyle: {
color: '#384267'
}
},
splitLine: { // Y轴-分隔线
show: true,
lineStyle: {
color: '#384267',
type: 'dashed'
}
},
axisLine: { // Y轴-坐标轴轴线相关设置。
show: true,
lineStyle: {
color: '#384267',
type: 'solid'
}
}
},
series: [// 柱体系列数据
{
name: 'emo次数',
data: [1000, 750, 850, 500, 233],
type: 'bar',
barWidth: 30, // 柱条的宽度
itemStyle: { // 柱条图形样式
color: {
type: 'linear',
x: 0,
y: 0,
x2: 0,
y2: 1,
global: false,
colorStops: [
{ offset: 0, color: '#057DFE' },// 0% 处的颜色
{ offset: 1, color: '#02D7EA' }// 100% 处的颜色
]
}
},
label: { // 图形上的文本标签
show: true,
position: 'top',// 标签的位置。可选top,left等
distance: 10, // 距离图形元素的距离。默认值5
color: '#fff'
}
}
],
tooltip: { // 提示框组件
trigger: 'axis',// 触发类型。坐标轴触发
backgroundColor: 'rgba(17,95,182,0.5)',
textStyle: {
color: "#fff"
},
axisPointer: { // 坐标轴指示器配置项
type: 'shadow' // 可选line,shadow,none,cross
},
formatter: (params) => {
return (
`${params[0].name}<br />
${params[0].seriesName}:${params[0].value}`
)
}
}
}
const myChart = echarts.init(this.$refs['mychart1'])
myChart.setOption(option)
}
}
}
</script>
<style scoped>
</style>
<template>
<div
class="echart"
ref="mychart2"
style="height:400px"
></div>
</template>
<script>
import * as echarts from "echarts";
export default {
name: 'EchartsBar2',
data () {
return {}
},
mounted () {
this.initBar()
},
methods: {
initBar () {
const option = {
title: { // 标题组件
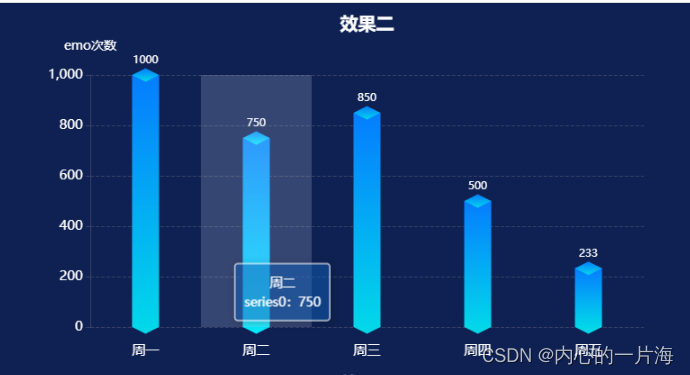
text: '效果二',
top: 10,
left: 'center', // 距离容器左侧的距离。可选left,right等
textStyle: {
color: '#fff',
fontSize: 20
}
},
grid: { // 直角坐标系内绘图网格
containLabel: false,
bottom: '10%',// grid 组件离容器下侧的距离。默认60px
top: '20%' // grid 组件离容器上侧的距离。默认60px
},
xAxis: { // X轴-相关设置
axisLabel: { // X轴-坐标轴刻度标签的相关设置。
show: true, // 是否显示刻度标签。默认为true
color: '#fff',
rotate: 0,// 刻度标签旋转的角度。默认为0
margin: 20, // 刻度标签与轴线之间的距离。 默认8px
fontSize: 15,
// 坐标轴刻度标签的显示间隔。0表示显示所有标签,1表示隔一个标签显示一个标签
interval: 0
},
axisTick: { // X轴-坐标轴刻度相关设置
show: false
},
splitLine: { // X轴-分隔线
show: false
},
axisLine: { // X轴-坐标轴轴线相关设置
show: true,
lineStyle: {
color: '#384267',
type: 'dashed' // 线的类型。可选'solid'等
}
},
data: ['周一', '周二', '周三', '周四', '周五'],
},
yAxis: { // Y轴-相关设置
name: 'emo次数', // Y轴-坐标轴名称
nameTextStyle: { // Y轴-坐标轴名称的文字样式
color: '#fff',
padding: [0, 0, 10, 0],
fontSize: 14
},
axisLabel: { // Y轴-坐标轴刻度标签的相关设置
color: '#fff',
fontSize: 15,
},
axisTick: { // Y轴-坐标轴刻度相关设置。
show: true,
lineStyle: {
color: '#384267'
}
},
splitLine: { // Y轴-分隔线
show: true,
lineStyle: {
color: '#384267',
type: 'dashed'
}
},
axisLine: { // Y轴-坐标轴轴线相关设置。
show: true,
lineStyle: {
color: '#384267',
type: 'solid'
}
}
},
series: [
{ // 柱底
data: [1000, 750, 850, 500, 233],
type: 'pictorialBar', // 象形柱图
//图形的定位位置。柱子开始的地方。可选start,end,center
symbolPosition: 'start',
symbol: 'diamond', //图形类型。可选'circle','rect'等
// 把图形向下移动了自身尺寸的一半的位置
symbolOffset: [0, '50%'],
symbolSize: [30, 15], // 图形的大小
itemStyle: {
color: '#02D7EA'
}
},
{ // 柱体系列数据
name: 'emo次数',
data: [1000, 750, 850, 500, 233],
type: 'bar',
barWidth: 30,
itemStyle: {
color: {
type: 'linear',
x: 0,
y: 0,
x2: 0,
y2: 1,
global: false,
colorStops: [
{ offset: 0, color: '#057DFE' },// 0% 处的颜色
{ offset: 1, color: '#02D7EA' }// 100% 处的颜色
]
}
},
label: { // 图形上的文本标签
show: true,
position: 'top', // 标签的位置。可选top,left等
distance: 10, // 距离图形元素的距离。默认值5
color: '#fff'
}
},
{ // 柱顶
data: [1000, 750, 850, 500, 233],
type: 'pictorialBar', // 象形柱图
//图形的定位位置。柱子结束的地方。可选start,end,center
symbolPosition: 'end',
symbol: 'diamond', //图形类型。可选'circle','rect'等
// 把图形向上移动了自身尺寸的一半的位置。
symbolOffset: [0, '-50%'],
symbolSize: [30, 15], // 图形的大小
itemStyle: {
color: {
type: 'linear',
x: 0,
y: 0,
x2: 0,
y2: 1,
global: false,
colorStops: [
{ offset: 0, color: '#057DFE' },// 0% 处的颜色
{ offset: 1, color: '#02D7EA' }// 100% 处的颜色
]
}
},
z: 3
}
],
tooltip: {
trigger: 'axis',
backgroundColor: 'rgba(17,95,182,0.5)',
textStyle: {
color: '#fff'
},
axisPointer: {
type: 'shadow'
},
formatter: (params) => {
return (
`${params[0].name}<br />
${params[0].seriesName}:${params[0].value}`
)
}
},
}
const myChart = echarts.init(this.$refs['mychart2'])
myChart.setOption(option)
}
}
}
</script>
<style scoped>
</style>
<template>
<div
class="echart"
ref="mychart3"
style="height:400px"
></div>
</template>
<script>
import * as echarts from "echarts";
export default {
name: 'EchartsBar3',
data () {
return {}
},
mounted () {
this.initBar()
},
methods: {
initBar () {
const option = {
title: { // 标题组件
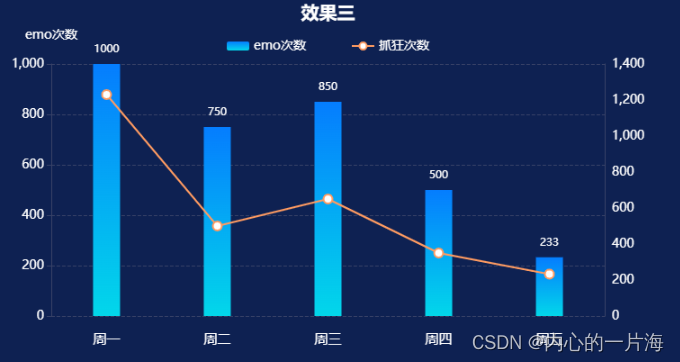
text: '效果三',
top: 10,
left: 'center', // 距离容器左侧的距离。可选left,right等
textStyle: {
color: '#fff',
fontSize: 20
},
},
grid: { // 直角坐标系内绘图网格
containLabel: false,
bottom: '10%',// grid 组件离容器下侧的距离。默认60px
top: '20%' // grid 组件离容器上侧的距离。默认60px
},
legend: { // 图例组件
top: '12%', // 图例组件离容器上侧的距离
left: 'center',// 图例组件离容器左侧的距离
textStyle: {
color: "#fff",
fontSize: 14
},
itemGap: 50, // 图例每项之间的间隔。默认10
itemHeight: 10, // 图例标记的图形高度。默认14
data: ['emo次数', '抓狂次数']
},
xAxis: { // X轴-相关设置
axisLabel: { // X轴-坐标轴刻度标签的相关设置。
show: true,
color: '#fff',
margin: 20, // 刻度标签与轴线之间的距离。 默认8px
fontSize: 15,
interval: 0
},
axisTick: { // X轴-坐标轴刻度相关设置
show: false
},
splitLine: { // X轴-分隔线
show: false
},
axisLine: { // X轴-坐标轴轴线相关设置
show: true,
lineStyle: {
color: '#384267',
type: 'dashed' // 线的类型。可选'solid'等
}
},
data: ['周一', '周二', '周三', '周四', '周五']
},
yAxis: [ // Y轴-相关设置
{ // 左侧y轴
name: 'emo次数',
nameTextStyle: { // 坐标轴名称的文字样式
color: '#fff',
padding: [0, 0, 10, 0],
fontSize: 14
},
axisLabel: { // Y轴-坐标轴刻度标签的相关设置
fontSize: 14,
color: '#fff'
},
axisTick: { // Y轴-坐标轴刻度相关设置。
show: true,
lineStyle: {
color: '#384267'
}
},
splitLine: { // Y轴-分隔线
show: true,
lineStyle: {
color: '#384267',
type: 'dashed'
}
},
axisLine: { // Y轴-坐标轴轴线相关设置。
show: true,
lineStyle: {
color: '#384267',
type: 'solid'
}
}
},
{ // 右侧y轴
position: 'right', // y 轴的位置。可选left,right。默认 第一个 y 轴在左侧('left'),第二个 y 轴在另一侧。
axisLabel: { // Y轴-坐标轴刻度标签的相关设置
show: true,
textStyle: {
fontSize: 14,
color: '#fff'
}
},
axisTick: { // Y轴-坐标轴刻度相关设置。
show: false
},
splitLine: { // Y轴-分隔线
show: false
},
axisLine: { // Y轴-坐标轴轴线相关设置。
show: true,
lineStyle: {
color: '#384267',
type: 'solid'
}
}
}
],
series: [
{ // 柱状系列数据
name: 'emo次数',
type: 'bar',
yAxisIndex: 0, //使用的 y 轴的 index,在单个图表实例中存在多个 y轴的时候有用
data: [1000, 750, 850, 500, 233],
barWidth: 30,
itemStyle: {
color: {
type: 'linear',
x: 0,
y: 0,
x2: 0,
y2: 1,
global: false,
colorStops: [
{ offset: 0, color: '#057DFE' },// 0% 处的颜色
{ offset: 1, color: '#02D7EA' }// 100% 处的颜色
]
}
},
label: { // 图形上的文本标签
show: true,
position: 'top', // 标签的位置。可选top,left等
distance: 10, // 距离图形元素的距离。默认值5
color: '#fff'
}
},
{ // 折线系列数据
name: '抓狂次数',
type: 'line',
data: [1230, 500, 650, 350, 233],
//使用的 y 轴的 index
// 在单个图表实例中存在多个 y轴的时候有用
yAxisIndex: 1,
smooth: false, // 是否平滑曲线显示
//标记的图形为实心圆。可选 'circle','rect'等
symbol: 'emptyCircle',
symbolSize: 10, //标记的大小
itemStyle: {
//折线拐点标志的样式
color: '#FF9B61'
},
lineStyle: {
color: '#FF9B61'
}
}
],
tooltip: {
trigger: 'axis',
backgroundColor: 'rgba(17,95,182,0.5)',
textStyle: {
color: '#fff'
},
formatter: (params) => {
let oneDotHtml = '<span style="display:inline-block;margin-right:5px;width:10px;height:10px;background-color:#057DFE"></span>'
let twoDotHtml = '<span style="display:inline-block;margin-right:5px;width:10px;height:10px;background-color:#FF9B61"></span>'
return (
`${params[0].name}<br />
${oneDotHtml}${params[0].seriesName}:${params[0].value}<br />
${twoDotHtml}${params[1].seriesName}:${params[1].value}
`
)
}
}
}
const myChart = echarts.init(this.$refs['mychart3'])
myChart.setOption(option)
}
}
}
</script>
<style scoped>
</style>
<template>
<div
class="echart"
ref="mychart4"
style="height:400px"
></div>
</template>
<script>
import * as echarts from "echarts";
export default {
name: 'EchartsBar4',
data () {
return {}
},
mounted () {
this.initBar()
},
methods: {
initBar () {
const option = {
title: { // 标题组件
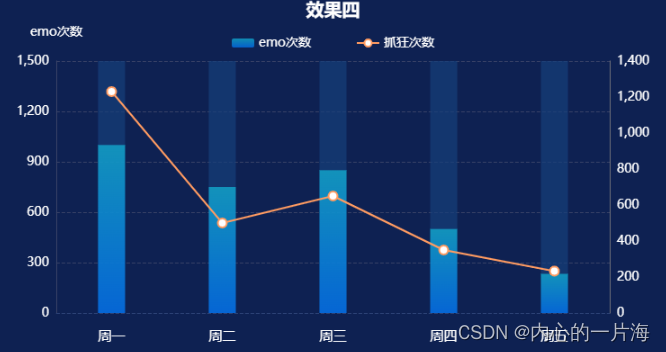
text: '效果四',
top: 10,
left: 'center',// 距离容器左侧的距离。可选left,right等
textStyle: {
color: '#fff',
fontSize: 20
}
},
grid: { // 直角坐标系内绘图网格
containLabel: false,// 坐标轴对齐?
bottom: '10%',// grid 组件离容器下侧的距离。默认60px
top: '20%' // grid 组件离容器上侧的距离。默认60px
},
legend: { // 图例组件
top: '12%',// 图例组件离容器上侧的距离
left: 'center',// 图例组件离容器左侧的距离
textStyle: {
color: '#fff',
fontSize: 14
},
itemGap: 50, // 图例每项之间的间隔。默认10
itemHeight: 10,// 图例标记的图形高度。默认14
data: ['emo次数', '抓狂次数']
},
xAxis: { // X轴-相关设置
data: ['周一', '周二', '周三', '周四', '周五'],
axisLabel: { // X轴-坐标轴刻度标签的相关设置。
show: true,
color: '#fff',
margin: 20, // 刻度标签与轴线之间的距离。 默认8px
fontSize: 15,
interval: 0
},
axisTick: { // X轴-坐标轴刻度相关设置
show: false
},
splitLine: { // X轴-分隔线
show: false
},
axisLine: { // X轴-坐标轴轴线相关设置
show: true,
lineStyle: {
color: '#2D4377',
type: 'dashed'// 线的类型。可选'solid'等
}
},
},
yAxis: [ // Y轴-相关设置
{ // 左侧y轴
min: 0,
max: 1500,
name: 'emo次数',
nameTextStyle: { // 坐标轴名称的文字样式
color: '#fff',
padding: [0, 0, 10, 0],
fontSize: 14
},
axisLabel: { // Y轴-坐标轴刻度标签的相关设置
fontSize: 14,
color: "#fff"
},
axisTick: { // Y轴-坐标轴刻度相关设置。
show: false
},
splitLine: { // Y轴-分隔线
show: true,
lineStyle: {
color: '#384267',
type: 'dashed'
}
},
axisLine: { // Y轴-坐标轴轴线相关设置。
show: true,
lineStyle: {
color: '#384267',
type: 'solid'
}
}
},
{ // 右侧y轴
position: 'right', // y 轴的位置。可选left,right。默认 第一个 y 轴在左侧('left'),第二个 y 轴在另一侧。
axisLabel: { // Y轴-坐标轴刻度标签的相关设置
fontSize: 14,
color: '#fff'
},
axisTick: { // Y轴-坐标轴刻度相关设置。
show: false
},
splitLine: { // Y轴-分隔线
show: false
},
axisLine: { // Y轴-坐标轴轴线相关设置。
show: true
}
}],
series: [
{ // 柱状系列数据
name: 'emo次数',
type: 'bar',
data: [1000, 750, 850, 500, 233],
barWidth: 30,
yAxisIndex: 0, //使用的 y 轴的 index,在单个图表实例中存在多个 y轴的时候有用
itemStyle: { // lenged文本
opacity: 0.7,
color: {
type: 'linear',
x: 0,
y: 0,
x2: 0,
y2: 1,
global: false,
colorStops: [
{ offset: 0, color: '#12B9DB' },// 0% 处的颜色
{ offset: 1, color: '#007AFF' }// 100% 处的颜色
]
}
}
},
{ // 折线系列数据
name: '抓狂次数',
type: 'line',
data: [1230, 500, 650, 350, 233],
yAxisIndex: 1, //使用的 y 轴的 index,在单个图表实例中存在多个 y轴的时候有用
smooth: false, // 是否平滑曲线显示
symbol: 'emptyCircle', //标记的图形为实心圆。可选 circle,rect等
symbolSize: 10,
itemStyle: {
//折线拐点标志的样式
color: '#FF9B61'
},
lineStyle: {
color: '#FF9B61'
}
},
{ // 柱体背景
name: '背景',
type: 'bar',
data: [1500, 1500, 1500, 1500, 1500],
barWidth: 30,
// 不同系列的柱间距离。-100%表示两个系列的柱子重叠
barGap: '-100%',
z: 0,
itemStyle: {
color: '#163F7A',
opacity: 0.7
}
}
],
tooltip: {
trigger: 'axis',
backgroundColor: 'rgba(17,95,182,0.5)',
textStyle: {
color: '#fff'
},
formatter: (params) => {
let oneDotHtml = '<span style="display:inline-block;margin-right:5px;width:10px;height:10px;background-color:#057DFE"></span>'
let twoDotHtml = '<span style="display:inline-block;margin-right:5px;width:10px;height:10px;background-color:#FF9B61"></span>'
return (
`${params[0].name}<br />
${oneDotHtml}${params[0].seriesName}:${params[0].value}<br />
${twoDotHtml}${params[1].seriesName}:${params[1].value}
`
)
}
}
}
const myChart = echarts.init(this.$refs['mychart4'])
myChart.setOption(option)
}
}
}
</script>
<style scoped>
</style>
<template>
<div
class="echart"
ref="mychart5"
style="height:400px"
></div>
</template>
<script>
import * as echarts from "echarts"
export default {
name: 'EchartsBar5',
data () {
return {
color: ['#275DFE', '#2773FE', '#019BFF', '#17A7F4', '#7DEBFF']
}
},
mounted () {
this.initBar()
},
methods: {
initBar () {
const that = this
let option = {
title: { // 标题组件
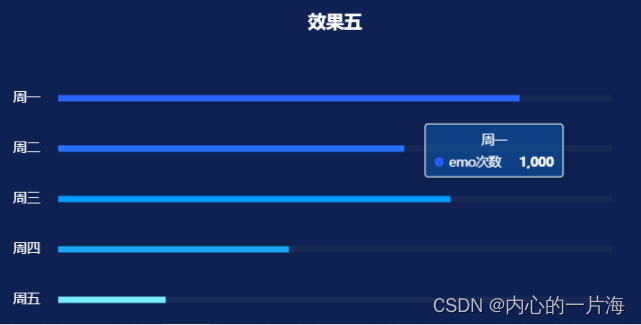
text: '效果五',
top: 10,
left: 'center',
textStyle: {
color: '#fff',
fontSize: 20
}
},
grid: { // 直角坐标系内绘图网格
containLabel: false,
bottom: '10%',// grid 组件离容器下侧的距离。默认60px
top: '20%' // grid 组件离容器上侧的距离。默认60px
},
xAxis: { // X轴-相关设置
show: false
},
yAxis: { // Y轴-相关设置
type: 'category',
data: ['周一', '周二', '周三', '周四', '周五'],
inverse: true, // 是否是反向坐标轴
axisLabel: { // Y轴-坐标轴刻度标签的相关设置。
margin: 20,
fontSize: 15,
color: '#fff'
},
axisTick: { // Y轴-坐标轴刻度相关设置
show: false
},
splitLine: { // Y轴-分隔线
show: false
},
axisLine: { // Y轴-坐标轴轴线相关设置
show: false
}
},
series: [
{ // 柱条数据
name: 'emo次数',
type: 'bar',
barWidth: 7,
data: [1000, 750, 850, 500, 233],
itemStyle: {
color: function (param) {
return that.color[param.dataIndex]
}
}
},
{ // 柱条背景
name: '背景',
type: 'bar',
barWidth: 7,
data: [1200, 1200, 1200, 1200, 1200],
// 不同系列的柱间距离。-100%表示两个系列的柱子重叠
barGap: '-100%',
itemStyle: {
color: 'rgba(118, 111, 111, 0.1)'
},
z: 0,
tooltip: {
show: false
}
}
],
tooltip: {
trigger: 'axis',
axisPointer: {
type: 'none'
},
backgroundColor: 'rgba(17,95,182,0.5)',
textStyle: {
color: "#fff"
}
}
}
const myChart = echarts.init(this.$refs['mychart5'])
myChart.setOption(option)
}
}
}
</script>
<style scoped>
</style>
<template>
<div
class="echart"
ref="mychart6"
style="height:400px"
></div>
</template>
<script>
import * as echarts from "echarts";
export default {
name: 'EchartsBar6',
data () {
return {}
},
mounted () {
this.initBar()
},
methods: {
initBar () {
const option = {
title: { // 标题组件
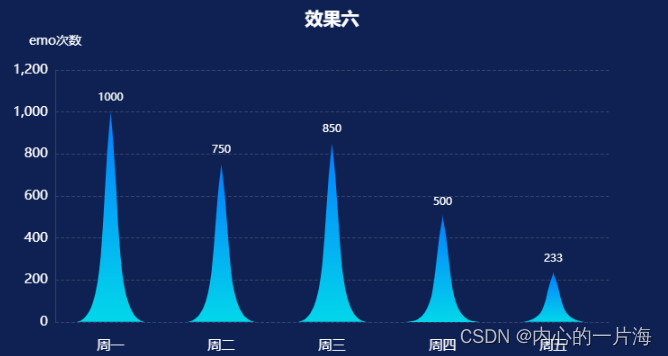
text: '效果六',
top: 10,
left: 'center',// 距离容器左侧的距离。可选left,right等
textStyle: {
color: '#fff',
fontSize: 20
}
},
grid: { // 直角坐标系内绘图网格
// grid区域是否包含坐标轴的刻度标签。
// false可使多个grid区域坐标轴对齐
containLabel: false,
bottom: '10%',// grid 组件离容器下侧的距离。默认60px
top: '20%' // grid 组件离容器上侧的距离。默认60px
},
xAxis: { // X轴-相关设置
axisLabel: { // X轴-坐标轴刻度标签的相关设置。
show: true,
color: '#fff',
margin: 20, // 刻度标签与轴线之间的距离。 默认8px
fontSize: 15,
interval: 0
},
axisTick: { // X轴-坐标轴刻度相关设置
show: false
},
splitLine: { // X轴-分隔线
show: false
},
axisLine: { // X轴-坐标轴轴线相关设置
show: true,
lineStyle: {
color: '#2D4377',
type: 'dashed'
}
},
data: ['周一', '周二', '周三', '周四', '周五'],
},
yAxis: { // Y轴-相关设置
max: 1200,
name: 'emo次数',
nameTextStyle: { // Y轴-坐标轴名称的文字样式
color: '#fff',
padding: [0, 0, 10, 0],
fontSize: 14
},
axisLabel: { // Y轴-坐标轴刻度标签的相关设置
fontSize: 15,
color: "#fff"
},
axisTick: { // Y轴-坐标轴刻度相关设置。
show: false
},
splitLine: { // Y轴-分隔线
show: true,
lineStyle: {
color: '#384267',
type: 'dashed'
}
},
axisLine: { // Y轴-坐标轴轴线相关设置。
show: true,
lineStyle: {
color: '#384267',
type: 'solid'
}
}
},
series: [ // 锥形系列数据
{
name: 'emo次数',
data: [1000, 750, 850, 500, 233],
type: 'pictorialBar', // 象形柱图
barWidth: 80, // 柱条的宽度
symbol: `path://M0,10 L10,10 C5.5,
10 6.5,5 5,0 C3.5,5 4.5,10 0,10 z`,
itemStyle: { // 柱条图形样式
color: {
type: 'linear',
x: 0,
y: 0,
x2: 0,
y2: 1,
global: false,
colorStops: [
{ offset: 0, color: '#057DFE' },// 0% 处的颜色
{ offset: 1, color: '#02D7EA' }// 100% 处的颜色
]
}
},
label: { // 图形上的文本标签
show: true,
position: 'top',// 标签的位置。可选top,left等
distance: 10,// 距离图形元素的距离。默认值5
color: '#fff'
}
}
],
tooltip: { // 提示框组件
trigger: 'axis',// 触发类型。坐标轴触发,主要在柱状图等使用类目轴的图表中使用
backgroundColor: 'rgba(17,95,182,0.5)',
textStyle: {
color: '#fff'
},
axisPointer: { // 坐标轴指示器配置项
type: 'shadow' // 可选line,shadow,none,cross
},
formatter: (params) => {
return (
`${params[0].name}<br />
${params[0].seriesName}:${params[0].value}`
)
}
}
}
const myChart = echarts.init(this.$refs['mychart6'])
myChart.setOption(option)
}
}
}
</script>
<style scoped>
</style>


 648
648


 被折叠的 条评论
为什么被折叠?
被折叠的 条评论
为什么被折叠?
 到【灌水乐园】发言


