


Python+禅道bug.CSV画出趋势图
前置条件
- csv中包含bugID
- CSV中包含“创建时间”
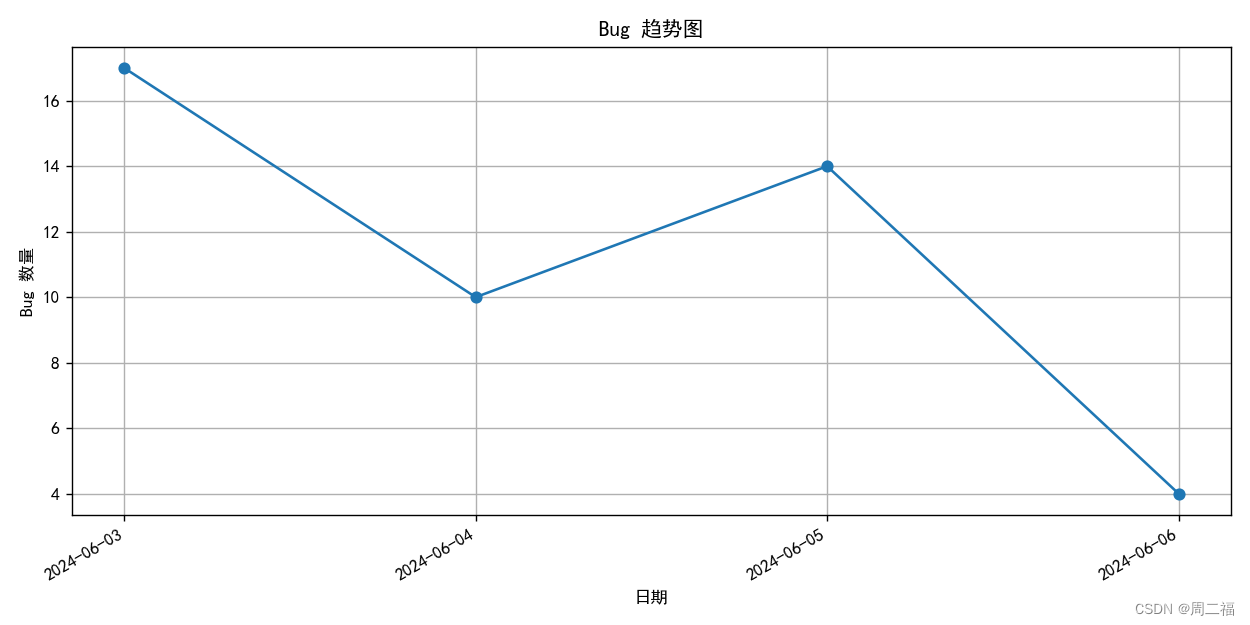
效果图
代码实现
import csv
from datetime import datetime
import matplotlib.pyplot as plt
import matplotlib.font_manager as font_manager
from collections import defaultdict
plt.rcParams['font.sans-serif'] = ['SimHei']  # 替换为你实际安装的中文字体

def read_bug_data(path):
    # 使用defaultdict来按日期分组bug数量
    bug_counts_per_date = defaultdict(int)
    with open(path, newline="", encoding="utf-8") as csvfile:
        reader = csv.DictReader(csvfile)
        for row in reader:
            date_str = row["创建日期"]  # 假设日期列名为'创建日期'

            # 提取日期的'YYYY-MM-DD'部分
            date_only = datetime.strptime(date_str, "%Y-%m-%d %H:%M:%S").date()

            # 计数加1
            bug_counts_per_date[date_only] += 1

    # 提取日期和bug数量
    dates = list(bug_counts_per_date.keys())
    counts = list(bug_counts_per_date.values())

    # 按日期排序
    sorted_data = sorted(zip(dates, counts))
    sorted_dates, sorted_counts = zip(*sorted_data)

    return sorted_dates, sorted_counts

def plot_bug_trend(dates, counts):
    plt.figure(figsize=(10, 5))
    # 格式化日期,只显示'YYYY-MM-DD'部分
    formatted_dates = [date.strftime("%Y-%m-%d") for date in dates]
    plt.plot(formatted_dates, counts, marker="o")
    plt.title("Bug 趋势图")  # 使用中文字符串作为标题
    plt.xlabel("日期")  # 使用中文字符串作为 x 轴标签
    plt.ylabel("Bug 数量")  # 使用中文字符串作为 y 轴标签
    plt.grid(True)
    # 如果日期标签太长,可以旋转显示
    plt.xticks(rotation=45)
    plt.gcf().autofmt_xdate()  # 自动调整日期标签的角度
    plt.tight_layout()  # 确保标签不会重叠
    plt.show()

# 定义 CSV 文件路径
csv_path = r"C:\Users\EDY\Downloads\csv-Bug.csv"

# 读取 bug 数据并绘制趋势图
sorted_dates, sorted_counts = read_bug_data(csv_path)
plot_bug_trend(sorted_dates, sorted_counts)


 1万+
1万+

 被折叠的 条评论
为什么被折叠?
被折叠的 条评论
为什么被折叠?
 到【灌水乐园】发言


