


ehcarts属性简单配置:
- x轴或y轴标签全部显示:在xAxis或yAxis中axisLabel中设置interval: 0
- 自定义富文本样式,设置color为系列色:可设置color: ‘inherit’
- 双柱图或多柱图设置不同系列柱子的间隔:可在series中设置barGap:‘30%’ (注:设置多个则只有一个值有效)
- 设置同一个系列柱子之间间距:可在series中设置barCategoryGap:‘90%’ (注:设置barWidth后该值无效且多个则只有一个值有效()
echarts-配置集合
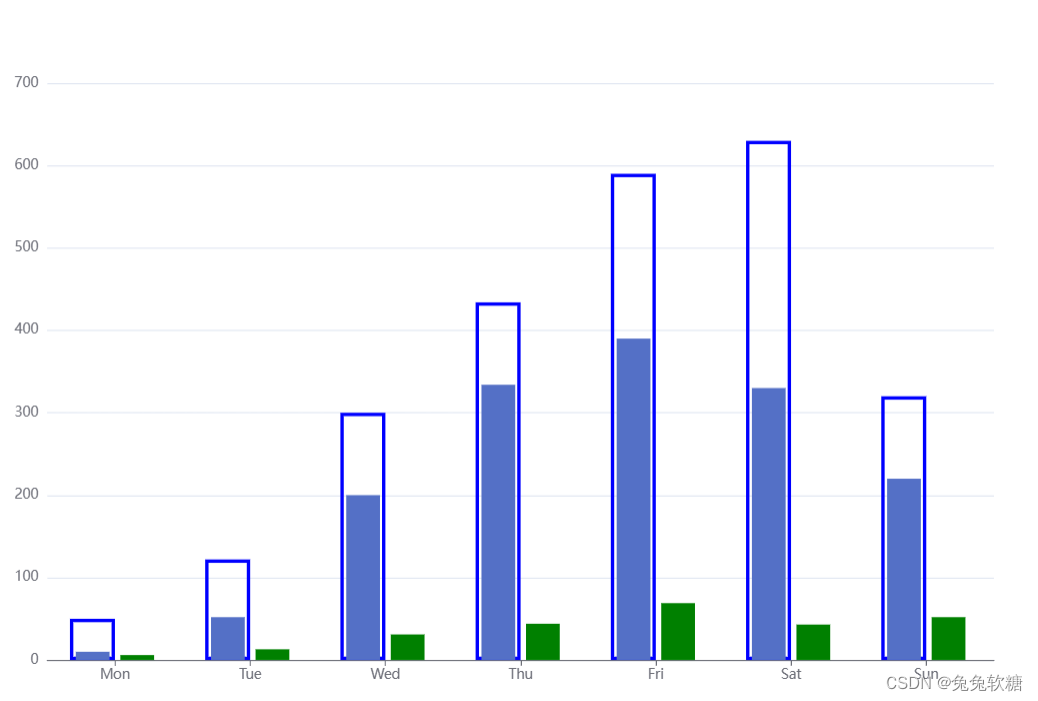
柱状图-双柱(空心柱+实心柱,两个不同宽度的柱子重叠)

option = {
  tooltip: {
    trigger: 'axis',
    axisPointer: {
      type: 'shadow'
    }
  },
  grid: {
    left: '3%',
    right: '4%',
    bottom: '3%',
    containLabel: true
  },
  xAxis: [
    {
      type: 'category',
      data: ['Mon', 'Tue', 'Wed', 'Thu', 'Fri', 'Sat', 'Sun'],
      axisTick: {
        alignWithLabel: true
      }
    },
    {
      type: 'category',
      data: ['Mon', 'Tue', 'Wed', 'Thu', 'Fri', 'Sat', 'Sun'],
      axisTick: {
        alignWithLabel: true
      },
      show:false
    }
  ],
  yAxis: [
    {
      type: 'value'
    }
  ],
  series: [
    {
      zlevel:1,
      name: 'Direct',
      type: 'bar',
      barWidth: '60%',
      data: [10, 52, 200, 334, 390, 330, 220]
    },
    {
      xAxisIndex:1,
      name: 'Direct',
      type: 'bar',
      barWidth: '60%',
      itemStyle:{
        color:'rgba(0,0,0,0)',
        borderColor:'blue',
        borderWidth:3,
      },
      barWidth:90,
      data: [50, 122, 300, 434, 590, 630, 320]
    }
  ]
};
柱状图-三个柱子(其中两个不同宽度柱子重叠)
option = {
  tooltip: {
    trigger: 'axis',
    axisPointer: {
      type: 'shadow'
    }
  },
  grid: {
    left: '3%',
    right: '4%',
    bottom: '3%',
    containLabel: true
  },
  xAxis: [
    {
      type: 'category',
      data: ['Mon', 'Tue', 'Wed', 'Thu', 'Fri', 'Sat', 'Sun'],
      axisTick: {
        alignWithLabel: true
      }
    },
    {
      type: 'category',
      data: ['Mon', 'Tue', 'Wed', 'Thu', 'Fri', 'Sat', 'Sun'],
      axisTick: {
        alignWithLabel: true
      },
      show:false
    }
  ],
  yAxis: [
    {
      type: 'value'
    }
  ],
  series: [
    {
      zlevel:1,
      name: 'Direct',
      type: 'bar',
      barWidth: 30,
      data: [10, 52, 200, 334, 390, 330, 220]
    },
    {
      zlevel:1,
      name: 'Direct',
      type: 'bar',
      barWidth: 30,
      color:'green',
      barGap:0.32,
      data:[6, 13, 31, 44, 69, 43, 52]
    },
    {
      xAxisIndex:1,
      name: 'Direct',
      type: 'bar',
      itemStyle:{
        color:'rgba(0,0,0,0)',
        borderColor:'blue',
        borderWidth:3,
      },
       barGap:0,
      barWidth:40,

      data: [50, 122, 300, 434, 590, 630, 320]
    },
    {
      xAxisIndex:1,
      name: 'Direct',
      type: 'bar',
      itemStyle:{
        color:'rgba(0,0,0,0)',
      },
      barWidth:40,
      barCategoryGap:0,
      data: [60, 132, 310, 444, 690, 430, 520]
    },
  ]
};
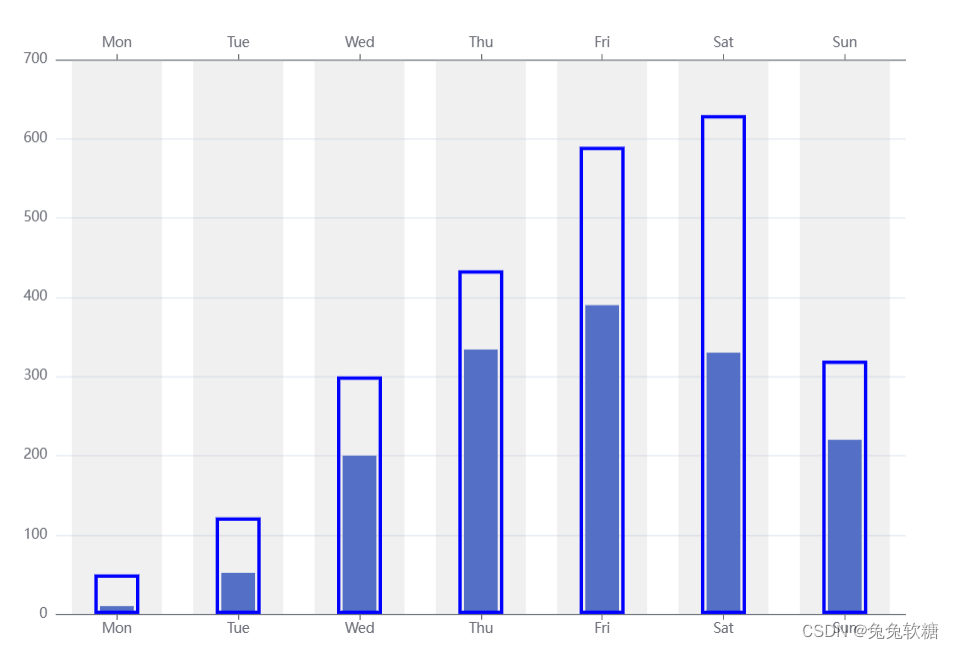
柱状图-柱状图阴影比柱子宽
option = {
  tooltip: {
    trigger: 'axis',
    axisPointer: {
      type: 'shadow'
    }
  },
  grid: {
    left: '3%',
    right: '4%',
    bottom: '3%',
    containLabel: true
  },
  xAxis: [
    {
      type: 'category',
      data: ['Mon', 'Tue', 'Wed', 'Thu', 'Fri', 'Sat', 'Sun'],
      axisTick: {
        alignWithLabel: true
      }
    },
    {
      type: 'category',
      data: ['Mon', 'Tue', 'Wed', 'Thu', 'Fri', 'Sat', 'Sun'],
      axisTick: {
        alignWithLabel: true
      },
      show:true
    },
    {
      type: 'category',
      data: ['Mon', 'Tue', 'Wed', 'Thu', 'Fri', 'Sat', 'Sun'],
      axisTick: {
        alignWithLabel: true
      },
      show:false
    }
  ],
  yAxis: [
    {
      type: 'value'
    }
  ],
  series: [
    {
      zlevel:1,
      name: 'Direct',
      type: 'bar',
      barWidth: 30,
      data: [10, 52, 200, 334, 390, 330, 220]
    },
    // {
    //   zlevel:1,
    //   name: 'Direct',
    //   type: 'bar',
    //   barWidth: 30,
    //   color:'green',
    //   barGap:0.32,
    //   data:[6, 13, 31, 44, 69, 43, 52]
    // },
    {
      zlevel:1,
      xAxisIndex:1,
      name: 'Direct',
      type: 'bar',
      itemStyle:{
        color:'rgba(0,0,0,0)',
        borderColor:'blue',
        borderWidth:3,
      },
      barGap:0,
      barWidth:40,

      data: [50, 122, 300, 434, 590, 630, 320]
    },
    // {
    //   zlevel:0,
    //   xAxisIndex:1,
    //   name: 'Direct',
    //   type: 'bar',
    //   itemStyle:{
    //     color:'rgba(0,0,0,0)',
    //   },
    //   barWidth:40,
    //   barCategoryGap:0,
    //   data: [60, 132, 310, 444, 690, 430, 520]
    // },
    {
      zlevel:0,
      xAxisIndex:2,
      name: 'Direct',
      type: 'bar',
      showBackground:true,
      itemStyle:{
        color:'rgba(0,0,0,0)'
      },
      barWidth:80,
      barCategoryGap:0,
      data: [60, 132, 310, 444, 690, 430, 520]
    },
  ]
};
双向柱状图

option = {
  title: {
    text: 'World Population'
  },
   tooltip: {
    show: true,
    trigger: "axis",
    axisPointer: {
      type: "shadow",
    },
  },
  legend:{

  },
  grid: [
    {
      left: "5%",
      width: "43%",

    },
    {
      left: "51.5%",
      width: "10%",
    },
    {
      right: "5%",
      width: "43%",

    },
  ],
  xAxis: [
    {
      type: "value",
      inverse: true,
      show: true,
    },
    {
      gridIndex: 1,
      show: false,
    },
    {
      gridIndex: 2,
      type: "value",
      show: true,
    },
  ],
  yAxis: [
    {
      axisLabel: {
        show: false,
      },
      type: "category",
     data: ["10","20", "30",]
    },
    {
      gridIndex: 1,
      position: "center",
      axisLine: {
        show: false,
      },
      type: "category",
      data: ["10","20", "30",]

    },

    {
      gridIndex: 2,
      position: "left",
      axisLabel: {
        show: false,
      },
      type: "category",
     data: ["10","20", "30",]
    },
  ],
  series: [
    {
      type: "bar",
      barWidth: 15,
      name: "data1",
      data:[10,20,30],
    },
    {
      type: "bar",
      barWidth: 15,
      xAxisIndex: 2,
      yAxisIndex: 2,
      name: "data2",
       data:[10,20,30],
    },
  ],
};
双柱状-双折线图,折线偏移至每个柱子上方

option = {
  tooltip: {
    trigger: 'axis',
    axisPointer: {
      type: 'cross',
      crossStyle: {
        color: '#999'
      }
    }
  },
  toolbox: {
    feature: {
      dataView: { show: true, readOnly: false },
      magicType: { show: true, type: ['line', 'bar'] },
      restore: { show: true },
      saveAsImage: { show: true }
    }
  },
  legend: {
    data: ['Evaporation', 'Precipitation', 'Temperature']
  },
  xAxis: [
    {
      type: 'category',
      data: ['Mon', 'Tue', 'Wed', 'Thu', 'Fri', 'Sat', 'Sun'],
      axisPointer: {
        type: 'shadow'
      }
    },
    {
    },
  ],
  yAxis: [
    {
      type: 'value',
      name: 'Precipitation',
      min: 0,
      max: 250,
      interval: 50,
      axisLabel: {
        formatter: '{value} ml'
      }
    },
    {
      type: 'value',
      name: 'Precipitation',
      min: 0,
      max: 250,
      interval: 50,
      axisLabel: {
        formatter: '{value} ml'
      }
    },
  ],
  series: [
    {
      name: 'Evaporation',
      type: 'bar',
      tooltip: {
        valueFormatter: function (value) {
          return value + ' ml';
        }
      },
      data: [
        2.0, 4.9, 7.0, 23.2, 25.6, 76.7, 135.6,
      ]
    },
    {
      name: 'Precipitation',
      type: 'bar',
      tooltip: {
        valueFormatter: function (value) {
          return value + ' ml';
        }
      },
      data: [
        2.6, 5.9, 9.0, 26.4, 28.7, 70.7, 175.6,
      ]
    },
    {
      name: 'Temperature',
      type: 'line',
      yAxisIndex: 1,
      xAxisIndex:1,
      tooltip: {
        valueFormatter: function (value) {
          return value + ' °C';
        }
      },
      itemStyle:{
        color:'pink'
      },
      data: [
        2.0, 4.9, 7.0, 23.2, 25.6, 76.7, 135.6,
      ]
    },
    {
      name: 'Temperature',
      type: 'line',
      yAxisIndex: 1,
      xAxisIndex:1,
      tooltip: {
        valueFormatter: function (value) {
          return value + ' °C';
        }
      },
      itemStyle:{
        color:'orange'
      },
      data:[
        2.6, 5.9, 9.0, 26.4, 28.7, 70.7, 175.6,
      ]
    }
  ]
};
option.xAxis[1] =
  {
    type: 'value',
    //data.length=7
    max: 7 * 100,
    show: false,
    axisPointer:{
      // show:false
      label:{
        show:false
      }
    }
  }
  option.series[2].data = option.series[2].data.map((x, i) => {
    return [30 + i * 100, x]
  })
  option.series[3].data = option.series[3].data.map((x, i) => {
    return [70 + i * 100, x]
  })
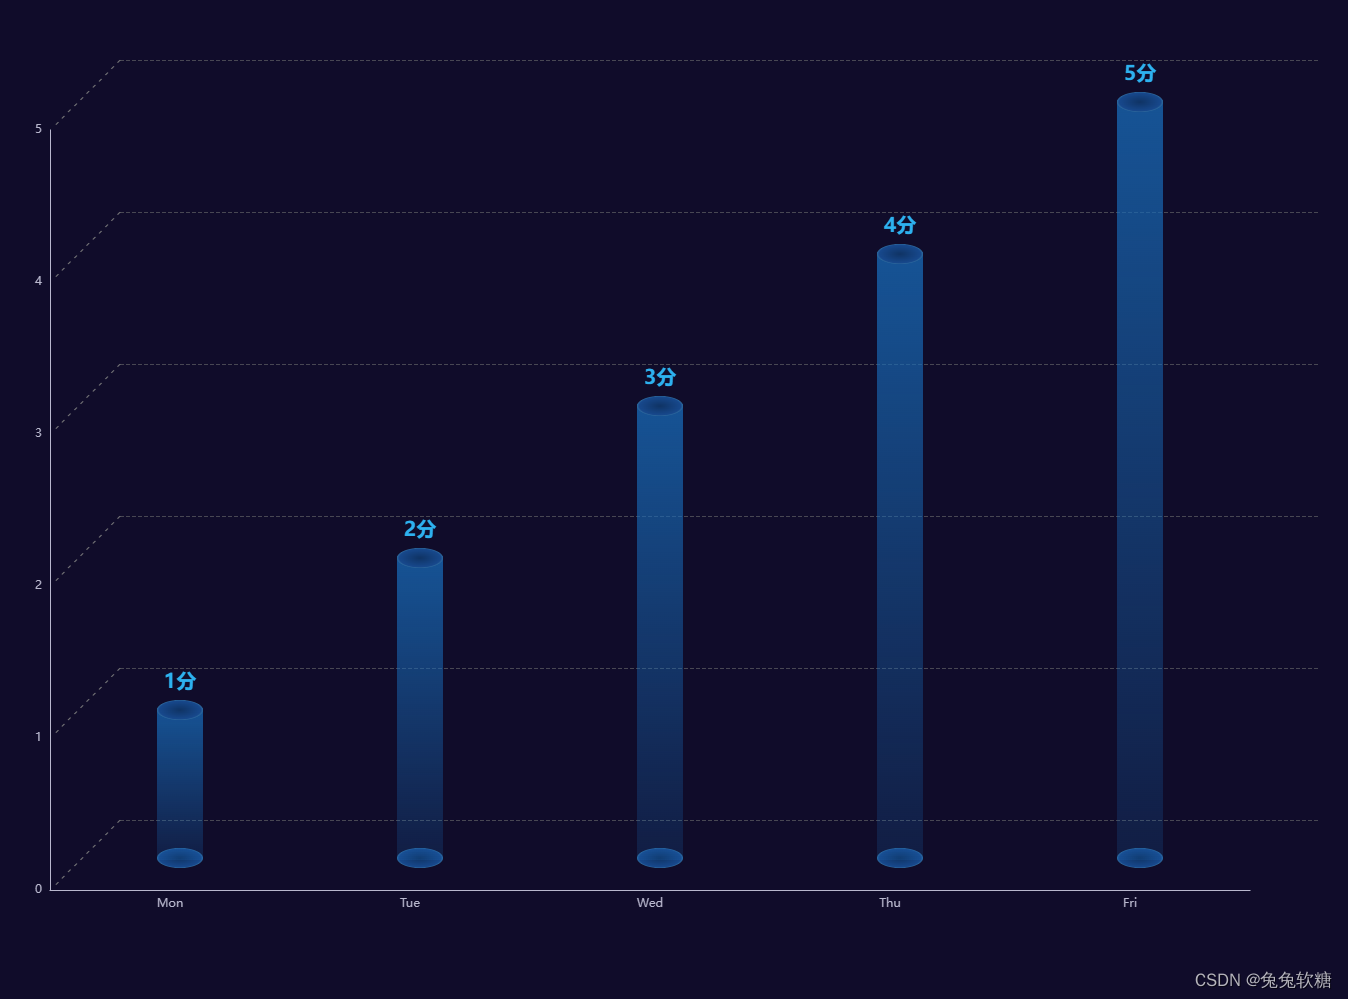
立体柱状图(3D柱状图)
option = {
  tooltip:{
    show:true,
  },
  xAxis: [
    {
      axisPointer:false,
      show:false,
      type: 'category',
      data: ['Mon', 'Tue', 'Wed', 'Thu', 'Fri', ],
        axisLine: {
          show: false
        },
      axisTick: {
        show: false
      },
    },
    {
      axisPointer:false,
      triggerEvent:false,
      type: 'category',
      data: ['Mon', 'Tue', 'Wed', 'Thu', 'Fri', ],
      gridIndex:1,
      axisTick: {
        show: false //刻度线
      },
    },
    {
        axisPointer:false,
         triggerEvent:false,
      show:false,
      type: 'category',
      data: ['Mon', 'Tue', 'Wed', 'Thu', 'Fri', ],
      gridIndex:2,
      axisLine: {
        show: false //隐藏y轴
      },
      axisTick: {
        show: false //刻度线
      },
    }
  ],
   grid: [
    {
      left: "60",
      right: "60",
      top:'100',
      height:'760',
      width:'1200',
    },
    {
      left: "50",
      right: "40",
      top:'130',
      height:'760',
       width:'1200',
    },
    {
      left: "120",
      right: "40",
      top:'60',
      height:'760',
       width:'1200',
    },
  ],
  yAxis:[
     {
      offset:15,
      show:true,
      type: 'value',
      axisLine: {
        show: false //隐藏y轴
      },
      splitLine:{
        show:false
      },
      axisLabel:{
        show:true,
        formatter:'\n\n\n\n\n\n'+'- - - - - - - - - - -',
        rotate:45,
        inside:true,
        color:'gray',
        margin:-15,
      }
    },
    {
    type: 'value',
    gridIndex:1,
      axisLine: {
        show: true, //隐藏y轴,
      },
      axisTick: {
        show: false //刻度线
      },
      splitLine:{
        show:false
      }
    },
    {
        type: 'value',
        gridIndex:2,
        axisLabel:true,
        splitLine:{
          lineStyle:{
          type:'dashed',
        }
      },
      axisLine: {
        show: false //隐藏y轴
      },
       axisTick: {
        show: false //刻度线
      },
    },
  ],
  series: [
    {
      name: '底部截面',
      type: 'pictorialBar', //pictorialBar 象形柱图
      symbolSize: [46, 20], //调整截面形状
      symbolOffset: [0, 8],
       xAxisIndex:0,
      yAxisIndex:0,
      zlevel: 12,
      itemStyle: {
        normal: {
           color: new echarts.graphic.RadialGradient(0.5, 0.5,  0.5, [
                    {
                      offset: 0,
                      color: '#0f3364'
                    },
                    {
                      offset: 0.9,
                      color: '#17488c'
                    },
                    {
                      offset: 1,
                      color: '#2f6a9d'
                    }
                  ])


        }
      },
      // 实现数字展示在柱状图
      label: {
        show: true,
        position: 'top',
        fontSize: 20,
        color: '#2DB1EF',
        fontWeight: 'bold',
        offset: [0, -10],
        formatter: '{c}分' //添加单位
      },
      data: [1,2,3,4,5]
    },
    {
      type: 'pictorialBar', //pictorialBar 象形柱图
      symbolSize: [46, 20], //调整截面形状
      symbolOffset: [0, -8],
      zlevel: 12,
      xAxisIndex:0,
      yAxisIndex:0,
      symbolPosition: 'end', //图形的位置 'start':图形边缘与柱子开始的地方内切。'end':图形边缘与柱子结束的地方内切。'center':图形在柱子里居中。
      itemStyle: {
        normal: {
          color: new echarts.graphic.RadialGradient(0.5, 0.5,  0.5, [
                  {
                    offset: 0,
                    color: '#0f3364'
                  },
                  {
                    offset: 0.9,
                    color: '#17488c'
                  },
                  {
                    offset: 1,
                    color: '#2f6a9d'
                  }
                ])
        }
      },
      data: [1,2,3,4,5]
    },
    {
      type: 'bar', //bar 柱状图
      zlevel:1,
      barWidth: 46,
      barGap: '0%',
      xAxisIndex:0,
      yAxisIndex:0,
      itemStyle: {
        //柱状样式
        normal: {
          color: {
            x: 0,
            y: 0,
            x2: 0,
            y2: 1,
            type: 'linear',
            global: false,
            colorStops: [
             {
                    offset: 0,
                    color: 'rgba(24,106,183,0.76)'
                  },
                  {
                    offset: 1,
                    color: 'rgba(24,106,183,0.18)'
                  }
            ]
          }
        }
      },
      data: [1,2,3,4,5]
    },
    {
       type: 'bar', //bar 柱状图
       xAxisIndex:1,
       yAxisIndex:1,
        barWidth:1,
       itemStyle:{
       color:'rgba(0,0,0,0)'
       },
        data: [1,2,3,4,5]
    },
    {
       type: 'bar', //bar 柱状图
       xAxisIndex:2,
       yAxisIndex:2,
       barWidth:1,
       itemStyle:{

           color:'rgba(0,0,0,0)'
       },
        data: [1,2,3,4,5]
    }
  ]
};
折线图:超过1000为红色(分段型视觉映射)
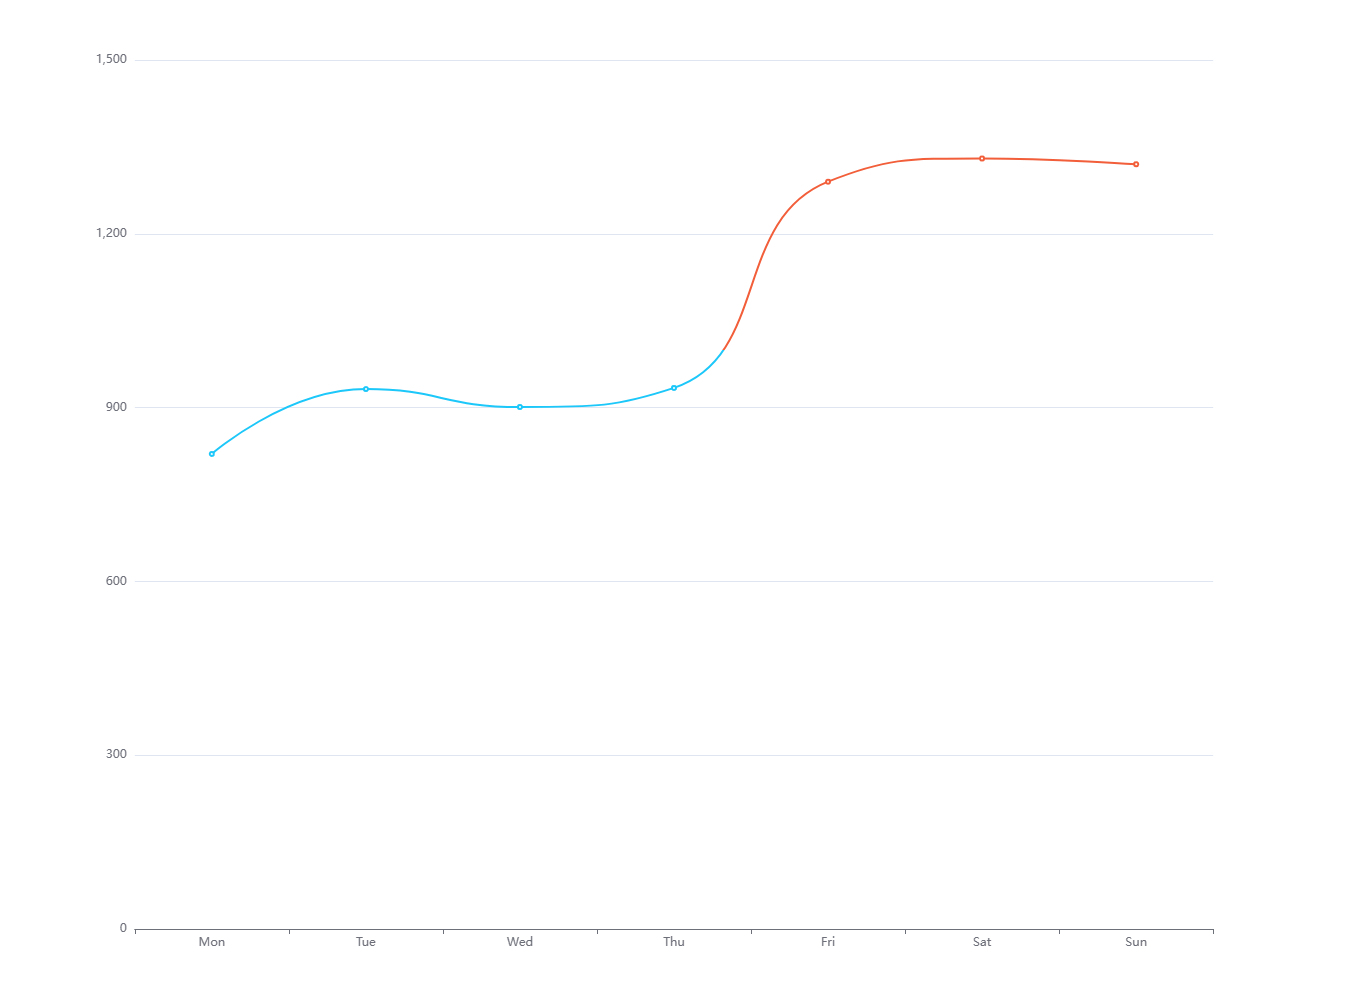
option = {
  xAxis: {
    type: 'category',
    data: ['Mon', 'Tue', 'Wed', 'Thu', 'Fri', 'Sat', 'Sun']
  },
  yAxis: {
    type: 'value'
  },
  visualMap:[
          {
            show: false,
            seriesIndex: 0,
            dimension: 1,
            pieces: [
              {
                gt: -10,
                lte: 1000,
                color: '#1CC7F9'
              },
              {
                gt: 1000,
                color: '#F25E39'
              }
            ]
          },
        ],
  series: [
    {
      data: [820, 932, 901, 934, 1290, 1330, 1320],
      type: 'line',
      smooth: true
    }
  ]
};
饼图自动轮播高亮,tooltip跟随自动轮播显示,鼠标移入暂停轮播显示当前高亮,鼠标移出自动轮播,其他图同理

option = {
  tooltip: {
    trigger: 'item',
  },
  legend: {
    top: '5%',
    left: 'center'
  },
  series: [
    {
      name: 'Access From',
      type: 'pie',
      radius: ['40%', '70%'],
      avoidLabelOverlap: false,
      itemStyle: {
        borderRadius: 10,
        borderColor: '#fff',
        borderWidth: 2
      },
      label: {
        show: false,
        position: 'center'
      },
      emphasis: {
        label: {
          show: true,
          fontSize: 40,
          fontWeight: 'bold'
        }
      },
      labelLine: {
        show: false
      },
      data: [
        { value: 1048, name: 'Search Engine' },
        { value: 735, name: 'Direct' },
        { value: 580, name: 'Email' },
        { value: 484, name: 'Union Ads' },
        { value: 300, name: 'Video Ads' }
      ]
    }
  ]
};
let currentIndex = -1; // 当前高亮下标
let pieTimmer = setInterval(selectPie, 1000); // 定时器

function selectPie() {
  var length = option.series[0].data.length;
  currentIndex = (currentIndex + 1) % length;
  highlightPie();
}

function highlightPie() {
  for(var idx in option.series[0].data)
    //取消高亮
    myChart.dispatchAction({
      type: 'downplay',
      seriesIndex: 0,
      dataIndex: idx
    });
    //tooltip显示
    myChart.dispatchAction({
      type: "showTip",
      seriesIndex: 0,
      dataIndex: currentIndex,
    });

    //高亮
    myChart.dispatchAction({
      type: 'highlight',
      seriesIndex: 0,
      dataIndex: currentIndex
    });
}
myChart.on('mouseover', (params) => {
	if(pieTimmer)
		clearInterval(pieTimmer);
	currentIndex = params.dataIndex;
	highlightPie();
});

myChart.on('mouseout', (params) => {
  if(pieTimmer)
    clearInterval(pieTimmer);
  pieTimmer = setInterval(selectPie, 1000);
});
饼图自动轮播样式2:选中饼图凸出,设置selectedMode后,饼图可以被选中,鼠标点击其中一块,饼图会凸出显示

option = {
  title: {
    text: 'Referer of a Website',
    subtext: 'Fake Data',
    left: 'center'
  },
  tooltip: {
    trigger: 'item'
  },
  legend: {
    orient: 'vertical',
    left: 'left'
  },
  series: [
    {
      name: 'Access From',
      type: 'pie',
      radius: '50%',
      data: [
        { value: 1048, name: 'Search Engine' },
        { value: 735, name: 'Direct' },
        { value: 580, name: 'Email' },
        { value: 484, name: 'Union Ads' },
        { value: 300, name: 'Video Ads' }
      ],
      selectedMode:'single',
      selectedOffset:20,
      select: {
        itemStyle: {
          shadowBlur: 10,
          shadowOffsetX: 0,
          shadowColor: 'rgba(0, 0, 0, 0.5)'
        }
      }
    }
  ]
};

let currentIndex = -1; // 当前高亮下标
let pieTimmer = setInterval(selectPie, 1000); // 定时器

function selectPie() {
  var length = option.series[0].data.length;
  currentIndex = (currentIndex + 1) % length;
  highlightPie();
}
function highlightPie() {
  myChart.dispatchAction({
      seriesIndex: 0,
      type: 'select',
      dataIndex: currentIndex
    });
}
myChart.on('mouseover', (params) => {
	if(pieTimmer)
		clearInterval(pieTimmer);
	currentIndex = params.dataIndex;
	highlightPie();
});

myChart.on('mouseout', (params) => {
  if(pieTimmer)
    clearInterval(pieTimmer);
  pieTimmer = setInterval(selectPie, 1000);
});


 1万+
1万+


 被折叠的 条评论
为什么被折叠?
被折叠的 条评论
为什么被折叠?
 到【灌水乐园】发言


