


目录
需求
需要给
1.多条柱状图中柱状添加背景如下图
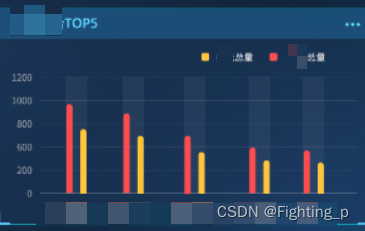
1. 多条柱状图
效果图
代码
<template>
  <div>
    <div id="main1" />
    <!-- <div id="main2" /> -->
    <dialogCom v-if="dialogVisible" :title="'部门综合排名'">
      <div slot="content">
        <div id="main3" />
        <!-- <div id="main4" /> -->
      </div>
    </dialogCom>
  </div>
</template>

<script>
import dialogCom from './dialog-com'
// import { GetDeptRankData } from '@/api/screen'

export default {
  name: 'DepRank',
  components: {
    dialogCom
  },
  props: {
    code: {
      type: String,
      default: '1'
    }
  },
  data() {
    return {
      dialogVisible: false,
      myChart: null,
      result: {},
      echartsTypePage: true, // 页面中 显示“执法总量 true”、“风险总量 false”
      echartsTypeDialog: true // 对话框中 显示“执法总量 true”、“风险总量 false”
    }
  },
  watch: {
    code: {
      handler(val, oldVal) {
        if (val !== oldVal) {
          this.GetDeptRankData()
        }
      },
      immediate: true
    },
    dialogVisible: {
      handler(val) {
        this.$nextTick(() => {
          val && this.init('main3', 'dialog')
        })
      }
    }
  },
  mounted() {
    window.addEventListener('resize', () => {
      if (document.getElementById('main1')) {
        this.myChart = this.$echarts.init(document.getElementById('main1'))
        this.myChart.resize()
      }
      if (document.getElementById('main3')) {
        this.myChart = this.$echarts.init(document.getElementById('main3'))
        this.myChart.resize()
      }
    })
  },
  methods: {
    GetDeptRankData() {
      // GetDeptRankData(this.code).then((res) => {
      //   this.result = res.data || { zfl: [], yjl: [] }
      //   this.init('main1')
      // })
      this.$nextTick(() => {
        this.init('main1')
      })
    },

    init(dom, from = '') {
      if (this.myCharts) {
        this.myCharts.dispose()
      }
      if (!document.getElementById(dom)) return
      // 基于准备好的dom,初始化this.$echarts实例
      this.myChart = this.$echarts.init(document.getElementById(dom))

      // 指定图表的配置项和数据
      const option = {
        title: {
          show: false
        },
        legend: {
          data: ['执法总量', '风险总量'],
          right: '2%',
          itemWidth: 10,
          itemHeight: 10,
          textStyle: {
            color: '#ffffff'
          }
        },
        tooltip: {
          trigger: 'axis',
          backgroundColor: 'rgba(0, 0, 0, 0.75)',
          color: '#fff',
          borderWidth: '1',
          borderColor: 'gray',
          textStyle: {
            color: '#fff'
          }
        },
        xAxis: {
          // data: (this.result.zfl || []).slice(0, from === 'dialog' ? (this.result.zfl || []).length : 5).map((item) => item.dwmc),
          data: ['部门1', '部门2', '部门3', '部门4', '部门5', '部门6', '部门7', '部门8', '部门9', '部门10'],
          axisLabel: {
            interval: 0,
            rotate: from === 'dialog' ? 45 : 0,
            textStyle: {
              color: '#fff'
            }
          },
          axisTick: {
            show: false
          },
          axisLine: {
            lineStyle: {
              type: 'solid',
              color: '#E9E9E9',
              width: '1'
            }
          }
        },
        yAxis: {
          min: 0,
          minInterval: 1,
          boundaryGap: ['10%', '10%'],
          type: 'value',
          splitLine: {
            lineStyle: {
              type: 'dashed',
              color: '#314765'
            }
          },

          axisLabel: {
            interval: 0,
            textStyle: {
              color: '#fff'
            }
          }
        },
        series: [
          {
            barWidth: 14,
            name: '执法总量',
            type: 'bar',
            // data: (this.result.zfl || []).slice(0, from === 'dialog' ? (this.result.zfl || []).length : 5).map((item) => item.zl),
            data: [5, 10, 9, 23, 12, 18, 2, 17, 12, 21].slice(0, from === 'dialog' ? [5, 10, 9, 23, 12, 18, 2, 17, 12, 21].length : 5),
            itemStyle: {
              borderRadius: [10, 10, 0, 0],
              color: '#ffc53d'
            }
          },
          {
            barWidth: 14,
            name: '风险总量',
            type: 'bar',
            // data: (this.result.yjl || []).slice(0, from === 'dialog' ? (this.result.yjl || []).length : 5).map((item) => item.yjsl),
            data: [15, 23, 2, 12, 12, 20, 23, 5, 20, 1].slice(0, from === 'dialog' ? [15, 23, 2, 12, 12, 20, 23, 5, 20, 1].length : 5),
            itemStyle: {
              borderRadius: [10, 10, 0, 0],
              color: '#ff4d4f'
            }
          }
        ],
        grid: {
          x: 0,
          y: 50,
          x2: 0,
          y2: 50,
          left: '3%',
          right: 30,
          top: '10%',
          bottom: '0%',
          containLabel: true
        }
      }

      // 使用刚指定的配置项和数据显示图表。
      this.myChart.setOption(option)
    }
  }
}
</script>

<style lang="scss" scoped>
::v-deep #main1,
::v-deep #main2 {
  height: 220px;
}

::v-deep #main3,
::v-deep #main4 {
  width: 92%;
  height: 400px;
  margin: 0 auto;
}

.dialogLegendPosition {
  top: 150px;
  right: 150px;
  z-index: 10;
}
</style>
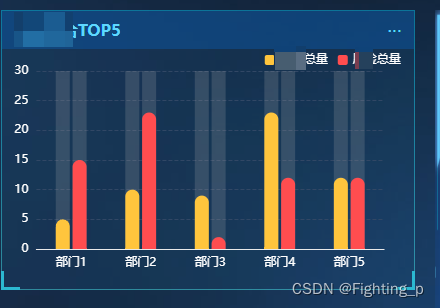
2. 给 series 中各个柱子添加 showBackground: true,
效果图
代码
series: [
  {
    barWidth: 14,
    name: '执法总量',
    type: 'bar',
    showBackground: true, // 【主要代码】
    // data: (this.result.zfl || []).slice(0, from === 'dialog' ? (this.result.zfl || []).length : 5).map((item) => item.zl),
    data: [5, 10, 9, 23, 12, 18, 2, 17, 12, 21].slice(0, from === 'dialog' ? [5, 10, 9, 23, 12, 18, 2, 17, 12, 21].length : 5),
    itemStyle: {
      borderRadius: [10, 10, 0, 0],
      color: '#ffc53d'
    }
  },
  {
    barWidth: 14,
    name: '风险总量',
    type: 'bar',
    showBackground: true, // 【主要代码】
    // data: (this.result.yjl || []).slice(0, from === 'dialog' ? (this.result.yjl || []).length : 5).map((item) => item.yjsl),
    data: [15, 23, 2, 12, 12, 20, 23, 5, 20, 1].slice(0, from === 'dialog' ? [15, 23, 2, 12, 12, 20, 23, 5, 20, 1].length : 5),
    itemStyle: {
      borderRadius: [10, 10, 0, 0],
      color: '#ff4d4f'
    }
  }
],
总结
直接给
series中各个柱子添加showBackground: true,,是给每个柱子添加背景,柱子和柱子之间会有空隙没有背景
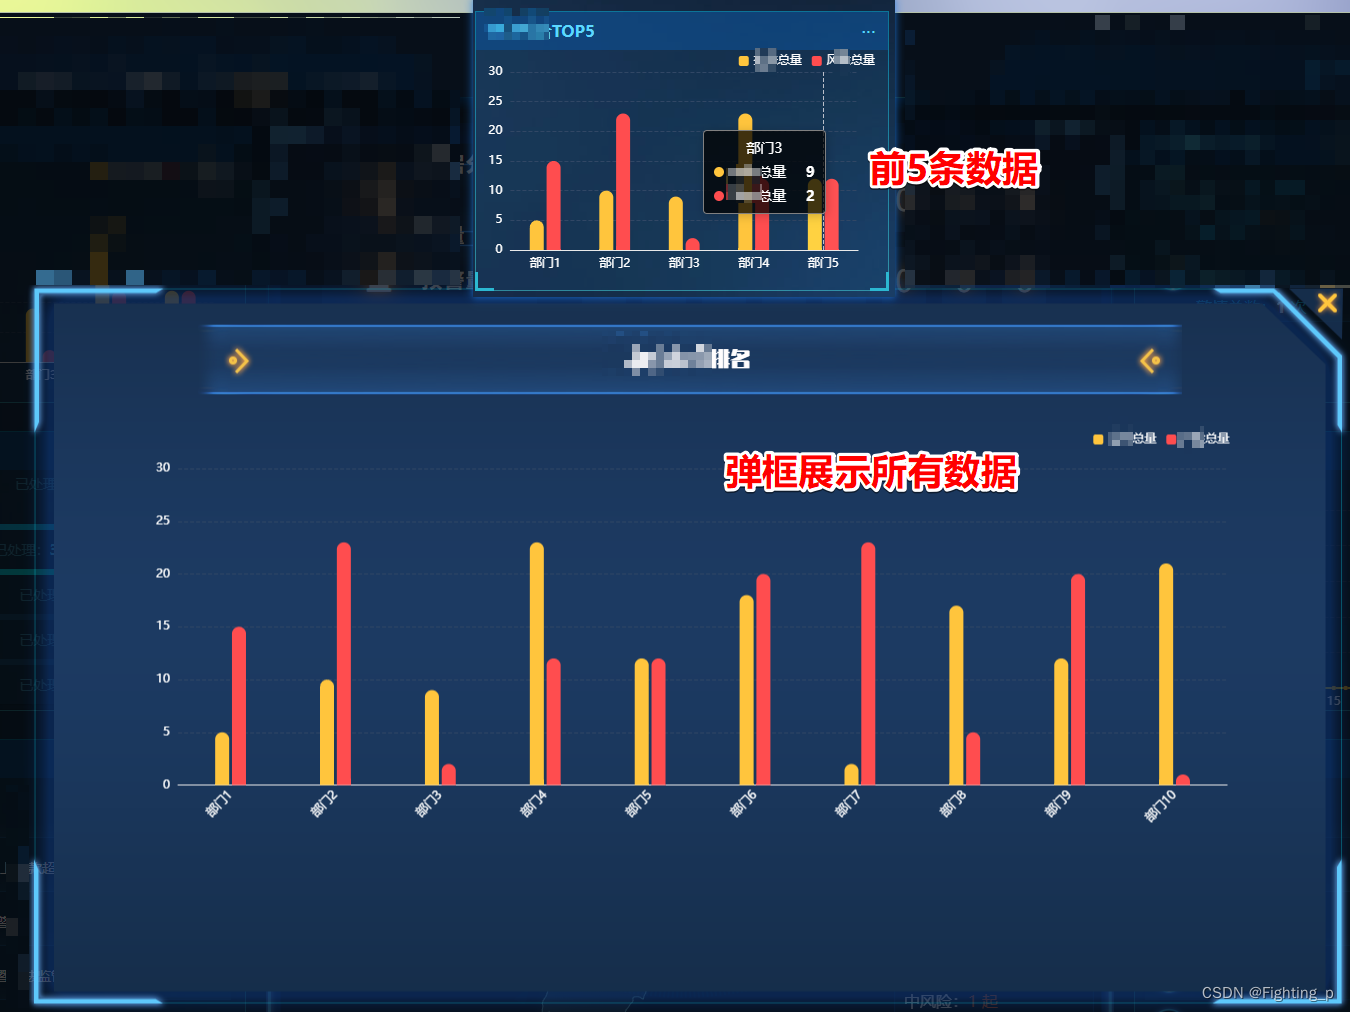
3. 给 series 多添加一个元素用来作为背景 并 tooltip 中展示内容自定义 【最终】
3.1 给 series 多添加一个元素用来作为背景
效果图
上图中 tooltip 展示内容把
series多添加的那个元素也展示出来了,要把这个去掉(见 3.2)
代码
series: [
  /** ** 【主要代码】 start ****/
  // 【注意】计算宽度 和 data 赋值时,要注意有几条数据
  {
    type: 'custom',
    itemStyle: {
      color: 'rgba(255, 255, 255, 0.05)'
    },
    renderItem: (params, api) => {
      // 获取对应类目的axisTick中心点坐标
      var start = api.coord([api.value(0)])

      // 通过坐标系的宽度和类目数,计算单个类目的背景
      var width = (params.coordSys.width / (from === 'dialog' ? (this.result.zfl || []).length : 5)) * 0.6 // 【注意】有几条数据数组就用 params.coordSys.width 除以几

      return {
        type: 'rect',
        shape: {
          // 相对左上角坐标
          x: start[0] - width / 2,
          y: params.coordSys.y,
          width: width,
          height: params.coordSys.height
        },
        style: api.style()
      }
    },
    data: [...Array(from === 'dialog' ? (this.result.zfl || []).length : 5).keys()].map(() => 0) // 【注意】有几条数据数组就有几个元素,元素值为0
  },
  /** ** 【主要代码】 end ****/
  {
    barWidth: 14,
    name: '执法总量',
    type: 'bar',
    // showBackground: true,
    // data: (this.result.zfl || []).slice(0, from === 'dialog' ? (this.result.zfl || []).length : 5).map((item) => item.zl),
    data: [5, 10, 9, 23, 12, 18, 2, 17, 12, 21].slice(0, from === 'dialog' ? [5, 10, 9, 23, 12, 18, 2, 17, 12, 21].length : 5),
    itemStyle: {
      borderRadius: [10, 10, 0, 0],
      color: '#ffc53d'
    }
  },
  {
    barWidth: 14,
    name: '风险总量',
    type: 'bar',
    // showBackground: true,
    // data: (this.result.yjl || []).slice(0, from === 'dialog' ? (this.result.yjl || []).length : 5).map((item) => item.yjsl),
    data: [15, 23, 2, 12, 12, 20, 23, 5, 20, 1].slice(0, from === 'dialog' ? [15, 23, 2, 12, 12, 20, 23, 5, 20, 1].length : 5),
    itemStyle: {
      borderRadius: [10, 10, 0, 0],
      color: '#ff4d4f'
    }
  }
],
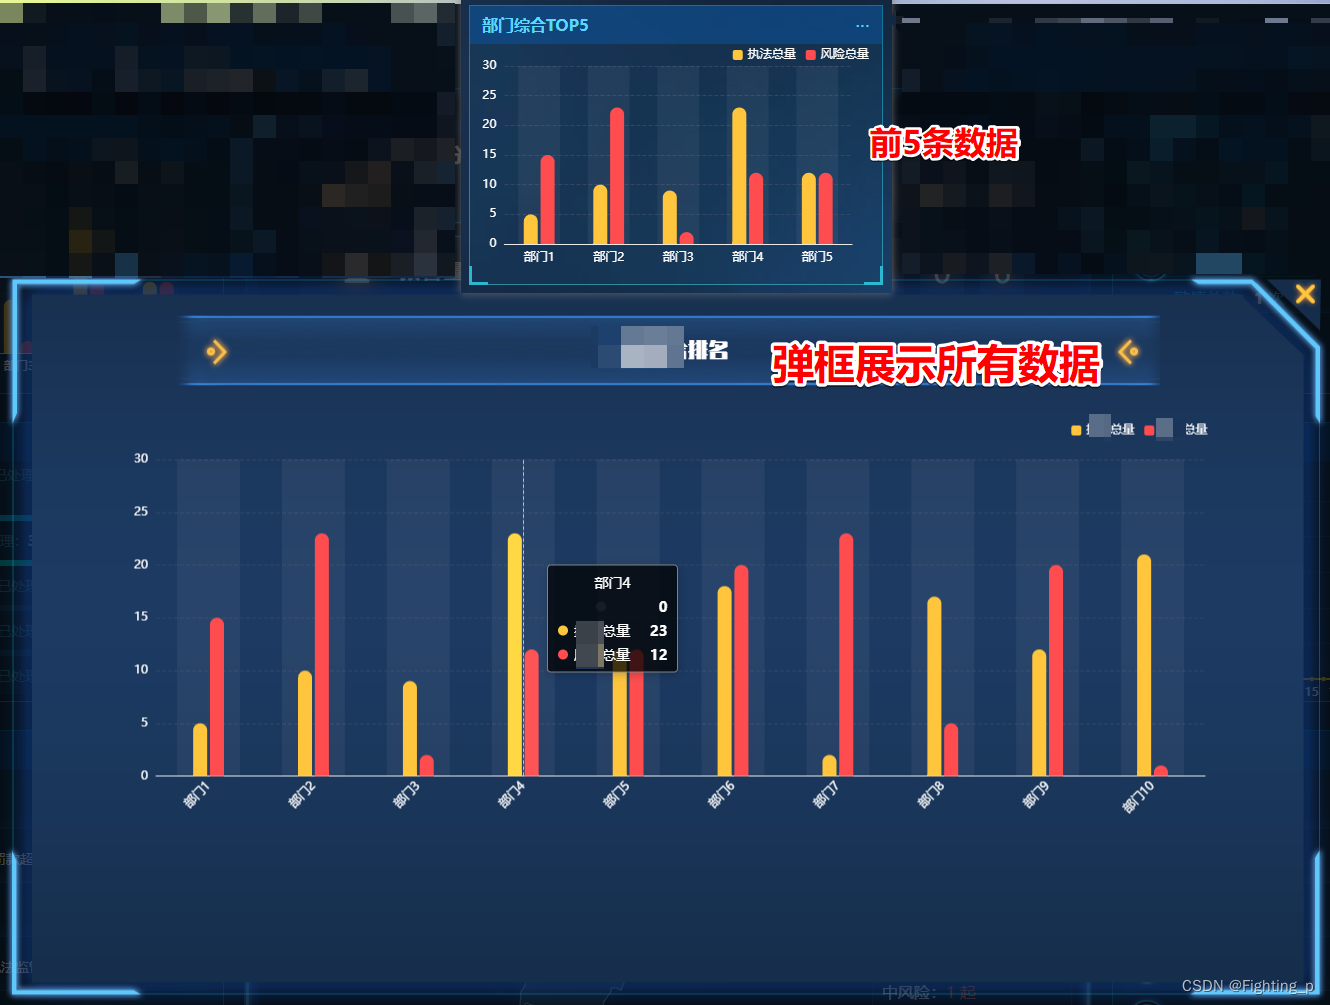
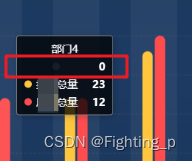
3.2 tooltip 中展示内容自定义
效果图

代码
tooltip: {
  trigger: 'axis',
  backgroundColor: 'rgba(0, 0, 0, 0.75)',
  color: '#fff',
  borderWidth: '1',
  borderColor: 'gray',
  textStyle: {
    color: '#fff'
  },
  renderMode: 'html',
  // extraCssText: 'box-shadow: 0px 2px 8px rgba(0, 0, 0, 0.15);text-align:left;',
  formatter(params) {
    return `
        <div style="text-align: center;">${params[0].axisValueLabel}</div>
        <div style="text-align: left;">
          <span style="display:inline-block;width:10px;height:10px;border-radius: 50%;background: #ffc53d;"></span>
          执法总量 ${params[1].value}
        </div>
        <div style="text-align: left;">
          <span style="display:inline-block;width:10px;height:10px;border-radius: 50%;background: #ff4d4f;"></span>
          风险总量 ${params[2].value}
        </div>
      `
  }
},


 2775
2775


 被折叠的 条评论
为什么被折叠?
被折叠的 条评论
为什么被折叠?
 到【灌水乐园】发言


