this.option = {
legend: {
orient: 'vertical',
right: 1,
top: 'center'
},//设置图例的排列方向
tooltip: {},
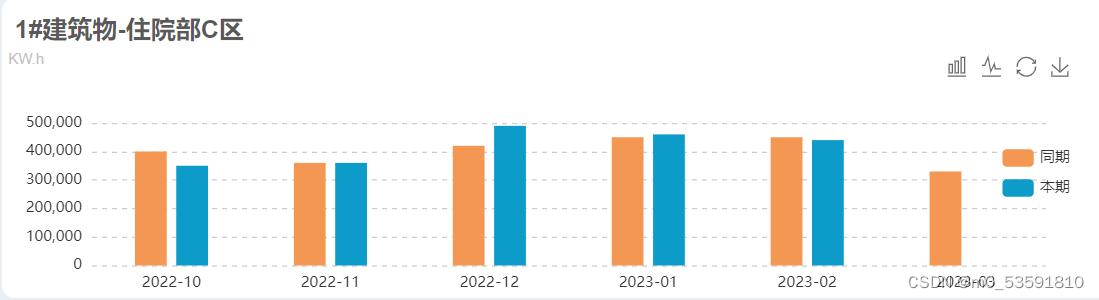
dataset: {
dimensions: ['product', '同期', '本期'],
source: [
{ product: '2022-10', 同期: 400000, 本期: 350000, },
{ product: '2022-11', 同期: 360000, 本期: 360000, },
{ product: '2022-12', 同期: 420000, 本期: 490000, },
{ product: '2023-01', 同期: 450000, 本期: 460000, },
{ product: '2023-02', 同期: 450000, 本期: 440000, },
{ product: '2023-03', 同期: 330000, 本期: 0, }
]
},
grid: {
show: false,
// top:'2%',
left: '1%',
right: '3%',
bottom: '3%',
containLabel: true
},
toolbox: {
feature: {
// dataView: { show: true, readOnly: false },
magicType: { show: true, type: ['bar', 'line'] },
restore: { show: true },
saveAsImage: { show: true }
}
},
xAxis: {
type: 'category',
// data: optionName,
axisTick: {
show: false,
alignWithLabel: false,
lineStyle: {
type: "dashed"
}
},
axisLine: {
show: false
},
},
yAxis: {
type: 'value',
axisTick: {
show: false,
},
splitLine: {
show: true,
lineStyle: {
type: 'dashed'
}
},
axisLine: { show: false },//y轴刻度线
},
// Declare several bar series, each will be mapped
// to a column of dataset.source by default.
series: [
{ type: 'bar',
barWidth: '20%',
itemStyle: {
color: '#f49752',
}//设置柱状图的颜色
},
{
type: 'bar' ,
barWidth: '20%',
itemStyle: {
color: '#0d9cc9',
}
},
]
}


 1万+
1万+


 被折叠的 条评论
为什么被折叠?
被折叠的 条评论
为什么被折叠?
 到【灌水乐园】发言


