


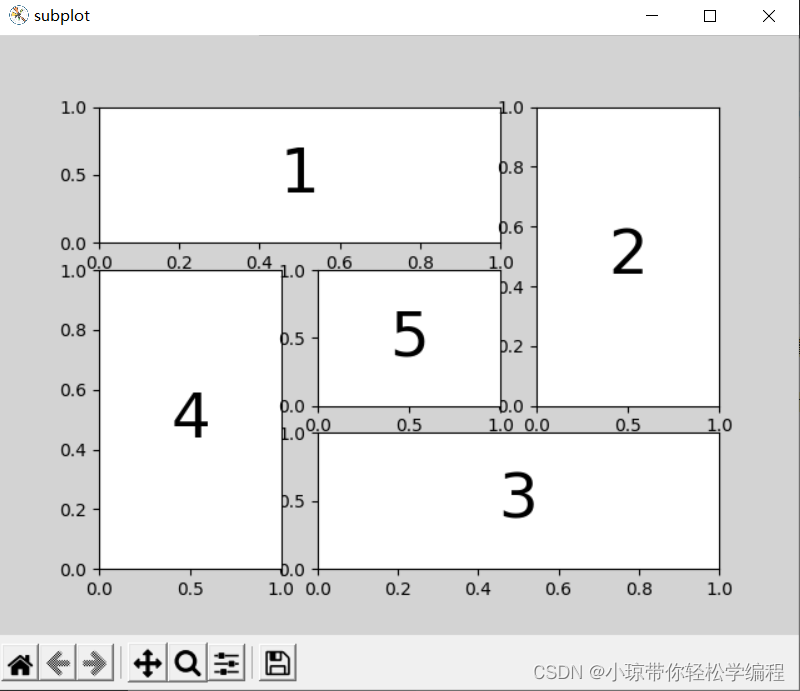
今天来教大家画下图不规则的图片。
理论思想:首先可以从图中初步看出它是一个3*3的网格,使用mp.GridSpec(3, 3)来定义3*3的网格,再使用mp.subplot(gs[0, :2])来展示网格中x轴为0,y轴为0、1即图中数字1的位置,依此展示1到5这些数字的位置。


导入所需要的matplotlib库
import matplotlib.pyplot as mp

定义画布的名称
mp.figure("subplot", facecolor='lightgray')

定义网格大小
gs = mp.GridSpec(3, 3)

使用mp.subplot来依此展示1~5的数字图
mp.subplot(gs[0, :2])#数字1的位置是x轴为0 y轴为0 1
mp.text(0.5, 0.5, 1, size=36,
        ha='center', va='center')

mp.subplot(gs[0:2, 2])#数字2的位置是x轴为0 1 y轴为0 2
mp.text(0.5, 0.5, 2, size=36,
        ha='center', va='center')

mp.subplot(gs[2, 1:])#数字3的位置是x轴为2 y轴为1 2
mp.text(0.5, 0.5, 3, size=36,
        ha='center', va='center')

mp.subplot(gs[1:, 0])#数字4的位置是x轴为1 2 y轴为0
mp.text(0.5, 0.5, 4, size=36,
        ha='center', va='center')

mp.subplot(gs[1, 1])#数字5的位置是x轴为1 y轴为 1
mp.text(0.5, 0.5, 5, size=36,
        ha='center', va='center')

将图片展示出来
mp.show()
通过简单的几行代码即可自定义展示所需的图片了,如果需要修改展示的内容可将展示的内容与对应的mp.text()替换
全部代码如下:
import matplotlib.pyplot as mp

mp.figure("subplot", facecolor='lightgray')

gs = mp.GridSpec(3, 3)
mp.subplot(gs[0, :2])
mp.text(0.5, 0.5, 1, size=36,
        ha='center', va='center')
mp.subplot(gs[2, 1:])
mp.text(0.5, 0.5, 3, size=36,
        ha='center', va='center')
mp.subplot(gs[0:2, 2])
mp.text(0.5, 0.5, 2, size=36,
        ha='center', va='center')
mp.subplot(gs[1:, 0])
mp.text(0.5, 0.5, 4, size=36,
        ha='center', va='center')
mp.subplot(gs[1, 1])
mp.text(0.5, 0.5, 5, size=36,
        ha='center', va='center')
mp.show()


 846
846


 被折叠的 条评论
为什么被折叠?
被折叠的 条评论
为什么被折叠?
 到【灌水乐园】发言


