


性能指标
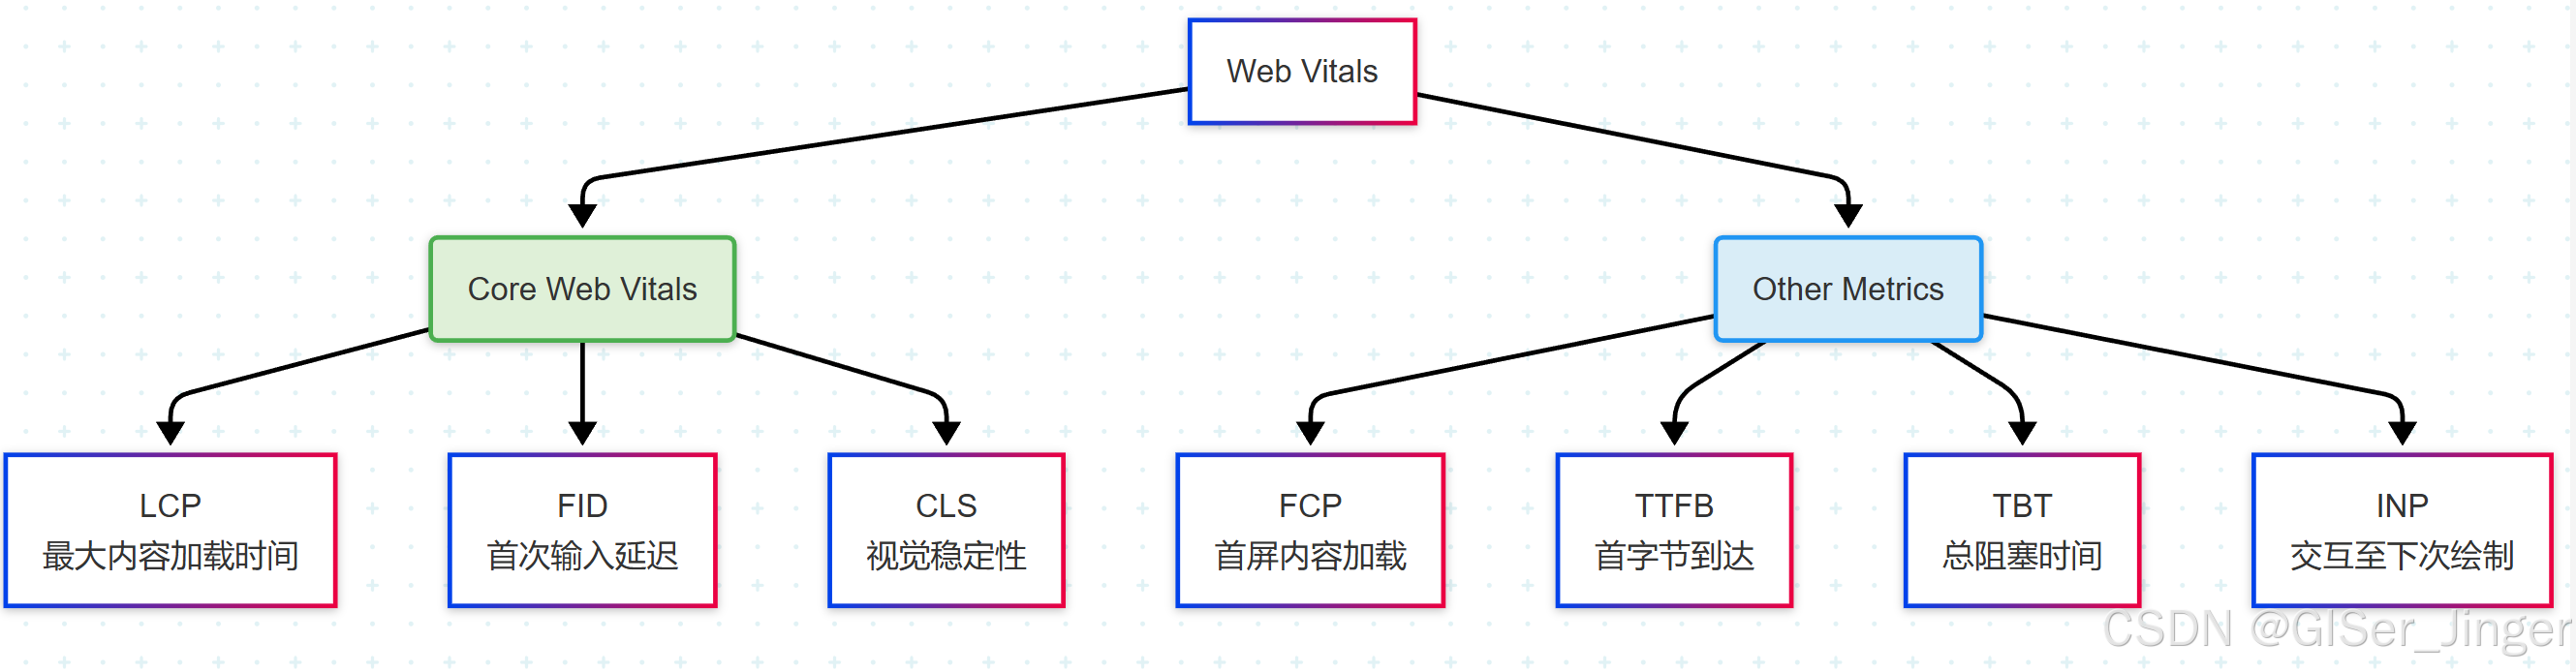
在实现性能监控前,先了解Web Vitals涉及的常见的性能指标
Web Vitals 是由 Google 推出的网页用户体验衡量指标体系,旨在帮助开发者量化和优化网页在实际用户终端上的性能体验。Web Vitals 强调“以用户为中心”的度量,而不是纯技术层面的加载时间。
要按 先后顺序(时间维度) 梳理 Web Vitals,可以从网页加载的生命周期出发,把每个指标放入其发生时机对应的阶段中。这样更利于理解用户体验的演变和指标采集的逻辑。
🧭 一、加载过程的五大阶段
[1] 网络响应阶段
[2] 首次渲染阶段
[3] 内容加载阶段
[4] 用户交互阶段
[5] 页面稳定阶段
📊 二、Web Vitals 指标按时间顺序梳理
| 阶段 | 指标名 | 含义 | 时机 |
|---|---|---|---|
| 1️⃣ 网络响应 | TTFB (Time to First Byte) | 首字节到达 | 浏览器请求后,接收到第一个响应字节 |
| 2️⃣ 首次渲染 | FCP (First Contentful Paint) | 首次绘制文字/图像 | 页面开始有内容渲染(非白屏) |
| 3️⃣ 主内容加载 | LCP (Largest Contentful Paint) | 最大可视内容渲染完成 | 用户感知“页面加载完” |
| 4️⃣ 用户首次交互 | FID (First Input Delay) | 用户首次点击的响应延迟 | 用户第一次交互,直到浏览器处理事件的延迟 |
| 5️⃣ 页面稳定 | CLS (Cumulative Layout Shift) | 布局跳动 | 页面是否因为图片/广告等加载而抖动 |
🧬 三、时间线图(逻辑顺序)
时间单位为毫秒。
TTFB最早,CLS贯穿整个加载过程。
🔁 四、简洁记忆顺序口诀
💡「先 TTFB,见 FCP;看大图,用 LCP;首操作,测 FID;别乱跳,查 CLS」
🛠 五、指标采集时机小贴士
| 指标 | 采集方式 | 推荐 API |
|---|---|---|
| TTFB | performance.timing.responseStart - navigationStart | Navigation Timing |
| FCP | PerformanceObserver 监听 paint | PerformancePaintTiming |
| LCP | PerformanceObserver 监听 largest-contentful-paint | LCP Entry |
| FID | 真实用户交互产生的事件延迟 | Event Timing API |
| CLS | PerformanceObserver 监听 layout-shift | LayoutShift Entry |
🧭 六、总结为时序流图(Mermaid)
指标监控
PerformanceObserver
PerformanceObserver 是 Performance API 中用于监听性能条目变化的核心工具。它可以在网页运行过程中,异步捕获新生成的性能条目,而不是一开始就调用 performance.getEntries() 拿“旧数据”。
一、PerformanceObserver 的作用
它允许开发者:
- 监听网页运行中
出现的性能条目(如资源加载、绘制、打点、长任务等) 做出动态响应(如打日志、发送埋点数据)- 支持指定监听的
entryTypes,如["resource"],["mark", "measure"]
二、使用方式
1. 创建实例
const observer = new PerformanceObserver((list, observer) => {
  const entries = list.getEntries();
  for (const entry of entries) {
    console.log(entry.name, entry.entryType, entry.startTime, entry.duration);
  }
});
2. 启动监听
observer.observe({
  entryTypes: ['mark', 'measure', 'resource']
});
entryTypes是监听的条目类型数组。
三、常用方法
| 方法 | 说明 |
|---|---|
observe(options) | 开始监听性能条目 |
disconnect() | 停止监听 |
takeRecords() | 获取当前缓冲区的所有性能条目并清空缓冲区 |
四、选项说明
observe(options)
observer.observe({
  entryTypes: ['resource', 'paint']
});
或使用过时写法(不推荐):
observer.observe({
  type: 'resource',
  buffered: true
});
参数说明:
entryTypes: 性能条目的类型(推荐)type: 单一类型(不推荐)buffered: 是否包括已存在的历史条目(true会包含之前的记录)
五、支持的 entryType(性能条目类型)
| 类型 | 含义 |
|---|---|
resource | 外部资源加载耗时 |
mark | 用户自定义打点 |
measure | 用户定义的测量点 |
paint | 首次绘制(first-paint, first-contentful-paint) |
navigation | 页面导航 |
longtask | 长任务(如 JS 卡顿) |
element | 关键可视元素曝光(需要配置) |
largest-contentful-paint | 最大内容绘制时间 |
layout-shift | 布局偏移(CLS) |
六、典型使用场景
- 监听
资源加载情况(如 img、script) - 监听
FCP、LCP、CLS、Long Tasks,用于Web Vitals 性能分析 - 异步
获取自定义打点结果 - 在 SPA 页面做
性能埋点
七、注意事项
PerformanceObserver是异步的:不会立即收到记录。- 使用
buffered: true可获取已经发生的记录(旧数据),用于首次加载打点。 - 页面进入后台或关闭时,需要调用
takeRecords()收集剩余数据。 - 一些条目需要在支持的浏览器中开启对应实验性特性(如
longtask)。
八、Mermaid 类图详解 PerformanceObserver
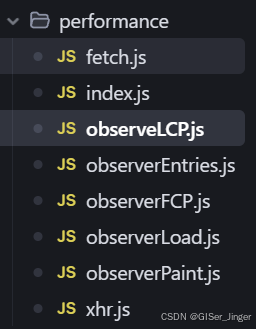
九、具体实现
import { lazyReportBatch } from '../report';
const originalFetch = window.fetch;
function overwriteFetch() {
    window.fetch = function  newFetch(url, config) {
        const startTime = Date.now();
        const reportData = {
            type: 'performance',
            subType: 'fetch',
            url,
            startTime,
            method: config.method,
        }
        return originalFetch(url, config).then((res) => {
            const endTime = Date.now();
            reportData.endTime = endTime;
            reportData.duration = endTime - startTime;
            const data = res.clone();
            reportData.status = data.status;
            reportData.success = data.ok;
            // todo 上报数据
            lazyReportBatch(reportData);
            return res;
        }).catch((err) => {
            const endTime = Date.now();
            reportData.endTime = endTime;
            reportData.duration = endTime - startTime;
            reportData.status = 0;
            reportData.success = false;
            // todo 上报数据
            lazyReportBatch(reportData);
        });
    }
}
export default function fetch() {
    overwriteFetch();
}
//监控FP
import { lazyReportBatch } from '../report';
export default function observerPaint() {
    const entryHandler = (list) => {
        for (const entry of list.getEntries()) {
            if (entry.name === 'first-paint') {
                observer.disconnect();
                const json = entry.toJSON();
                console.log(json);
                const reportData = {
                    ...json,
                    type: 'performance',
                    subType: entry.name,
                    pageUrl: window.location.href,
                }
                // 发送数据 todo;
                lazyReportBatch(reportData);
            }
        }

    }
    // 统计和计算fp的时间
    const observer = new PerformanceObserver(entryHandler);
    // buffered: true 确保观察到所有paint事件
    observer.observe({type: 'paint', buffered: true});


}
//监控FCP
import { lazyReportBatch } from '../report';
export default function observerFCP() {
    const entryHandler = (list) => {
        for (const entry of list.getEntries()) {
            if (entry.name === 'first-contentful-paint') {
                observer.disconnect();
                const json = entry.toJSON();
                console.log(json);
                const reportData = {
                    ...json,
                    type: 'performance',
                    subType: entry.name,
                    pageUrl: window.location.href,
                }
                // 发送数据 todo;
                lazyReportBatch(reportData);
            }
        }

    }
    // 统计和计算fcp的时间
    const observer = new PerformanceObserver(entryHandler);
    // buffered: true 确保观察到所有paint事件
    observer.observe({type: 'paint', buffered: true});
}
//监控LCP
import { lazyReportBatch } from '../report';
export default function observerLCP() {
    if (
        typeof PerformanceObserver === 'undefined' ||
        !PerformanceObserver.supportedEntryTypes.includes('largest-contentful-paint')
      ) {
        console.warn('LCP not supported in this browser.');
        return;
      }
    const entryHandler = (list,observer) => {
        if (observer) {
            observer.disconnect();
        }
        for (const entry of list.getEntries()) {
            const json = entry.toJSON();
            //console.log(json);
            const reportData = {
                ...json,
                type: 'performance',
                subType: entry.name,
                pageUrl: window.location.href,
            }
            console.log(reportData);
            // 发送数据 todo;
            //lazyReportBatch(reportData);
        }

    }
    // 统计和计算lcp的时间
    const observer = new PerformanceObserver(entryHandler);
    // buffered: true 确保观察到所有paint事件
    observer.observe({type: 'largest-contentful-paint', buffered: true});
}
import { lazyReportBatch } from '../report';
export default function observerLoad () {
    window.addEventListener('pageShow', function (event) {
        requestAnimationFrame(() =>{
            ['load'].forEach((type) => {
                const reportData = {
                    type: 'performance',
                    subType: type,
                    pageUrl: window.location.href,
                    startTime: performance.now()- event.timeStamp
                }
                // 发送数据
                lazyReportBatch(reportData);
            });

        }, true);
    });
}


import { lazyReportBatch } from '../report';
export const originalProto = XMLHttpRequest.prototype;
export const originalSend = originalProto.send;
export const originalOpen = originalProto.open;

function overwriteOpenAndSend() {
    originalProto.open = function newOpen(...args) {
        this.url = args[1];
        this.method = args[0];
        originalOpen.apply(this, args);

    }
    originalProto.send = function newSend(...args) {
        this.startTime = Date.now();
        const onLoaded = () => {
            this.endTime = Date.now();
            this.duration = this.endTime - this.startTime;
            const { url, method , startTime, endTime, duration, status} = this;
            const reportData = {
                status,
                duration,
                startTime,
                endTime,
                url,
                method: method.toUpperCase(),
                type: 'performance',
                success: status >= 200 && status < 300,
                subType: 'xhr'
            }
            // todo 发送数据
            lazyReportBatch(reportData);
            this.removeEventListener('loadend', onLoaded, true);
        }
        this.addEventListener('loadend', onLoaded, true);
        originalSend.apply(this, args);

    }

}
export default function xhr() {
    overwriteOpenAndSend();
}
十、其他实现:Web Vitals
其他实现:Web Vitals 是 Google 提出的一组衡量网站用户体验关键质量的指标,特别关注 加载性能、交互响应、视觉稳定性。
监控上报(⭐)
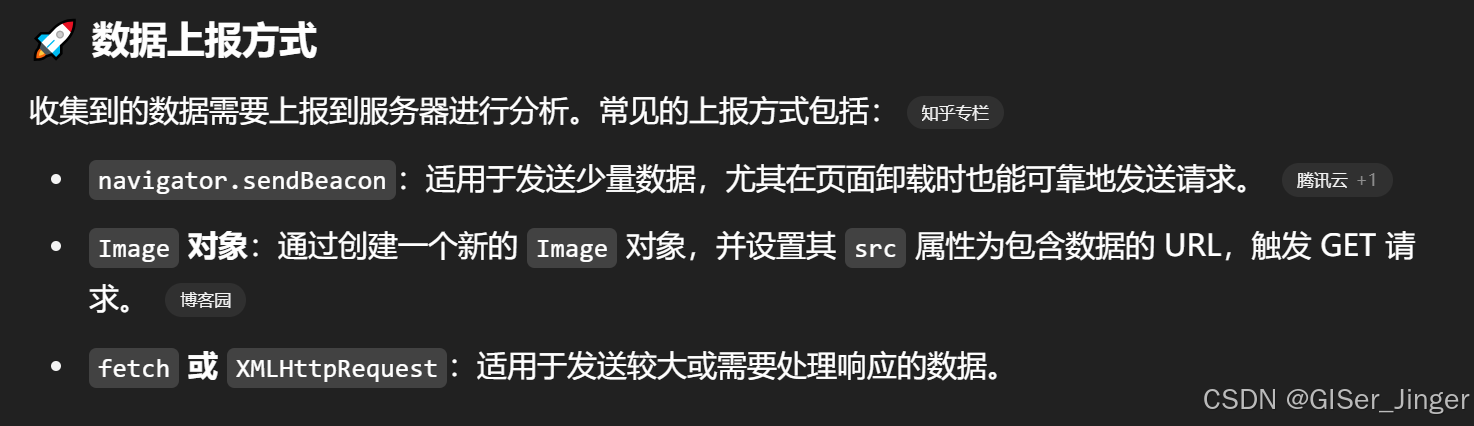
数据上报
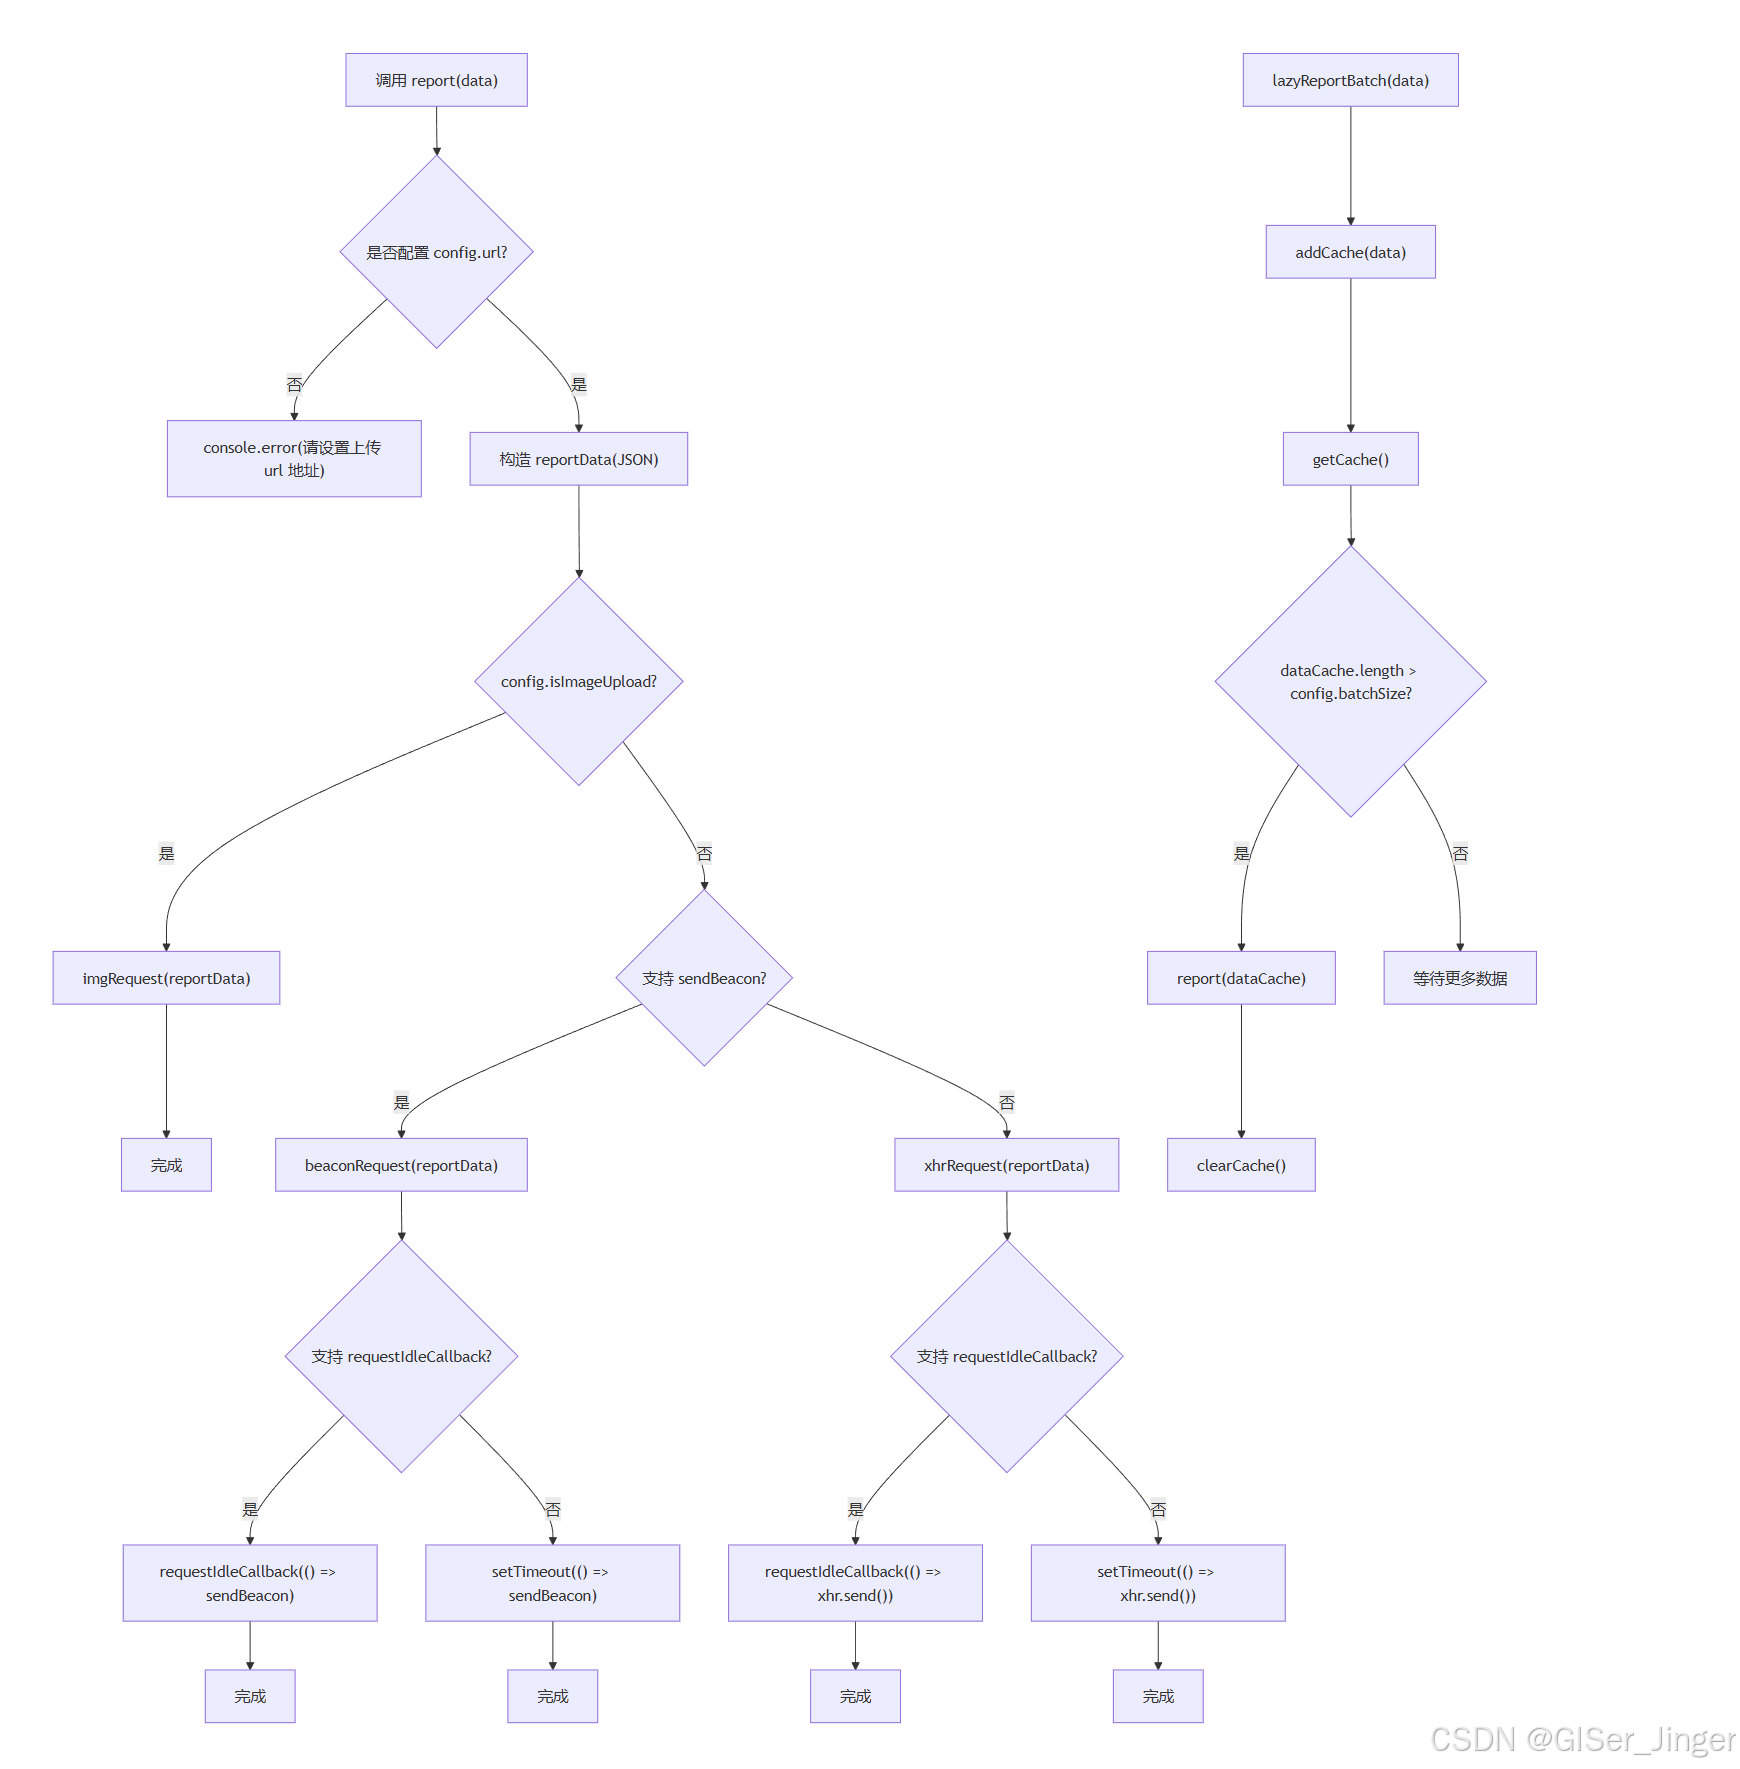
有三种上报方式:
- imgRequest:以
图片打点的方式 - beaconRequest:通过
navigator.sendBeacon发送 - xhrRequest:使用
XMLHttpRequest(兼容方式)
如果使用 lazyReportBatch,则会缓存数据并按批量上传。多数请求都通过 requestIdleCallback 实现性能友好的空闲发送。
import config from './config';
import {generateUniqueId} from './utils';
import {addCache, getCache, clearCache} from './cache';
export const originalProto = XMLHttpRequest.prototype;
export const originalOpen = XMLHttpRequest.prototype.open;
export const originalSend = XMLHttpRequest.prototype.send;
export function isSupportSendBeacon() {
    return 'sendBeacon' in navigator;
}
export function report(data) {
    if (!config.url) {
        console.error('请设置上传 url 地址');
    }
    const reportData = JSON.stringify({
        id: generateUniqueId(),
        data,
    });
    // 上报数据,使用图片的方式
    if (config.isImageUpload) {
        imgRequest(reportData);
    } else {
        // 优先使用 sendBeacon
        if (window.navigator.sendBeacon) {
            return beaconRequest(reportData);
        } else {
            xhrRequest(reportData);
        }
    }
}
// 批量上报数据
export function lazyReportBatch(data) {
    addCache(data);
    const dataCache = getCache();
    console.log('dataCache', dataCache);
    if (dataCache.length && dataCache.length > config.batchSize) {
        report(dataCache);
        clearCache();
    }
    //
}
// 图片发送数据
export function imgRequest(data) {
    const img = new Image();
    // http://127.0.0.1:8080/api?data=encodeURIComponent(data)
    img.src = `${config.url}?data=${encodeURIComponent(JSON.stringify(data))}`;
}
// 普通ajax发送请求数据
export function xhrRequest(data) {
    if (window.requestIdleCallback) {
        window.requestIdleCallback(
            () => {
                const xhr = new XMLHttpRequest();
                originalOpen.call(xhr, 'post', config.url);
                originalSend.call(xhr, JSON.stringify(data));
            },
            { timeout: 3000 }
        );
    } else {
        setTimeout(() => {
            const xhr = new XMLHttpRequest();
            originalOpen.call(xhr, 'post', url);
            originalSend.call(xhr, JSON.stringify(data));
        });
    }
}

// const sendBeacon = isSupportSendBeacon() ? navigator.sendBeacon : xhrRequest
export function beaconRequest(data) {
    if (window.requestIdleCallback) {
        window.requestIdleCallback(
            () => {
                window.navigator.sendBeacon(config.url, data);
            },
            { timeout: 3000 }
        );
    } else {
        setTimeout(() => {
            window.navigator.sendBeacon(config.url, data);
        });
    }
}
Lighthouse
Lighthouse 是 Google 提供的一个开源自动化网站审计工具,主要用于评估 Web 页面在性能、可访问性、最佳实践、SEO 和 PWA(渐进式 Web 应用)等方面的表现。它可以直接在 Chrome 浏览器的 DevTools(开发者工具)中使用,也可以通过 Node.js 命令行运行,甚至集成到 CI/CD 流程中。
下面是对 Lighthouse 工具的详解:
🔧 一、Lighthouse 使用方式
1. Chrome DevTools 中使用
- 打开 Chrome 浏览器
- 按 F12 或右键 → 检查,打开开发者工具
- 切换到 “Lighthouse” 标签页
- 选择你要评估的维度(Performance、Accessibility、Best Practices、SEO、PWA)
- 选择设备类型(Mobile 或 Desktop)
- 点击 “Analyze page load” 开始分析
2. 命令行工具
安装 Node.js 后执行:
npm install -g lighthouse
lighthouse https://example.com --view
📊 二、Lighthouse 的评估维度详解
1. 📈 Performance(性能)
评估页面加载速度和交互体验。核心指标包括:
- First Contentful Paint (FCP):首屏内容出现时间
- Largest Contentful Paint (LCP):最大内容元素加载时间
- Speed Index:页面可见内容加载速度
- Time to Interactive (TTI):页面完全可交互的时间
- Total Blocking Time (TBT):页面阻塞时间
- Cumulative Layout Shift (CLS):视觉稳定性变化程度
👉 建议:压缩资源、懒加载图片、使用缓存、减少 JS 体积等
2. ♿ Accessibility(可访问性)
检测网站对残障人士的友好程度:
- 图像是否有合适的
alt标签 - 表单元素是否有标签
- 颜色对比度是否足够
- 使用 ARIA 属性
👉 建议:为每个交互元素提供语义标签、颜色对比度符合标准
3. 📐 Best Practices(最佳实践)
检测网站是否符合现代 Web 开发规范:
- 使用 HTTPS
- 避免使用过时的 API
- 图片格式是否优化
- 是否防止 XSS
👉 建议:尽量使用现代 Web API、安全连接和资源优化策略
4. 🔍 SEO(搜索引擎优化)
评估页面对搜索引擎的友好程度:
- 页面是否有
title、meta description - 使用语义化 HTML 标签
- 页面是否可爬取
- viewport 是否设置
👉 建议:符合基础 SEO 规范,并确保结构良好
5. 📦 Progressive Web App(PWA)
检测是否符合 PWA 应用标准(如可离线使用、安装到桌面):
- 是否注册了 Service Worker
- 是否提供 Web App Manifest
- 是否支持离线缓存
👉 建议:适合构建高可靠性、接近原生体验的 Web 应用场景
📁 三、Lighthouse 报告详解
生成报告后包含如下信息:
- 分数评分:每个维度都是 0-100 分
- 诊断信息:详细列出存在的问题
- 建议改进:如何提升每项得分
- 详细资源信息:如阻塞时间的脚本、加载顺序等
🔄 四、常见优化建议
| 问题 | 建议优化方式 |
|---|---|
| FCP 慢 | 使用 CDN、预加载字体、图片压缩 |
| LCP 慢 | 懒加载、预渲染关键内容 |
| TTI 高 | 减少 JS 文件大小、优化主线程执行时间 |
| CLS 高 | 给图片/iframe 设置固定尺寸,避免动态插入内容 |
🧪 五、集成到 CI/CD 中
可使用 lighthouse-ci 进行自动化测试:
npm install -g @lhci/cli
lhci autorun
可将分数设置为门槛,发布前必须达到指定分值。
🧠 总结
| 模块 | 目的 | 分数建议 |
|---|---|---|
| Performance | 用户体验核心 | ≥90 |
| Accessibility | 对所有用户友好 | ≥90 |
| Best Practices | 遵循标准 | ≥90 |
| SEO | 搜索可见性 | ≥90 |
| PWA | 应用体验 | ≥70(视业务而定) |
六、案例: 个人网站


 被折叠的 条评论
为什么被折叠?
被折叠的 条评论
为什么被折叠?
 到【灌水乐园】发言


