


 本文介绍了如何在Python中通过pip安装matplotlib第三方库,以及如何使用它创建基础图表,包括设置图形标题、坐标轴标签和改变图标样式。
安装
第三方库
终端输入“pip install matplotlib”命令后回车

可视化
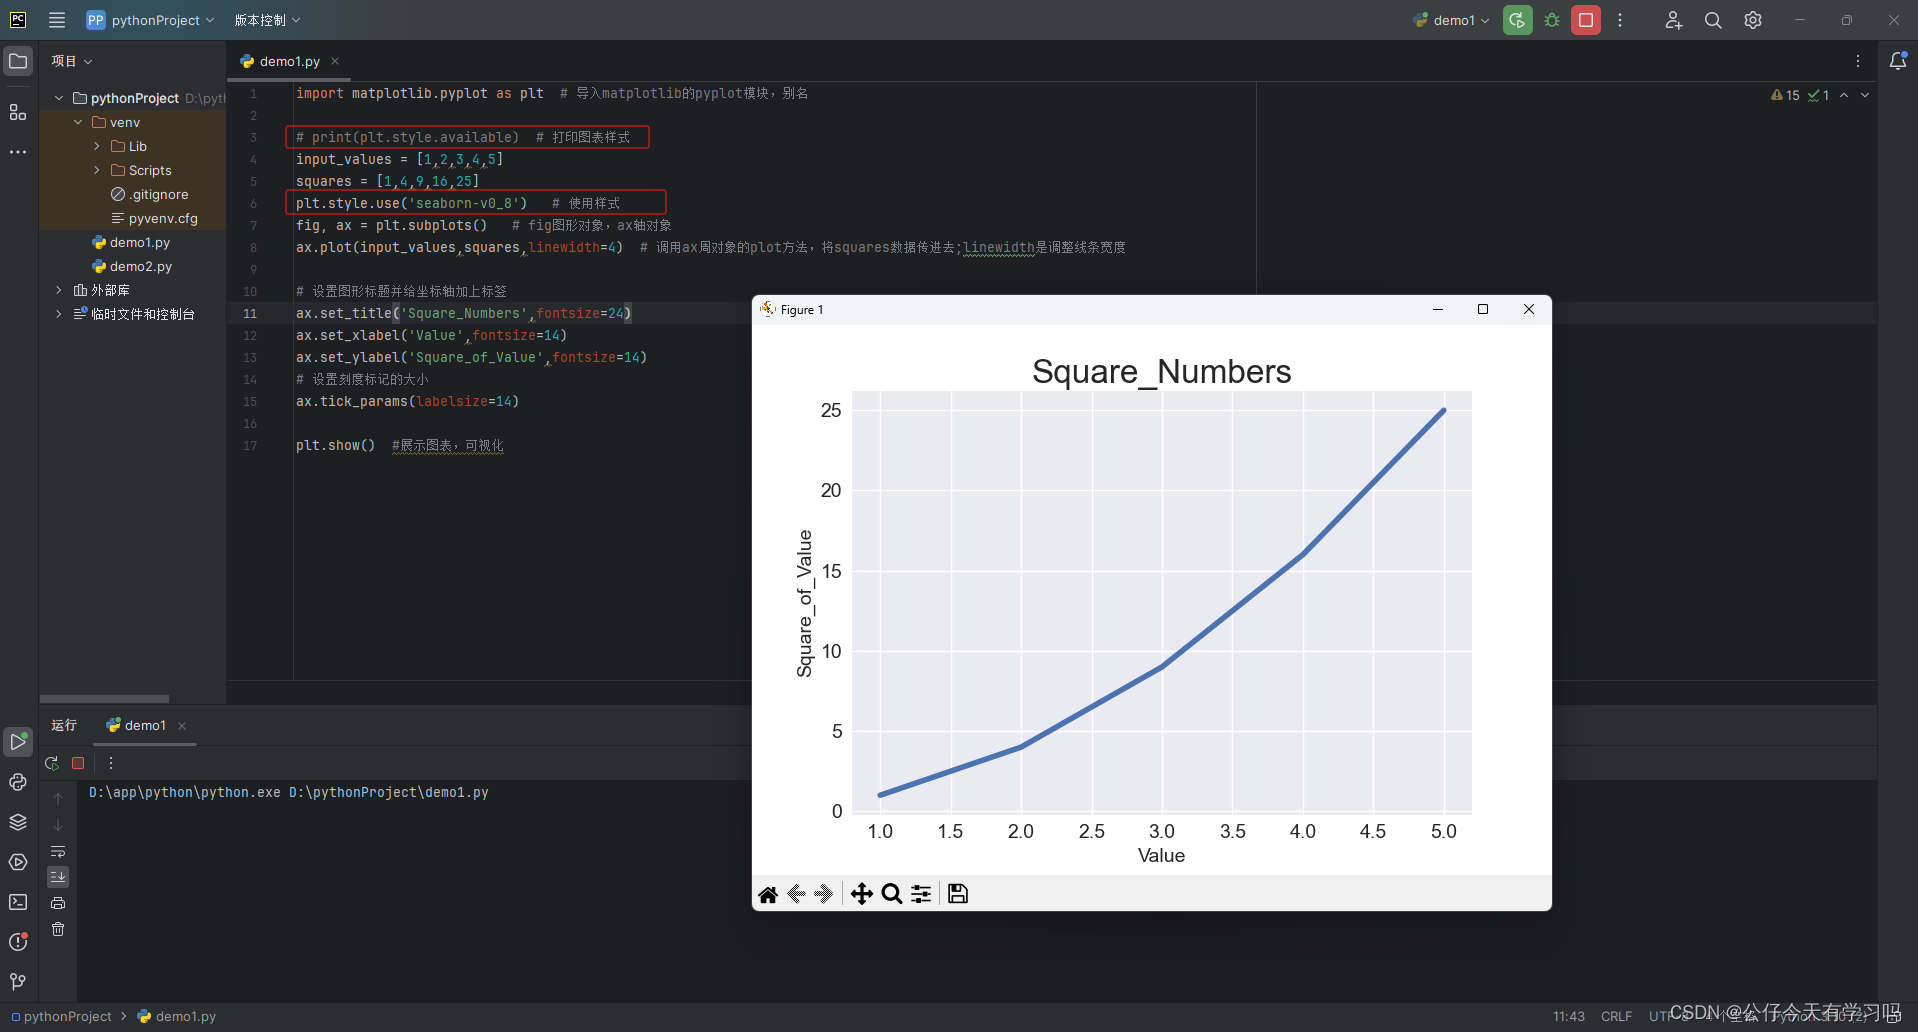
import matplotlib.pyplot as plt  # 导入matplotlib的pyplot模块,别名
input_values = [1,2,3,4,5]
squares = [1,4,9,16,25]
fig, ax = plt.subplots()   # fig图形对象,ax轴对象
ax.plot(input_values,squares,linewidth=4)  # 调用ax周对象的plot方法,将squares数据传进去;linewidth是调整线条宽度

# 设置图形标题并给坐标轴加上标签
ax.set_title('Square_Numbers',fontsize=24)
ax.set_xlabel('Value',fontsize=14)
ax.set_ylabel('Square_of_Value',fontsize=14)
# 设置刻度标记的大小
ax.tick_params(labelsize=14)

plt.show()  #展示图表,可视化

打印图标样式
print(plt.style.available)
# ['Solarize_Light2', '_classic_test_patch', '_mpl-gallery', '_mpl-gallery-nogrid', 'bmh', 'classic', 'dark_background', 'fast', 'fivethirtyeight', 'ggplot', 'grayscale', 'seaborn-v0_8', 'seaborn-v0_8-bright', 'seaborn-v0_8-colorblind', 'seaborn-v0_8-dark', 'seaborn-v0_8-dark-palette', 'seaborn-v0_8-darkgrid', 'seaborn-v0_8-deep', 'seaborn-v0_8-muted', 'seaborn-v0_8-notebook', 'seaborn-v0_8-paper', 'seaborn-v0_8-pastel', 'seaborn-v0_8-poster', 'seaborn-v0_8-talk', 'seaborn-v0_8-ticks', 'seaborn-v0_8-white', 'seaborn-v0_8-whitegrid', 'tableau-colorblind10']
使用图标样式
plt.style.use('_mpl-gallery') # 使用样式


 8万+
8万+


 被折叠的 条评论
为什么被折叠?
被折叠的 条评论
为什么被折叠?
 到【灌水乐园】发言


