


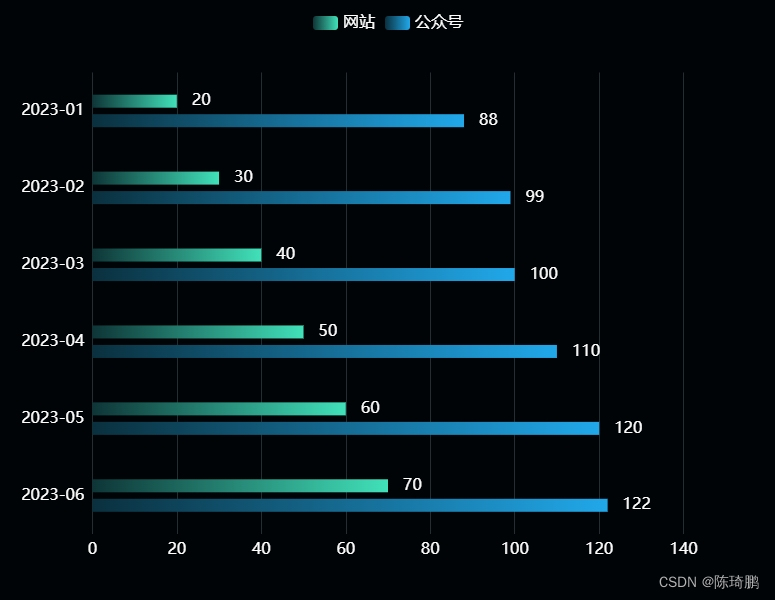
Echarts通用的横向柱状图,根据月份分别统计网站与公众号的数量,两条柱状图很直观,以下是代码示例:
下载Echarts
//npm
npm install echarts --save

//淘宝镜像cnpm(安装速度快)
cnpm install echarts --save

//yarn
yarn add echarts
代码示例
<template>
    <div id="echartsFour" style="width: 100%;height: 100%;"></div>
</template>

<script setup>
    import * as echarts from 'echarts';
    import { onMounted,ref } from 'vue';
    onMounted(()=>{
        getEcharts();
    })
    const getEcharts = () => {
        let chartDom = document.getElementById("echartsFour");
        let myChart = echarts.init(chartDom);
        let dateArr = ["2023-01","2023-02","2023-03","2023-04","2023-05","2023-06"]
        let wzArr = [20,30,40,50,60,70]
      let gzhArr = [88,99,100,110,120,122]
      let option = {
            backgroundColor:"#010407",
      	grid: {
      		left: '12%',
      		right: '12%',
      		top: "12%",
      	},
      	legend: {
      		show: true,
      		// itemWidth:52,
      		// itemHeight:30,
      		// itemGap:50,
      		left: "center",
      		top: 10,
      		textStyle: {
      			color: '#fff',
      			fontSize: 16
      		}
      	},
      	"xAxis": {
      		type: 'value',
      		// "max": max,
      		"splitLine": {
      			"show": true,
      			lineStyle: {
      				color: "#232e32"
      			}
      		},
      		"axisLine": {
      			"show": false
      		},
      		"axisLabel": {
      			"show": true,
      			"textStyle": {
      				"color": "#fff",
      				"fontSize": 16
      			}
      		},
      		"axisTick": {
      			"show": false
      		}
      	},
      	"yAxis": [{
      		"type": "category",
      		"inverse": true,
      		"data": dateArr,
      		"axisLine": {
      			"show": false
      		},
      		"axisTick": {
      			"show": false
      		},
      		"axisLabel": {
      			// "margin": 10,
      			"textStyle": {
      				"color": "#fff",
      				"fontSize": 16
      			}
      		}
      	}],
      	"series": [{ //内
      			type: 'bar',
      			barWidth: 13,
      			barGap: 0.5,
      			name: '网站',
      			label: {
      				show: true,
      				position: 'right',
      				textStyle: {
      					color: '#fff',
      					fontSize: 16,
      					padding: [0, 10],
      					rich: {
      						a: {
      							color: '#fff',
      							fontSize: 36
      						}
      					}
      				}
      			},
      			legendHoverLink: false,
      			silent: true,
      			itemStyle: {
      				color: {
      					type: 'linear',
      					x: 0,
      					y: 0,
      					x2: 1,
      					y2: 0,
      					colorStops: [{
      						offset: 0,
      						color: '#0e3537' // 0% 处的颜色
      					}, {
      						offset: 1,
      						color: '#41e1ba' // 100% 处的颜色
      					}],
      					globalCoord: false // 缺省为 false
      				} //底色
      			},
      			data: wzArr
      		},
      		{ //内2
      			type: 'bar',
      			barWidth: 13,
      			name: '公众号',
      			legendHoverLink: false,
      			silent: true,
      			label: {
      				show: true,
      				position: 'right',
      				textStyle: {
      					color: '#fff',
      					padding: [0, 10],
      					fontSize: 16,
      					rich: {
      						a: {
      							color: '#fff',
      							fontSize: 36
      						}
      					}
      				}
      			},
      			itemStyle: {
      				color: {
      					type: 'linear',
      					x: 0,
      					y: 0,
      					x2: 1,
      					y2: 0,
      					colorStops: [{
      						offset: 0,
      						color: '#0a303e' // 0% 处的颜色
      					}, {
      						offset: 1,
      						color: '#21a8ea' // 100% 处的颜色
      					}],
      					globalCoord: false // 缺省为 false
      				} //底色
      			},
      			data: gzhArr
      		}
      	]
      };
        myChart.setOption(option);
    }
</script>
运行结果


 2186
2186

 被折叠的 条评论
为什么被折叠?
被折叠的 条评论
为什么被折叠?
 到【灌水乐园】发言


