


前言
例如:随着大数据的不断发展,hadoop这门技术也越来越重要,很多人都开启了学习大数据之路。此次课程设计,我们采用mongodb作为存储,javaweb作为前端,echarts作为可视化工具,kettle和pandas作为数据清洗工具。使用底层mapeduce作为大数据计算。
一、工具介绍
mongodb数据库:它的特点是高性能、易部署、易使用,存储数据非常方便。主要功能特性有:*面向集合存储,易存储对象类型的数据。*模式自由。*支持动态查询。*支持完全索引,包含内部对象。*支持查询。
javaweb:个人喜好用java,其实最好可以使用node.js。
echarts:可视化工具,包含多个组件,可以说是既简单又方便的工具。
kettle:Pentaho Data Integration以Java开发,支持跨平台运行,其特性包括:支持100%无编码、拖拽方式开发ETL数据管道;可对接包括传统数据库、文件、大数据平台、接口、流数据等数据源;支持ETL数据管道加入机器学习算法。
pandas:python第三方库,对于简单数据是很好用的工具。
二、mapreduce数据处理
1.数据集准备
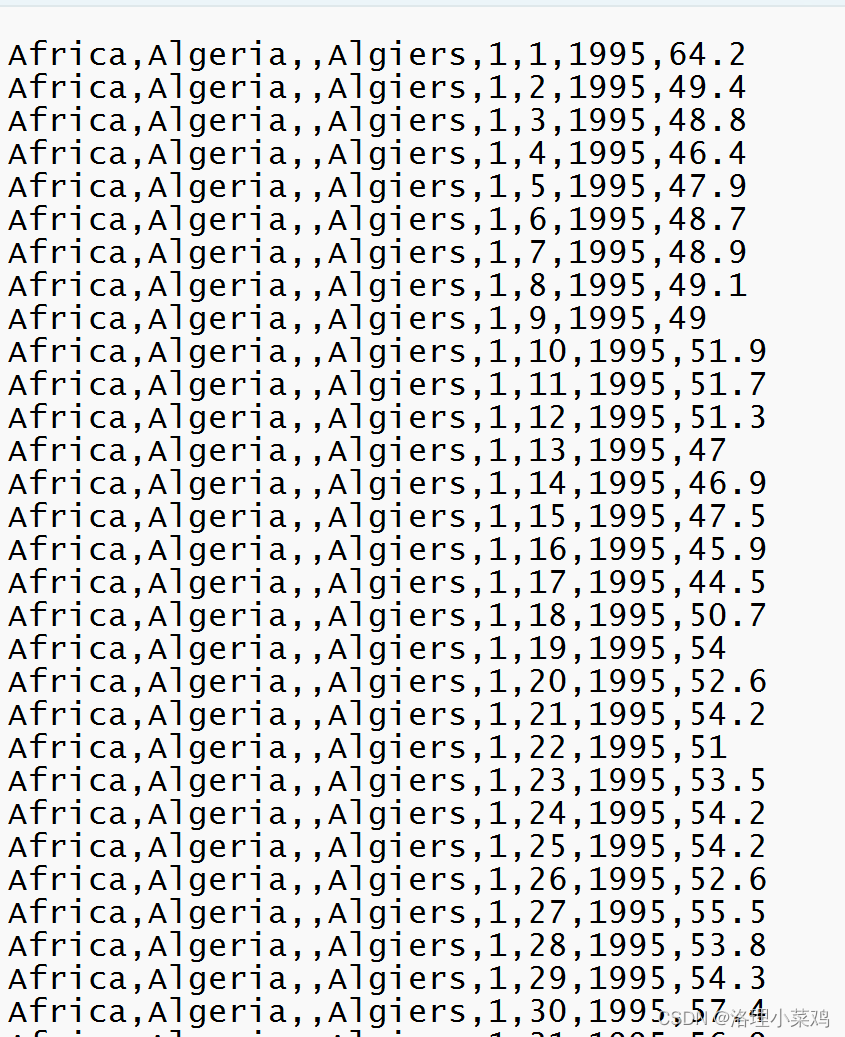
2.要求:对不同洲的平均温度处理--得到各大洲的平均温度
2.1 mapper阶段
import org.apache.hadoop.mapreduce.Mapper;

import java.io.IOException;

/*
要求:对不同洲的平均温度处理--得到各大洲的平均温度
 */
public class TemperMapper extends Mapper<LongWritable, Text,Text,DoubleWritable> {
    Text k = new Text();
    DoubleWritable v = new DoubleWritable();

    @Override
    protected void map(LongWritable key, Text value, Mapper<LongWritable, Text, Text, DoubleWritable>.Context context) throws IOException, InterruptedException {
        String s = value.toString();
        String[] split = s.split(",");
        String sec=split[0]+"\t"+split[6];
        if(!split[7].contains("-99")) {
            k.set(sec);
            v.set(Double.parseDouble(split[split.length - 1]));
            context.write(k, v);
        }
    }
}
2.2 reduce阶段
package test.temperature.TemperatureInfo.Temperature01;

import org.apache.hadoop.io.LongWritable;
import org.apache.hadoop.io.*;
import org.apache.hadoop.mapreduce.Reducer;

import java.io.IOException;

public class TemperReduce extends Reducer<Text, DoubleWritable, Text,DoubleWritable> {

    @Override
    protected void reduce(Text key, Iterable<DoubleWritable> values, Reducer<Text, DoubleWritable, Text, DoubleWritable>.Context context) throws IOException, InterruptedException {
        int num=0;
        double sum=0;
        for (DoubleWritable val:values){
            sum+=val.get();
            num++;
        }
        Double avg= Double.valueOf(sum/num);
        context.write(key,new DoubleWritable(avg));
    }
}
2.3 分区
package test.temperature.TemperatureInfo.Temperature01;

import org.apache.hadoop.io.*;
import org.apache.hadoop.mapreduce.Partitioner;

public class TemperPartitioner extends Partitioner<Text, DoubleWritable> {

    @Override
    public int getPartition(Text text, DoubleWritable doubleWritable, int p) {
        String year_coun = text.toString();

        int partition;
        if ((year_coun).contains("Africa")){
            partition=0;
        }
        else if ((year_coun).contains("Asia")) {
            partition = 1;
        }else if ((year_coun).contains("Australia/South Pacific")) {
            partition = 2;
        }else if ((year_coun).contains("Europe")) {
            partition = 3;
        }else if((year_coun).contains("Middle East")){
            partition=4;
        }else {
            partition=5;
        }

        return partition;
    }
}
2.4 Driver阶段
package test.temperature.TemperatureInfo.Temperature01;
import org.apache.hadoop.conf.Configuration;
import org.apache.hadoop.fs.Path;
import org.apache.hadoop.io.*;
import org.apache.hadoop.mapreduce.Job;
import org.apache.hadoop.mapreduce.lib.input.FileInputFormat;
import org.apache.hadoop.mapreduce.lib.output.FileOutputFormat;

import java.io.IOException;

public class TemperDriver {

    public static void main(String[] args) throws IOException, InterruptedException, ClassNotFoundException {

        // 1 获取配置信息以及获取job对象
        Configuration conf = new Configuration();
        Job job = Job.getInstance(conf);

        // 2 关联本Driver程序的jar
        job.setJarByClass(TemperDriver.class);

        // 3 关联Mapper和Reducer的jar
        job.setMapperClass(TemperMapper.class);
        job.setReducerClass(TemperReduce.class);

        // 4 设置Mapper输出的kv类型
        job.setMapOutputKeyClass(Text.class);
        job.setMapOutputValueClass(DoubleWritable.class);

        // 5 设置最终输出kv类型
        job.setOutputKeyClass(Text.class);
        job.setOutputValueClass(DoubleWritable.class);

        //设置分区--分区与输出是不一样的,输出!=分区
        job.setPartitionerClass(TemperPartitioner.class);
        job.setNumReduceTasks(6);

        // 6 设置输入和输出路径
        FileInputFormat.setInputPaths(job, new Path("D:\\desk\\city_temperature.csv"));
        FileOutputFormat.setOutputPath(job, new Path("D:\\desk\\Temperature\\25年各大洲的平均温度"));


        // 7 提交job
        boolean result = job.waitForCompletion(true);
        System.exit(result ? 0 : 1);
    }
}
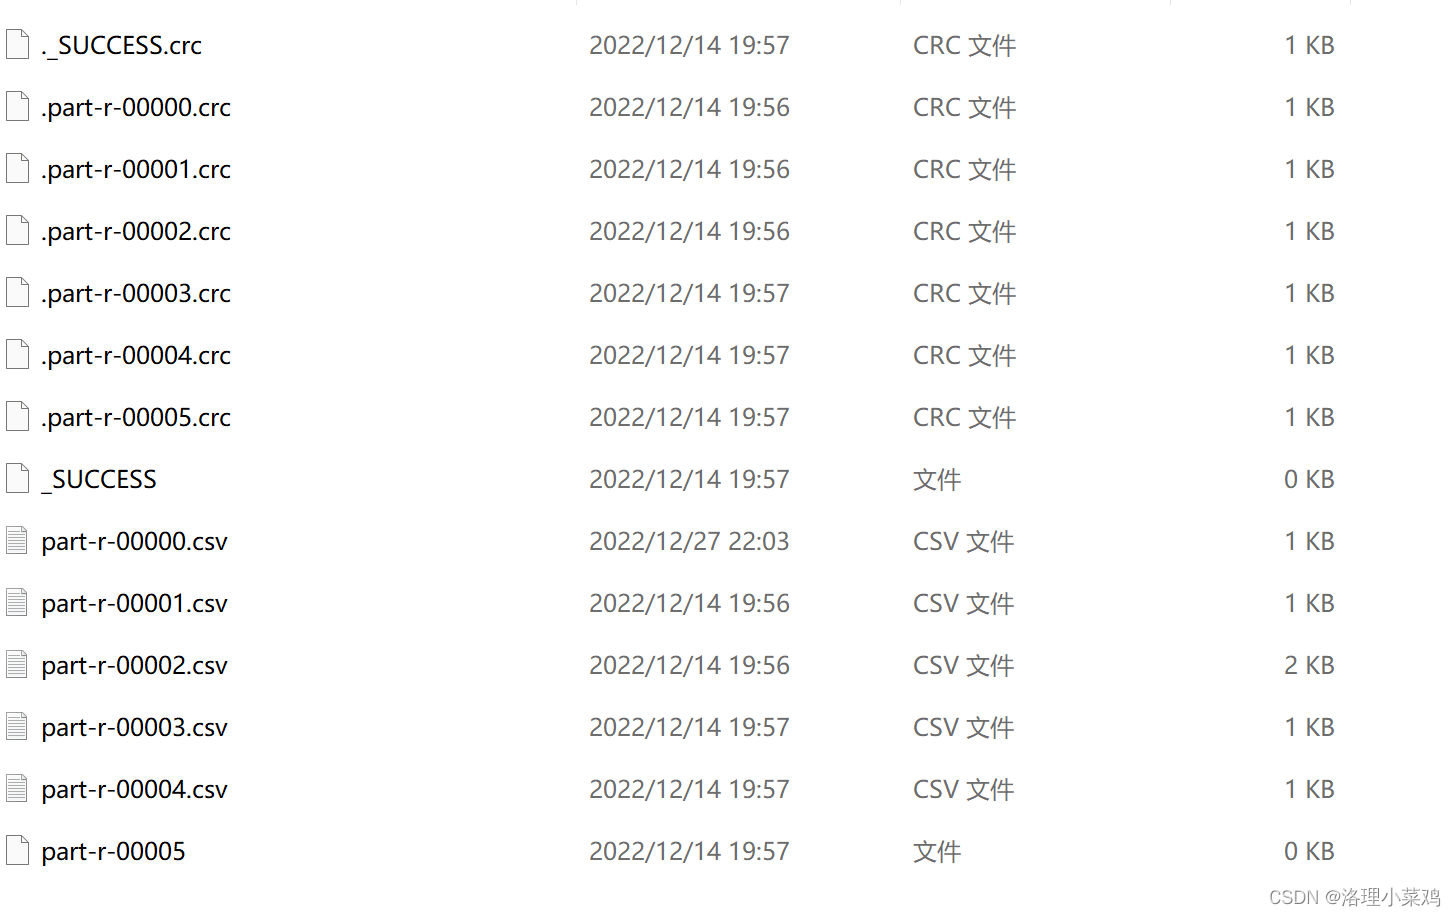
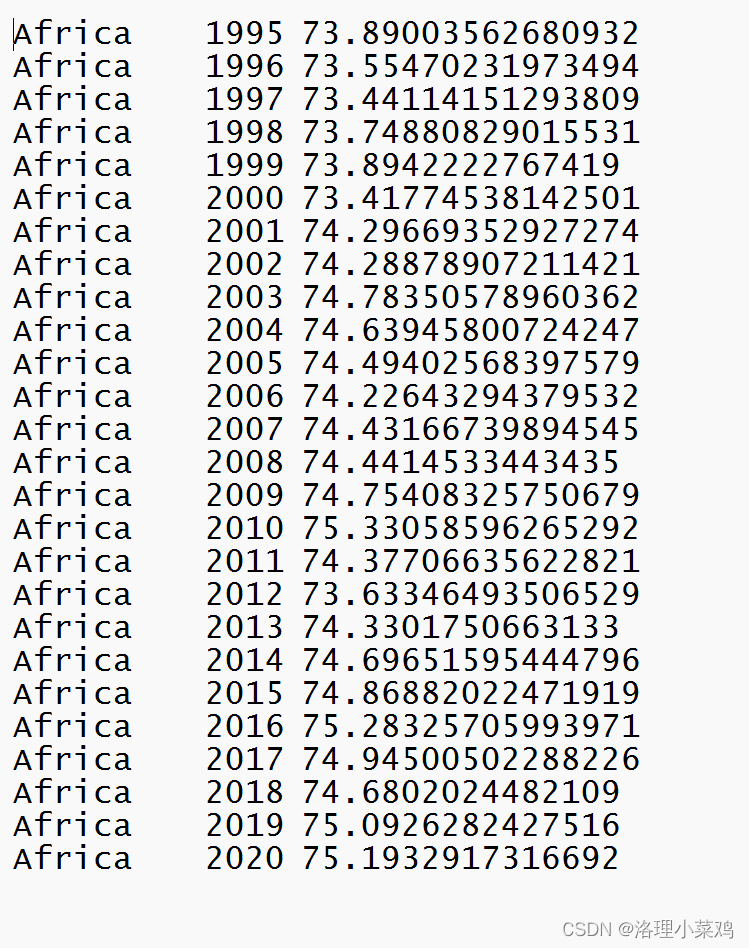
3.结果展示
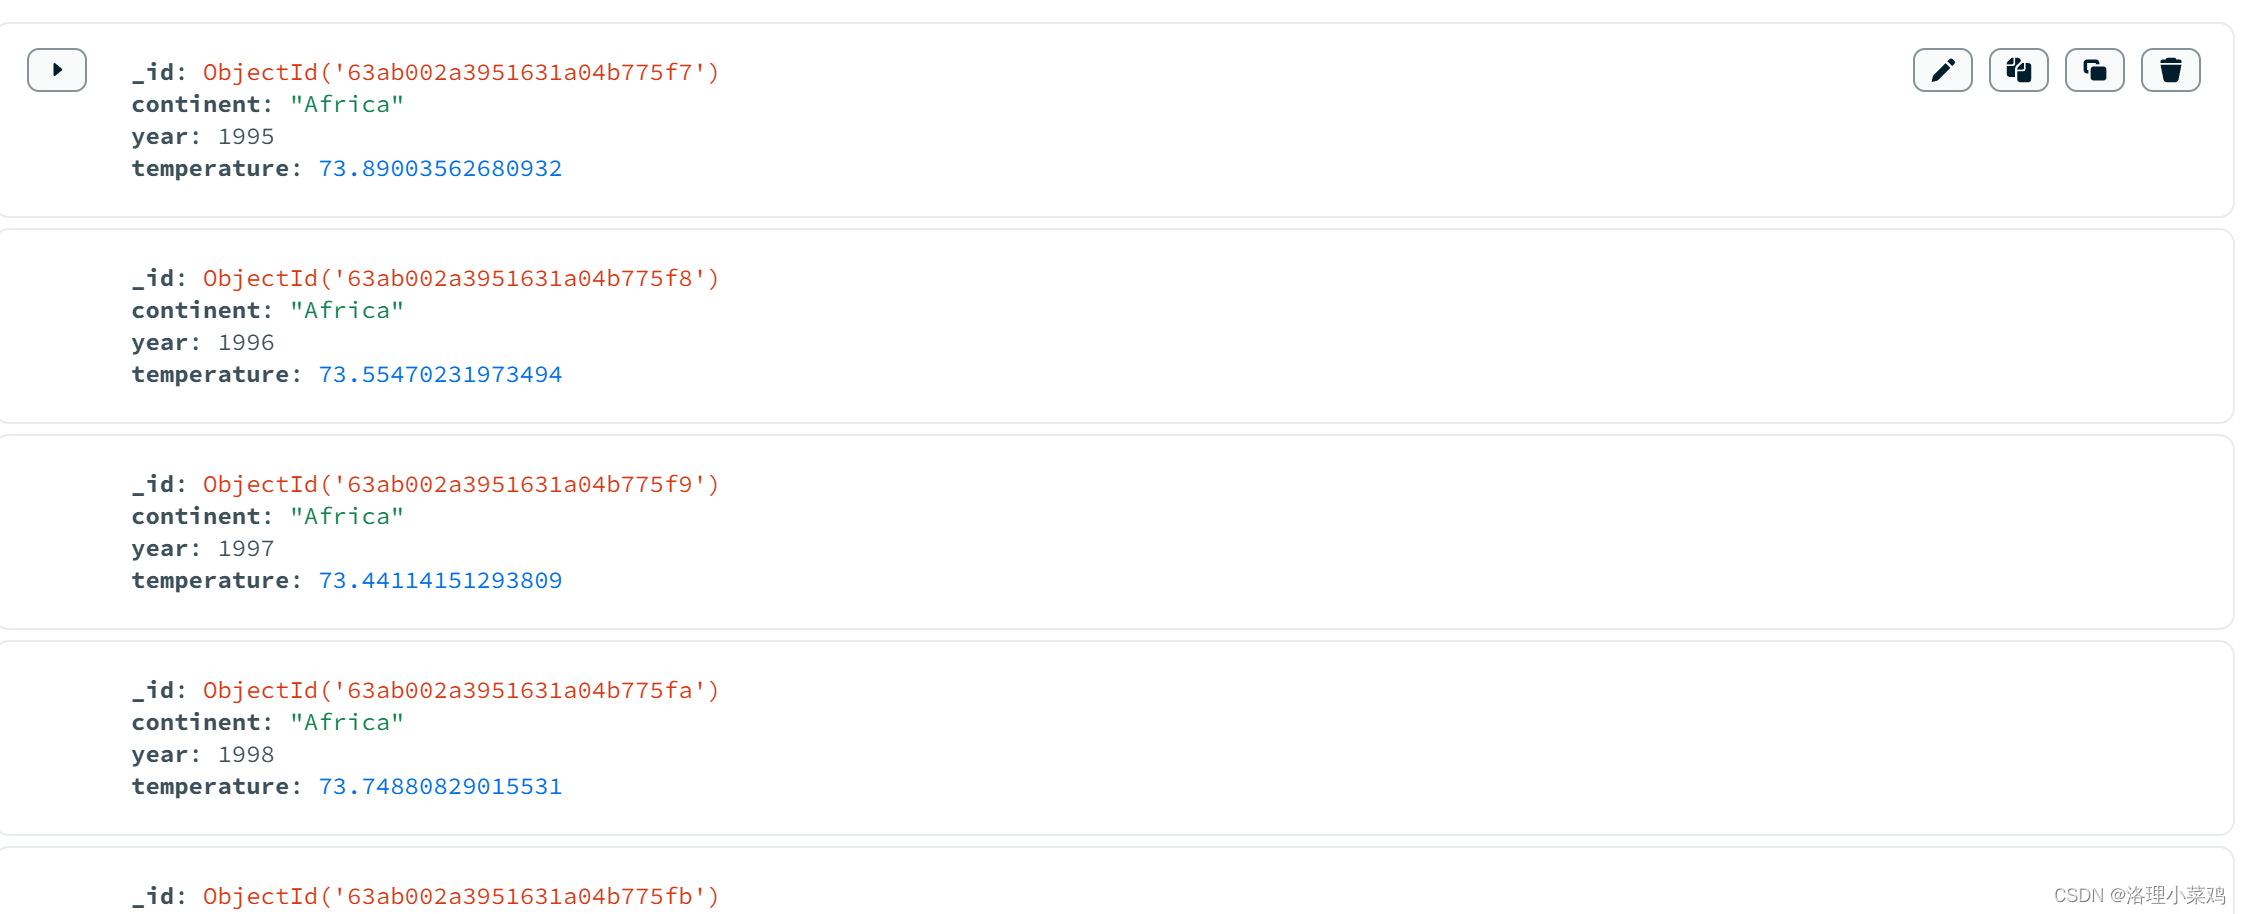
4.将数据放入mongodb数据库
4.1 ktr展示
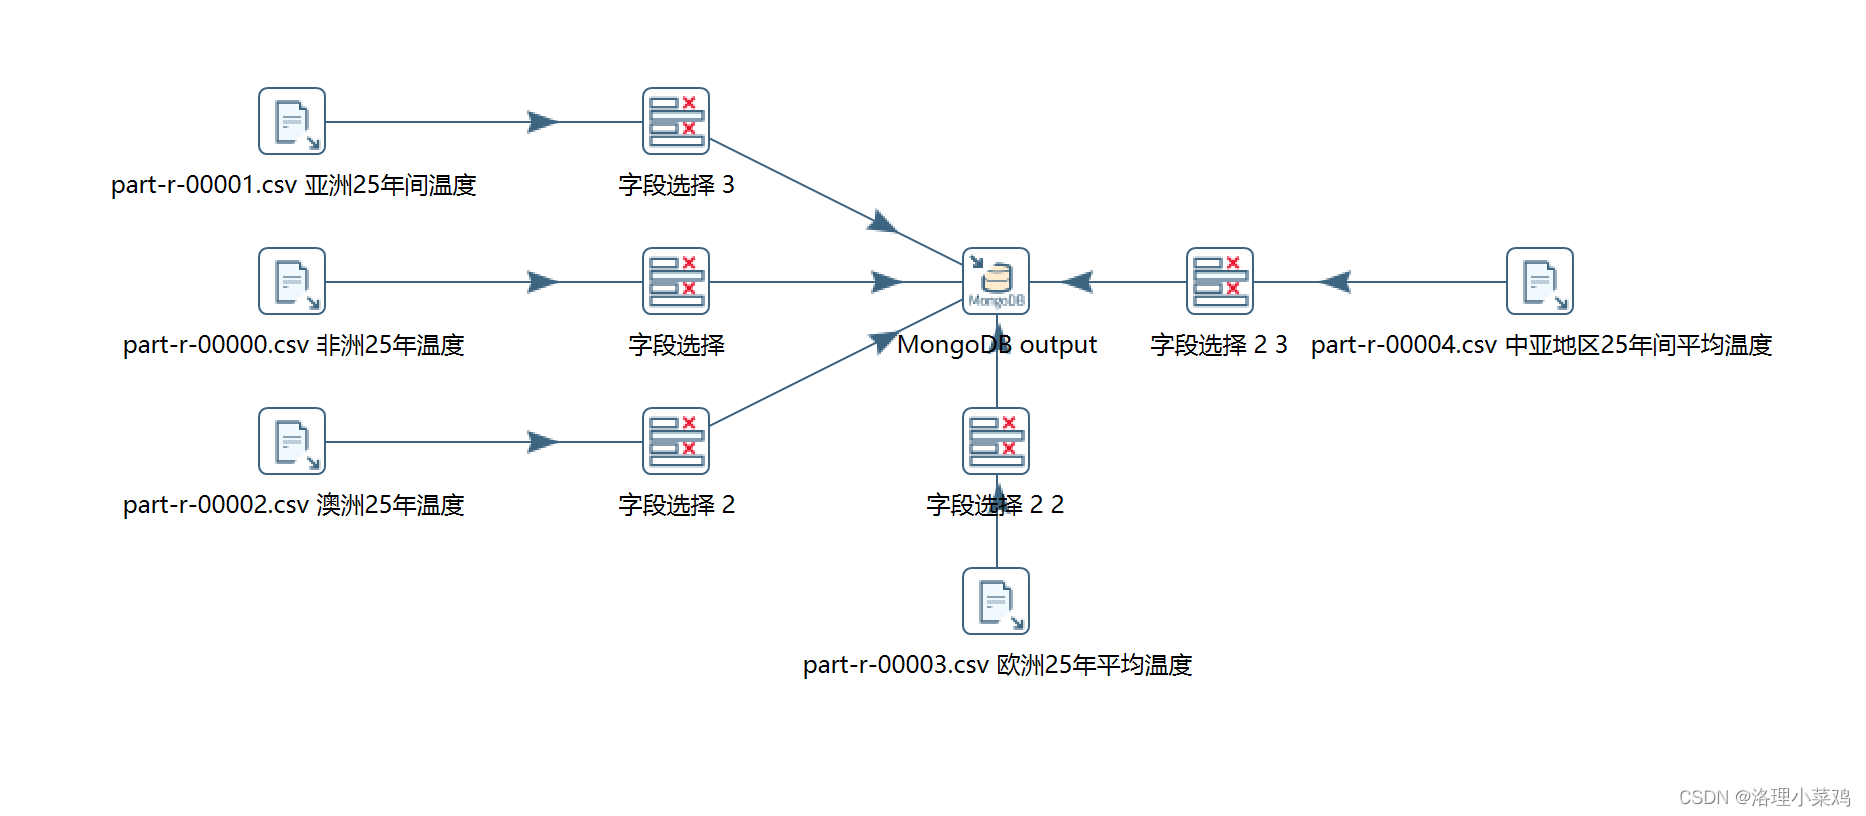
4.2 mongodb数据展示
5.使用pandas和pyecharts将数据可视化
5.1 代码展示
import pandas as pd
from numpy import double
from pyecharts import options as opts
from pyecharts.charts import *
from pyecharts.globals import *
def zone_Temperature():
df = pd.read_csv(r"D:\desk\Temperature\25年各大洲的平均温度\part-r-00000.csv", encoding='utf-8',header=None)
df2 = pd.read_csv(r"D:\desk\Temperature\25年各大洲的平均温度\part-r-00001.csv", encoding='utf-8',header=None)
df3 = pd.read_csv(r"D:\desk\Temperature\25年各大洲的平均温度\part-r-00002.csv", encoding='utf-8',header=None)
df4 = pd.read_csv(r"D:\desk\Temperature\25年各大洲的平均温度\part-r-00003.csv", encoding='utf-8',header=None)
df5 = pd.read_csv(r"D:\desk\Temperature\25年各大洲的平均温度\part-r-00004.csv", encoding='utf-8',header=None)
dfc=df[0].str.split("\t")
dfc2=df2[0].str.split("\t")
dfc3=df3[0].str.split("\t")
dfc4=df4[0].str.split("\t")
dfc5=df5[0].str.split("\t")
label=dfc[0][0]
label2=dfc2[0][0]
label3=dfc3[0][0]
label4=dfc4[0][0]
label5=dfc5[0][0]
year=[]
temper,temper2,temper3,temper4,temper5=[],[],[],[],[]
for i in range(0,25):
year.append(dfc[i][1])
temper.append(dfc[i][2])
temper2.append (dfc2[i][2])
temper3.append (dfc3[i][2])
temper4.append (dfc4[i][2])
temper5.append (dfc5[i][2])
line=(
Line()
.add_xaxis(xaxis_data=year)
.add_yaxis(series_name=label,
y_axis=temper)
.add_yaxis (series_name=label2,
y_axis=temper2)
.add_yaxis (series_name=label3,
y_axis=temper3)
.add_yaxis (series_name=label4,
y_axis=temper4)
.add_yaxis (series_name=label5,
y_axis=temper5)
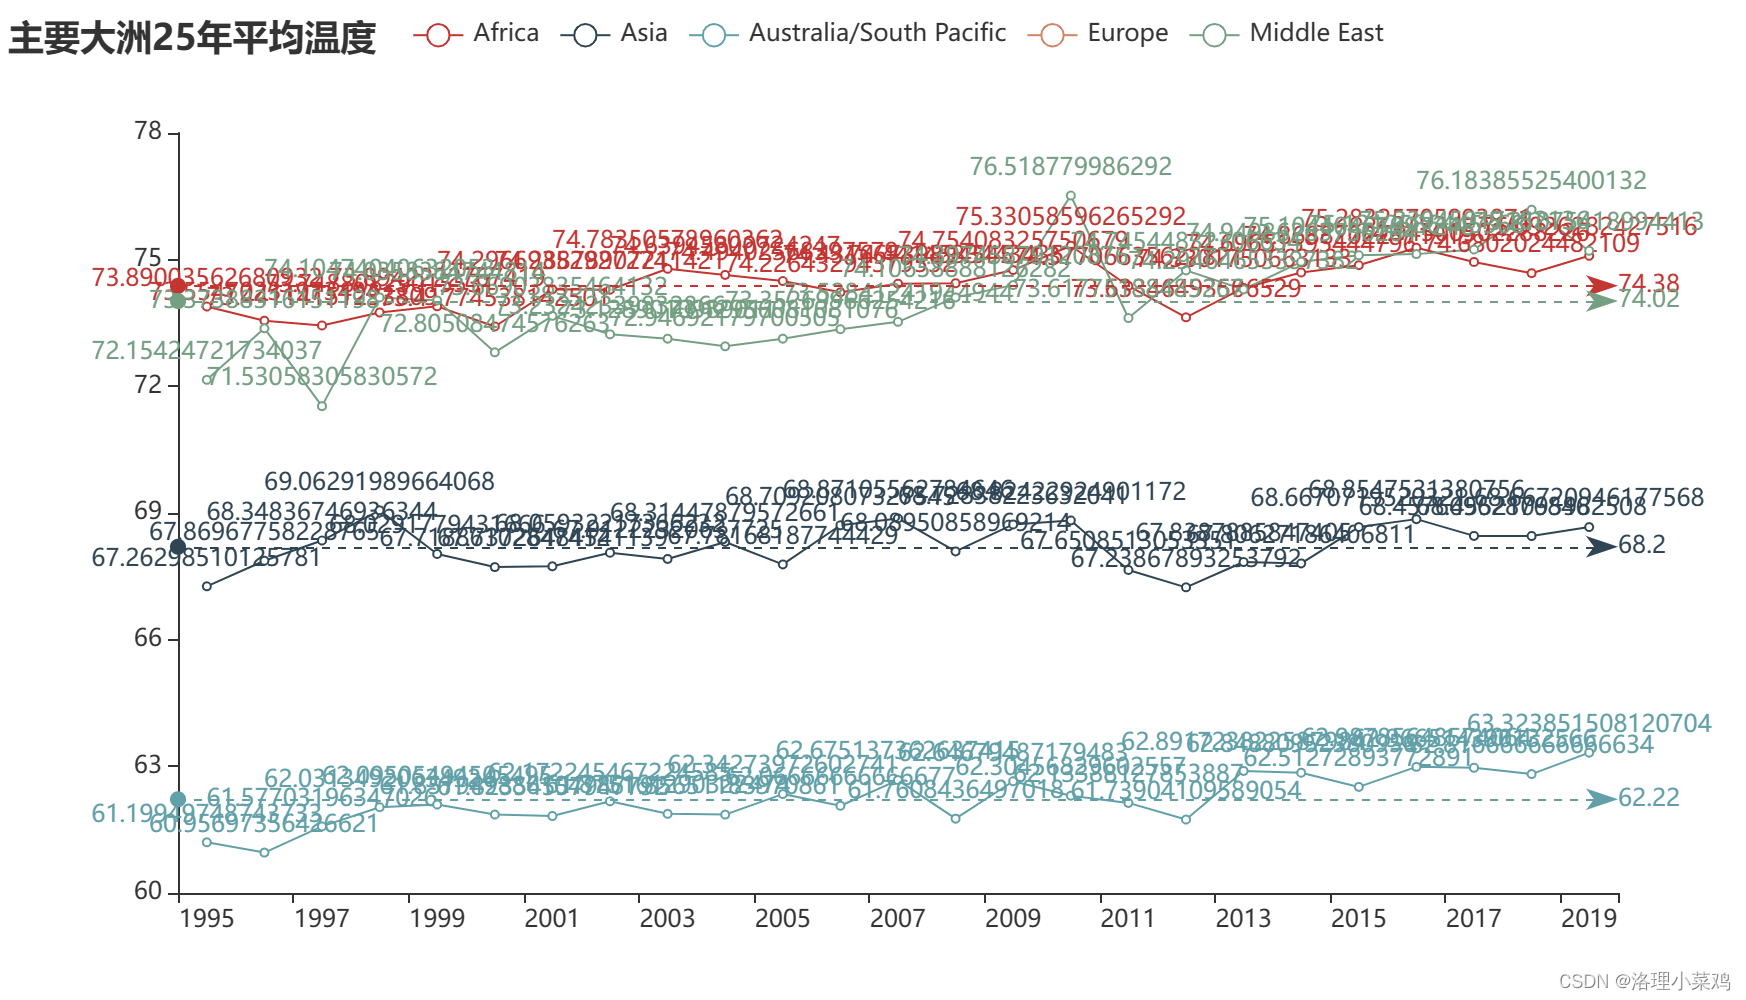
.set_global_opts(title_opts=opts.TitleOpts(title="主要大洲25年平均温度")
,yaxis_opts=opts.AxisOpts(min_=60))
.set_series_opts(
markline_opts=opts.MarkLineOpts (
data=[
opts.MarkPointItem(type_="average", name="平均值")
]
),
)
)
return Line
5.2 调用python函数生成html ,html展示
6.定义前端jsp页面,将html嵌入sp

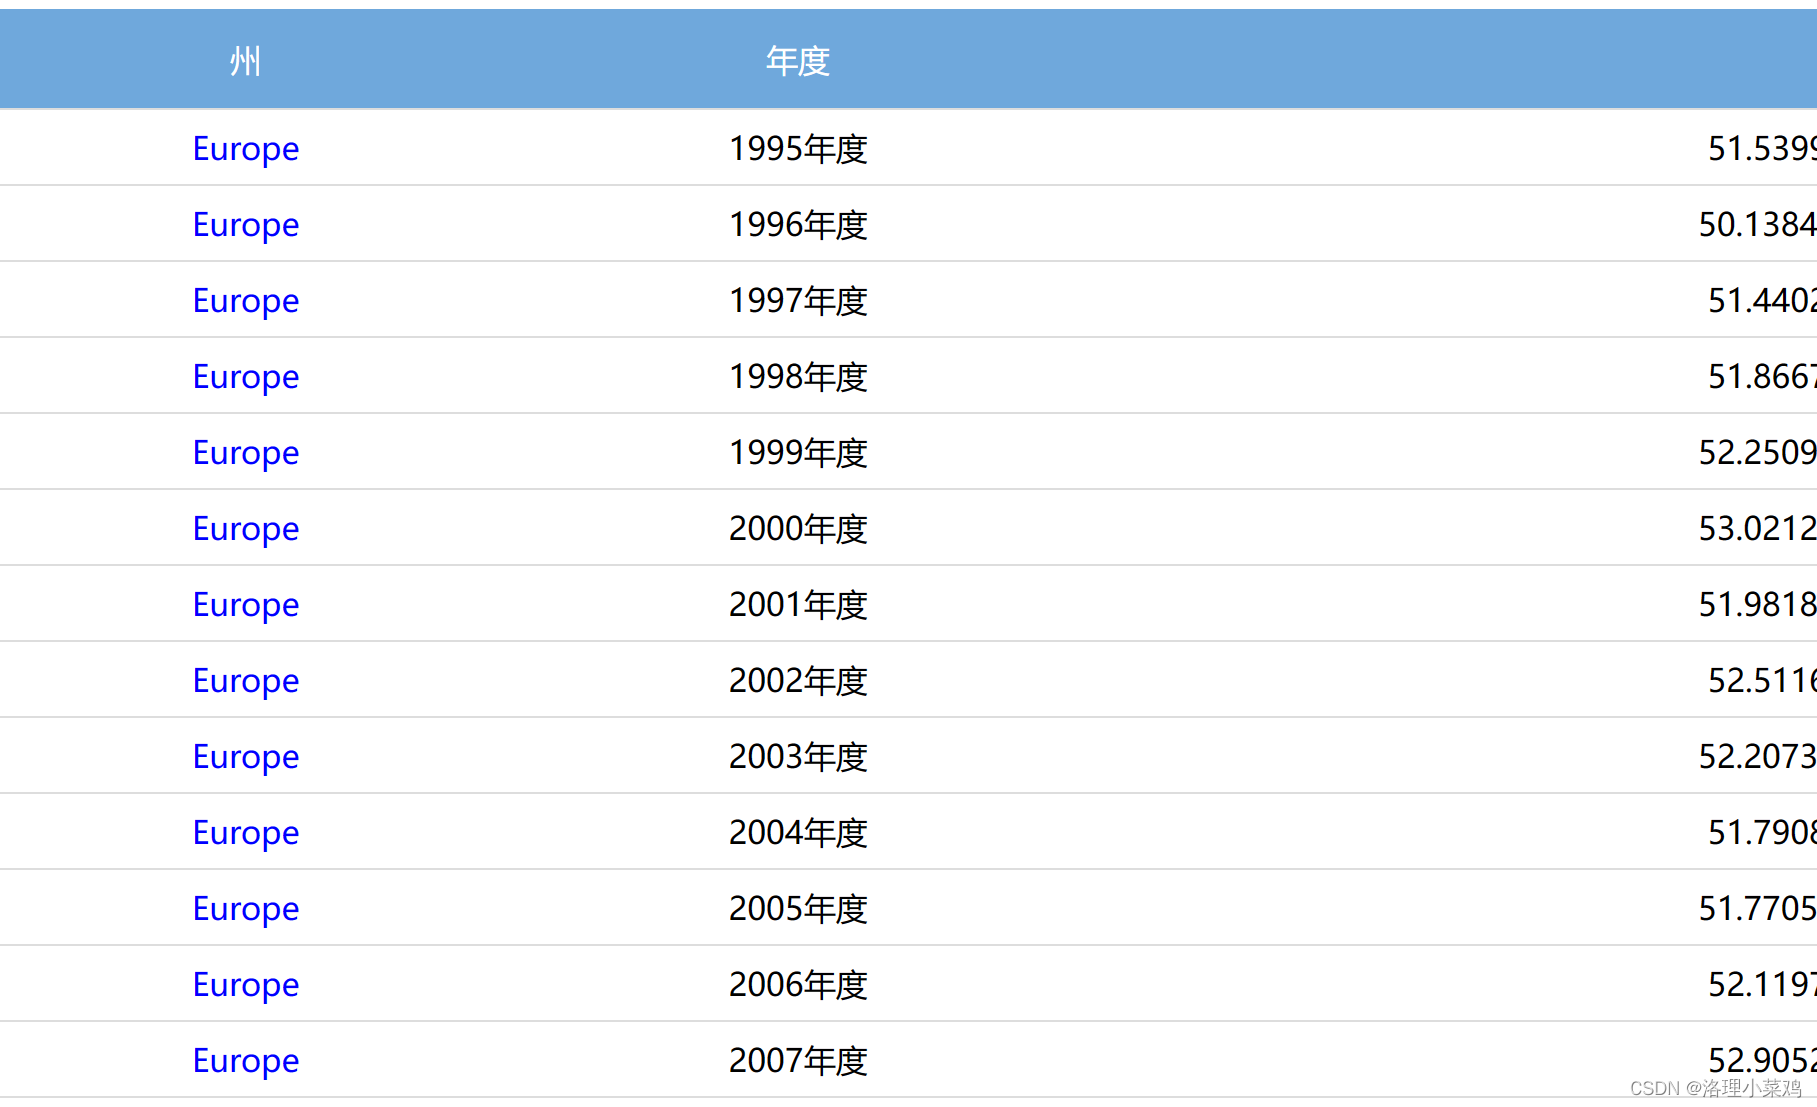
7.在前端中展示mongodb数据库内容


 1114
1114


 被折叠的 条评论
为什么被折叠?
被折叠的 条评论
为什么被折叠?
 到【灌水乐园】发言


