


数据集是被处理过的ml-100k
mport numpy as np
import pandas as pd
import math

t = pd.read_table('data/ml-100k/u.dataTrainmat', sep='\t', header=None)
tt = pd.read_table('data/ml-100k/u.dataTest', sep='\t', header=None)
A = np.asarray(t, float)
user = np.zeros((A.shape[0], A.shape[0]), float)
检测空行空列
p,q = A.shape
r = []
c = []
for i in range(p):
    if all(data == 0 for data in A[i,:]):
        r.append(i)
for j in range(q):
    if all(data == 0 for data in A[:,j]):
        c.append(j)
print(r)
print(c)
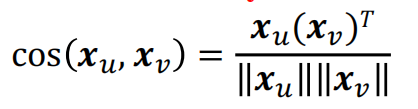
#构建用户相似矩阵,基于cos 公式
for i in range(A.shape[0]):
    for j in range(A.shape[0]):
        a = A[i, :]
        b = A[j, :]
        k = 0
        # 考虑共同评分,利用局部变量通过删除得到共同评分的矩阵
        while k < a.shape[0]:
            if a[k] == 0 or b[k] == 0:
                a = np.delete(a, [k])
                b = np.delete(b, [k])
            else:
                k += 1
        # cos
        temp = np.linalg.norm(a) * np.linalg.norm(b)
        if temp == 0:
            user[i, j] = 0
        else:
            user[i, j] = np.dot(a, b) / temp
定义k近邻函数,选取前k个满足条件的与目标用户最相似的用户
def get_k(a,b,k):
    tem = user[a,:]
    tt1 = np.argsort(tem)
    tt1 = tt1[::-1]
    n = []
    num = 0
    for i in range(1, tt1.shape[0]):
        if A[tt1[i], b] != 0 and user[a,tt1[i]] != 0:   # 避免将未评分的算入,以及 用户相似度为0的情况,避免后续出现 nan情况
            n.append(tt1[i])
            num += 1
        if num == k:
            break
    return n
#误差计算
MAE:
RMSE:
def MAE(a):
    n = len(a)
    sum = 0.0
    for i in range(n):
        sum += abs(tt[2][i] - a[i])

    return sum / n


def RMSE(a):
    n = len(a)
    sum = 0.0
    for i in range(n):
        sum += abs(tt[2][i] - a[i]) ** 2
    return math.sqrt(sum / n)
预测
计算不同k值下的两种损失值
mae = []
rmse = []
for w in range(10):
temp1 = []
# 预测
for h in range(tt.shape[0]):
i,j = tt[0][h],tt[1][h]
n = get_k(i, j, w+1)
s = 0
t = 0
if n:
for k in range(len(n)):
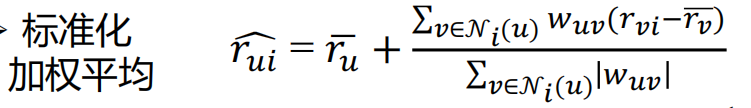
s += (A[n[k], j] - sum(A[n[k], :]) / np.count_nonzero(A[n[k], :])) * user[i, n[k]]
t += user[i, n[k]]
ss = s / t + sum(A[i, :]) / np.count_nonzero(A[i, :])
else:
ss = A[i,j]
temp1.append(ss)
mae.append(MAE(temp1))
rmse.append(RMSE(temp1))
print(mae)
print(rmse)

数据可视化
import matplotlib.pyplot as plt
x = [i for i in range(1,11)]
plt.title("the Efficiency of MAE and RMSE Based on Ml-100k ")
plt.ylabel('loss')
plt.xlabel('k_value')
plt.plot(x,mae,label="MAE")
plt.plot(x,rmse,label="RMSE")
plt.legend()
plt.show()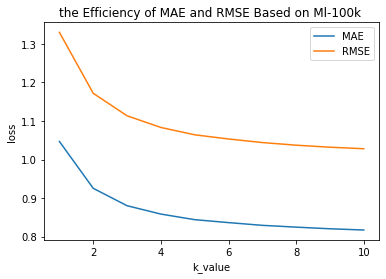


 8747
8747


 被折叠的 条评论
为什么被折叠?
被折叠的 条评论
为什么被折叠?
 到【灌水乐园】发言


