


python-使用API
使用github的api-即url地址请求数据
https://api.github.com/search/repositories?q=language:python&sort=stars
#这个调用返回GitHub当前托管了多少个Python项目,还有有关最受欢迎的Python仓库的信息。
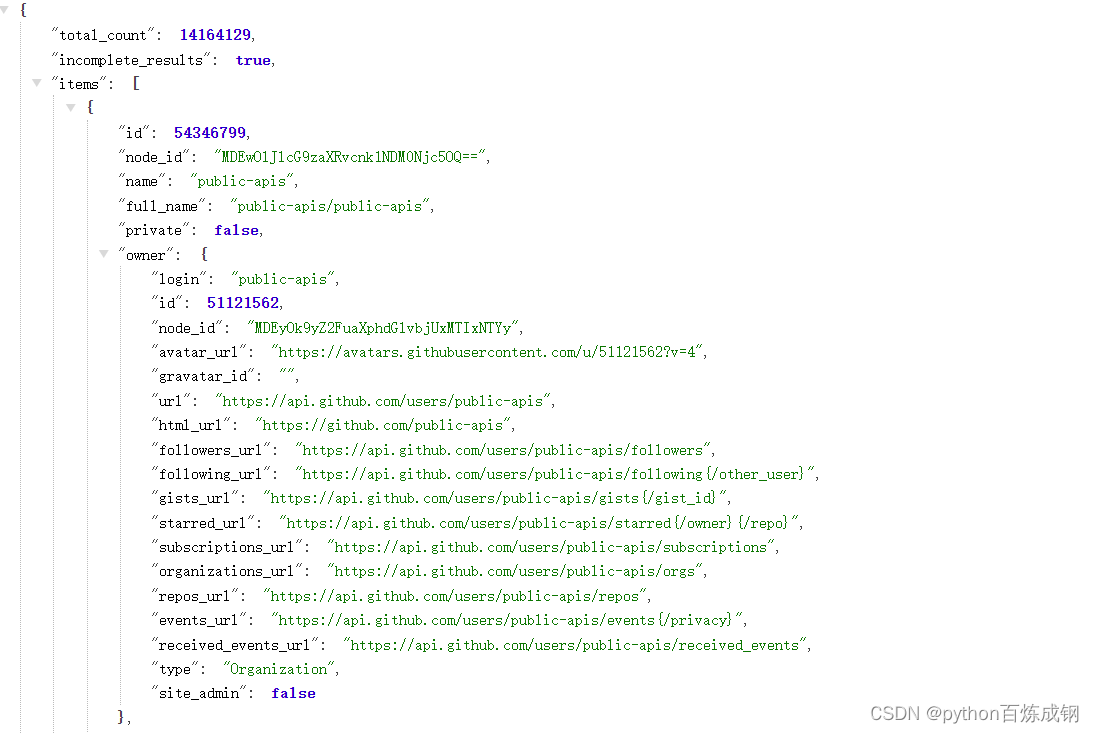
在浏览器中输入上面地址可以看到该接口(api)返回的json数据
这里推荐下载JSON Formatter的扩展程序,会自动将json数据整理后呈现
1.安装requests
- requests包让Python程序能够轻松地向网站请求信息以及检查返回的响应
- 在命令行窗口输入指令安装
pip install --user requests
2.使用requests.get()方法
下面来编写一个程序,它执行API调用并处理结果,找出GitHub上星级最高的Python项目
import requests

url = "https://api.github.com/search/repositories?q=language:python&sort=stars"
r = requests.get(url)
#使用requests.get()方法来请求地址,返回Response对象

print(r.status_code)
#返回请求状态码

req_json = r.json()
#将返回的Response对象的json内容并转成字典{key:value}
for key,value in req_json.items():
    print(f"{key}")

"""输出:
200
total_count
incomplete_results
items
之后可通过req_json['total_count']
req_json['incomplete_results']
req_json['items']
进行访问数据
"""
接着你就可以使用字典和列表的嵌套去访问你想要的数据。
监视API的速率限制
大多数API都存在速率限制,即你在特定时间内可执行的请求数存在限制。
#浏览器输入https://api.github.com/rate_limit

{
  "resources": {
    "core": {
      "limit": 60,
      "remaining": 58,
      "reset": 1426082320
    },
    "search": { ❶
      "limit": 10, ❷
      "remaining": 8, ❸
      "reset": 1426078803 ❹
    }
  },
  "rate": {
    "limit": 60,
    "remaining": 58,
    "reset": 1426082320
  }
}

#serch为搜索极限为每分钟10个请求,而在当前这一分钟还可以请求8次
#reset值指的是配额将重置的Unix时间或新纪元时间(1970年1月1日午夜后多少秒)
数据可视化
将获取到的数据进行可视化,呈现GitHub上Python项目的受欢迎程度
需求:
我们将创建一个交互式条形图:条形的高度表示项目获得了多少颗星。单击条形将带你进入项目在GitHub上的主页。
import requests
import csv
import matplotlib
matplotlib.use('TkAgg')
import matplotlib.pyplot as plt
import  pygal
from pygal.style import LightColorizedStyle as LCS, LightenStyle as LS

url = "https://api.github.com/search/repositories?q=language:python&sort=stars"
r = requests.get(url)

req_json = r.json()

name= []
html_url = []
polt_dicts = []
for item in req_json['items']:
    name.append(item['name'])

    html_url.append('html_url')
    polt_dict = {
        'value':item['stargazers_count'],
        #value决定了表的值和高度
        'label':item['description'],
        #lable决定了鼠标悬停显示的提示内容
        'xlink': item['html_url'],
        #xlink决定了点击后的连接地址
    }
    polt_dicts.append(polt_dict)

my_style = LS('#333366',base_style=LCS)

my_config = pygal.Config()
my_config.x_label_rotation = 45
my_config.show_legend = False
my_config.title_font_size = 24
my_config.label_font_size = 14
my_config.major_label_font_size = 18
my_config.truncate_label = 15
my_config.show_y_guides = False
my_config.width = 1000
#一些参数

chart = pygal.Bar(my_config,style = my_style)
chart.title ="Most -Stars python Project on GitHub"
#设置title
chart.x_labels = name
#设置x轴的标签
chart.add('',polt_dicts)
#设置其他信息
chart.render_to_file('python_repos.svg')
#保存为:python_repos.svg
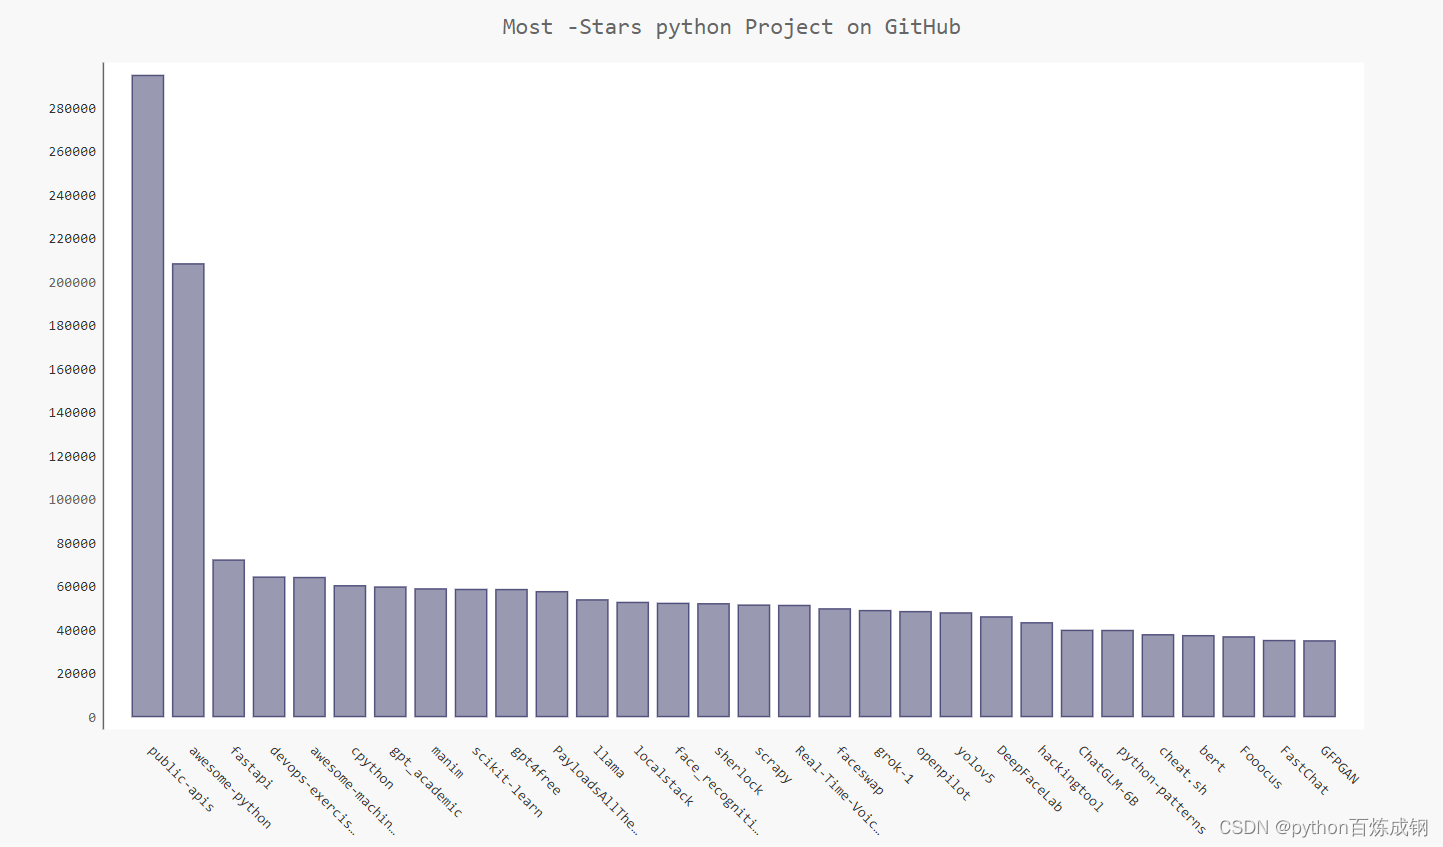
可以实现鼠标悬停后显示相关描述,点击进入项目的github地址


 3167
3167

 被折叠的 条评论
为什么被折叠?
被折叠的 条评论
为什么被折叠?
 到【灌水乐园】发言


