


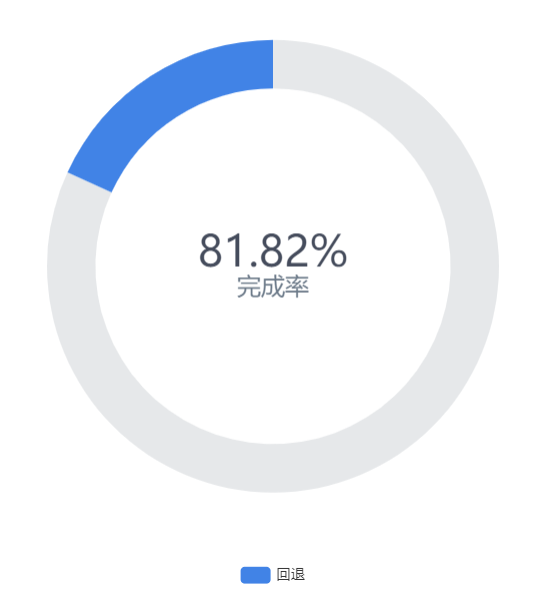
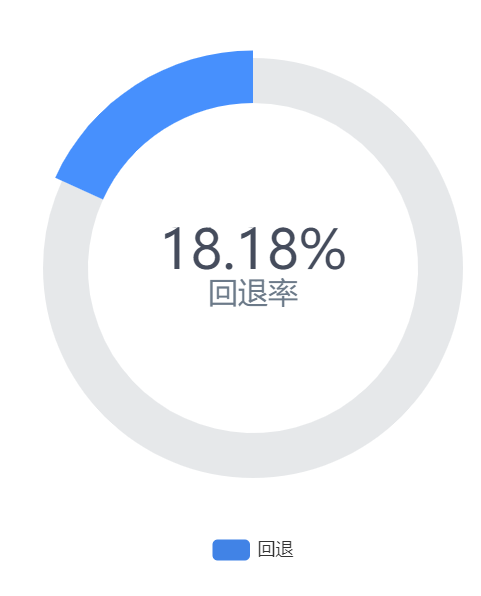
饼图是画完了,现在要求打开页面的时候数据要显示回退率(第二项数据)还要让数据高亮
当前样式
我们可以通过Echarts的api去控制数据的激活来达到效果
myChart.dispatchAction({
    type: 'highlight',
    seriesIndex: 0,
    dataIndex: 1,// 要激活的数据索引
  })
在这里回退是data数组的第二项所以我激活的索引是1
当前效果
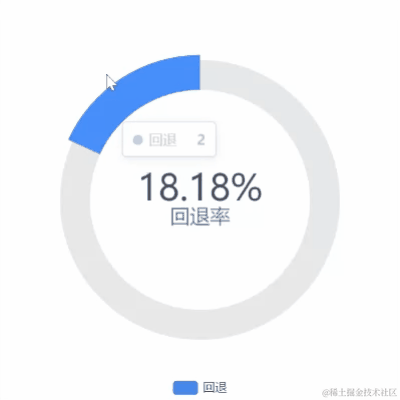
但是这样有一个问题,数据会一直处于高亮状态,鼠标移入移出都不会改变,我们可以通过官方提供的api来控制高亮
// 鼠标移入
  myChart.on('mouseover', (e) => {
    // 清除全部已有高亮
    myChart.dispatchAction({
      type: 'downplay',
      seriesIndex: 0,
      dataIndex: [0, 1],
    })
    // 高亮鼠标触发的数据
    myChart.dispatchAction({
      type: 'highlight',
      seriesIndex: 0,
      dataIndex: e.dataIndex,
    })
  })
  // 鼠标移出
  myChart.on('mouseout', () => {
    // 清除全部已有高亮
    myChart.dispatchAction({
      type: 'downplay',
      seriesIndex: 0,
      dataIndex: [0, 1],
    })
    // 高亮默认数据
    myChart.dispatchAction({
      type: 'highlight',
      seriesIndex: 0,
      dataIndex: 1,
    })
  })
最终效果
完整代码
<template>
  <div ref="main" class="main"></div>
</template>

<script setup>
import { ref, onMounted } from 'vue';
import * as echarts from 'echarts';

const main = ref(null);

const pieChart = () => {
  const myChart = echarts.init(main.value);
  const option = {
    tooltip: {
      // 提示框触发类型
      trigger: 'item' // 鼠标移到数据项上时触发提示框
    },
    // 图例
    legend: {
      bottom: '0%', // 图例组件离容器底部的距离
      data: [{ name: '回退' }], // 图例的数据数组,数组中每一项代表一个系列的名称
      selectedMode: false // 图例选择的模式,'false' 表示不可选择
    },
    avoidLabelOverlap: false, // 防止标签重叠
    series: [
      {
        type: 'pie',
        legendHoverLink: false, // 图例是否联动高亮
        radius: ['55%', '70%'],
        label: {
          show: true, // 是否显示标签
          position: 'center', // 标签的位置,'center' 表示在饼图的中心
          formatter: '{total|' + '{d}%' + '}' + '\n' + '{active|{b}率}', // 标签的格式化字符串
          rich: {
            total: {
              fontSize: 36,
              fontFamily: '微软雅黑',
              color: '#454c5c',
              height: 36,
              backgroundColor: '#fff',
            },
            active: {
              fontSize: 20,
              fontFamily: '微软雅黑',
              color: '#6c7a89',
              height: '18',
              backgroundColor: '#fff',
            }
          }
        },
        emphasis: {
          label: {
            show: true // 高亮时显示标签
          }
        },
        data: [
          {
            value: 9,
            name: '完成',
            emphasis: {
              itemStyle: {
                color: '#e6e8ea' // 高亮时的数据项的颜色
              }
            }
          },
          {
            value: 2,
            name: '回退'
          }
        ],
        color: ['#e6e8ea', '#4183e6']
      }
    ]
  };

  myChart.setOption(option);


}
// 饼状图初始化
const pieChartInit = () => {
  const myChart = echarts.init(main.value);
  myChart.dispatchAction({
    type: 'highlight',
    seriesIndex: 0,
    dataIndex: 1,
  })
  // 鼠标移入
  myChart.on('mouseover', (e) => {
    // 清除全部已有高亮
    myChart.dispatchAction({
      type: 'downplay',
      seriesIndex: 0,
      dataIndex: [0, 1],
    })
    // 高亮鼠标触发的数据
    myChart.dispatchAction({
      type: 'highlight',
      seriesIndex: 0,
      dataIndex: e.dataIndex,
    })
  })
  // 鼠标移出
  myChart.on('mouseout', () => {
    // 清除全部已有高亮
    myChart.dispatchAction({
      type: 'downplay',
      seriesIndex: 0,
      dataIndex: [0, 1],
    })
    // 高亮默认数据
    myChart.dispatchAction({
      type: 'highlight',
      seriesIndex: 0,
      dataIndex: 1,
    })
  })
}


onMounted(() => {
  pieChart()
  pieChartInit()

});


</script>

<style scoped>
.main {
  width: 400px;
  height: 400px;
}
</style>


 1228
1228


 被折叠的 条评论
为什么被折叠?
被折叠的 条评论
为什么被折叠?
 到【灌水乐园】发言


