


1 项目目标
(1)实操更换grafana数据源为MySQL
(2)实操安装并应用mysql_exporter
(3)实操安装并应用blackbox_exporter
(4)实操安装并应用process_exporter
2 项目准备
2.1 规划节点
| 主机名 | 主机IP | 节点规划 |
| prome-master01 | 10.0.1.10 | 服务端 |
| prome-node01 | 10.0.1.20 | 客户端 |
2.2 基础准备
环境准备:Prometheus环境、grafana环境
mysql环境,之前写过一篇博客MySQL 8.0的三种安装方式
3 项目实施
3.1 grafana db替换mysql数据源
vim /etc/grafana/grafana.ini
修改以下内容
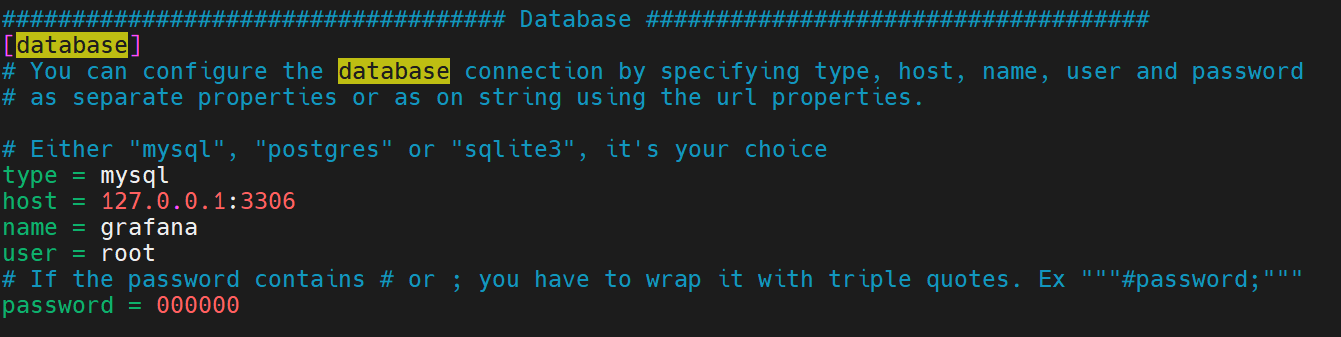
创建一个grafana表
[root@prome-node-01 ~]# mysql -uroot -p000000
mysql> CREATE DATABASE IF NOT EXISTS grafana DEFAULT CHARSET utf8 COLLATE utf8_general_ci;
重启grafana
systemctl restart grafana-server访问IP:3000 发现要重新配置grafana,说明数据库已经迁移到mysql中。
不使用sqllite的原因是因为没有mysql的性能好
3.2 安装使用mysql_exporter
mysql_exporter 是一个用于收集 MySQL 或 MariaDB 数据库相关指标的工具,它需要连接到数据库并具有相应的权限。它的作用主要包括监控数据库的性能和资源利用率,以便及时发现和解决问题,保证数据库的稳定运行。
3.2.1 mysql_exporter安装
去这里找最新版的下载。Releases · prometheus/mysqld_exporter (github.com)
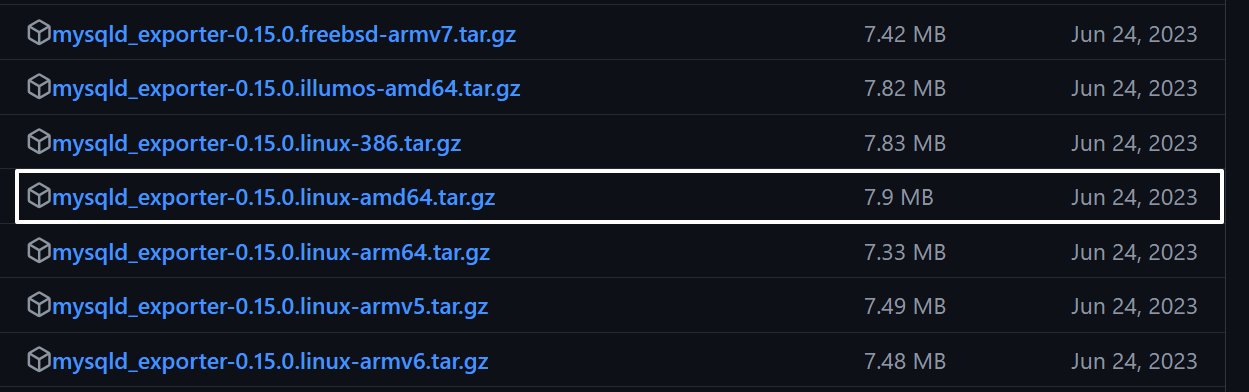
安装mysql_exporter
wget https://github.com/prometheus/mysqld_exporter/releases/download/v0.15.0/mysqld_exporter-0.15.0.linux-amd64.tar.gz
tar xvf mysqld_exporter-0.15.0.linux-amd64.tar.gz -C /usr/local/
cd /usr/local/
mv mysqld_exporter-0.15.0.linux-amd64/ mysqld_exporter

cat >/usr/lib/systemd/system/mysqld_exporter.service <<EOF
[Unit]
Description=mysqld_exporter Exporter
Wants=network-online.target
After=network-online.target

[Service]
Environment=DATA_SOURCE_NAME=exporter:123123@tcp/
ExecStart=/usr/local/mysqld_exporter/mysqld_exporter --config.my-cnf=/usr/local/mysqld_exporter/.my.cnf
StandardOutput=syslog
StandardError=syslog
SyslogIdentifier=mysqld_exporter
[Install]
WantedBy=default.target
EOF
创建一个mysql用户
mysql -uroot -p000000
CREATE USER 'exporter'@'%' IDENTIFIED BY '123123' ;
GRANT PROCESS, REPLICATION CLIENT, SELECT ON *.* TO 'exporter'@'%';
FLUSH PRIVILEGES;
创建配置文件
cat > .my.cnf <<EOF
[client]
user=exporter
password=123123
EOF
启动mysql_exporter
systemctl start mysqld_exporter
systemctl status mysqld_exporter
systemctl enable mysqld_exporter
编辑prometheus.yml,添加一个job
- job_name: mysqld_exporter
  honor_timestamps: true
  scrape_interval: 15s
  scrape_timeout: 10s
  metrics_path: /metrics
  scheme: http
  static_configs:
  - targets:
    - 10.0.1.10:9104
[root@prome-node-01 prometheus]# systemctl daemon-reload
[root@prome-node-01 prometheus]# systemctl restart prometheus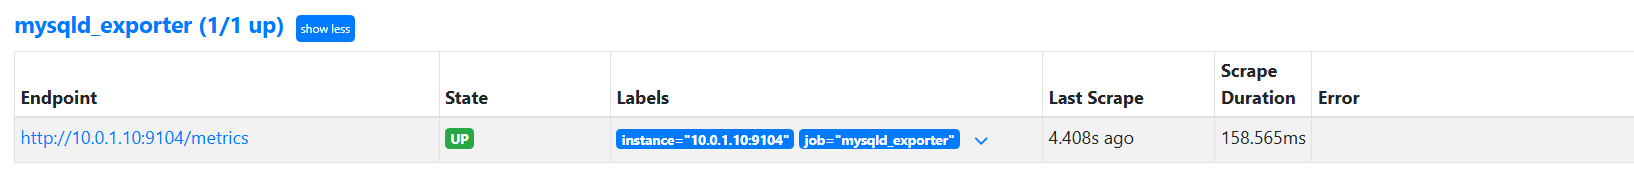
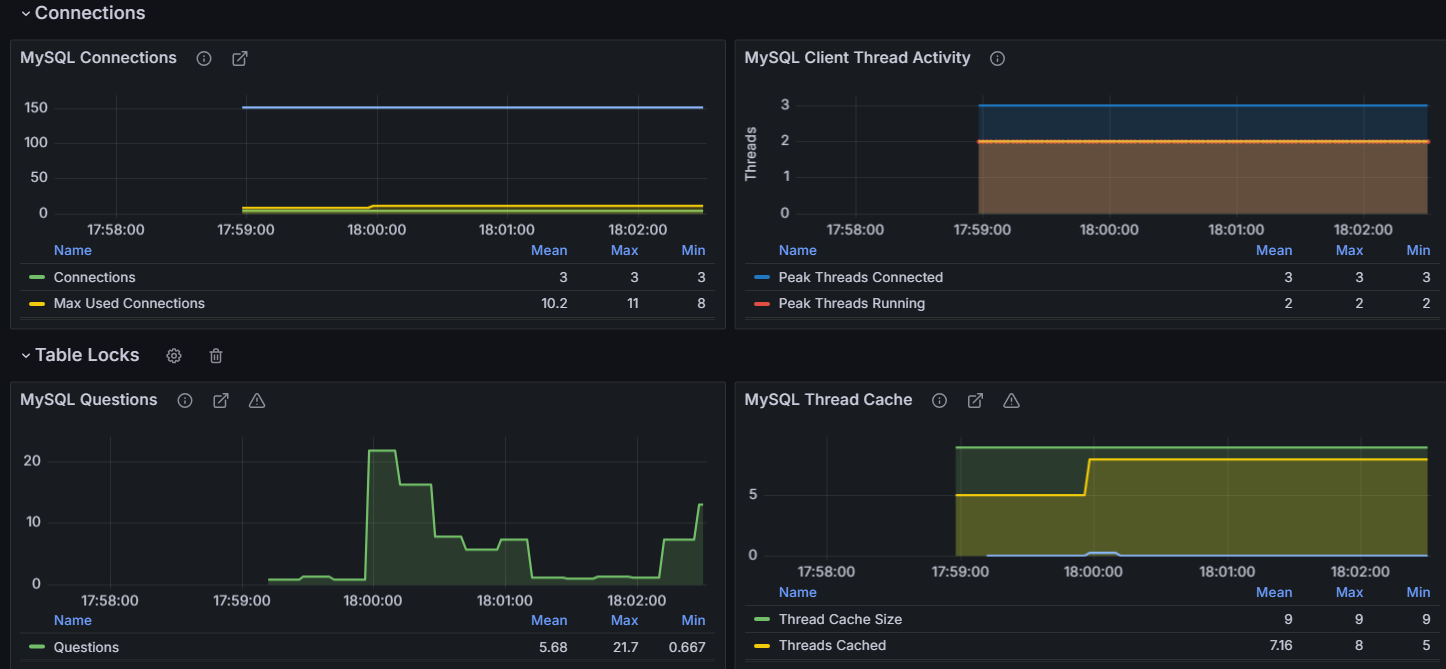
grafana导入ID:11323模版
题外话:行面板Row

看到mysql有很多title,然后展开或者折叠。
如果面板比较多,这样还是挺有好处,可以把当前不关心的监控面板先折叠。
另外这种是懒加载的,只有展示的时候,才会加载数据,如果指标太多,只展开自己关注的面板,在性能上也能降低一些影响。
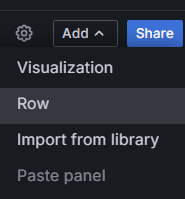
在这里即可添加。
MySQL关键指标说明
| 类型 | 指标名称 | 说明 |
| 可用性 | mysql_up | 表示MySQL实例是否已停机。 |
| mysql_global_status_uptime | 表示数据库正常运行的时长,通常使用该指标配置告警,监控运行少于半小时的MySQL实例。 | |
| 数据库连接 | mysql_global_status_connection_errors_total | 连接错误是数据库中的主要错误之一,通过该指标可以查看到具体连接错误信息以及错误连接次数。 |
| mysql_global_status_threads_connected | MySQL实例请求已经连接的线程数。 | |
| mysql_global_status_threads_running | MySQL实例请求运行中的线程数。 | |
| mysql_global_status_max_used_connections | MySQL实例最大连接记录统计。 | |
| mysql_global_variables_max_connections | MySQL实例的最大连接数,若超过该连接数之后有新的请求到来,就会拒绝连接。 | |
| mysql_global_status_aborted_connects | 异常中断的连接(尝试连接)。 | |
| mysql_global_status_aborted_clients | 异常中断的连接(超时)。 | |
| 查询 | mysql_global_status_slow_queries | MySQL实例慢查询统计。 |
| mysql_global_status_queries | MySQL实例当前查询QPS。 | |
| 流量 | mysql_global_status_bytes_received | 入站流量。 |
| mysql_global_status_bytes_sent | 出站流量。 | |
| 文件 | mysql_global_status_opened_files | 正在打开的文件统计。 |
| mysql_global_status_open_files | MySQL已经打开的文件统计。 | |
| mysql_global_variables_open_files_limit | 允许打开的文件统计。 | |
| mysql_global_status_innodb_num_open_files | Innodb打开的文件统计。 |
3.3 黑盒探针blackbox
黑盒探针(Blackbox Exporter)是 Prometheus 生态系统中的一个组件,它的作用是允许 Prometheus 通过执行自定义的探测脚本来监控黑盒服务。这里的“黑盒”指的是那些不提供 Prometheus 指标接口的服务或系统,例如 SMTP 服务器、FTP 服务器、HTTP 服务等。
- 服务发现:Blackbox Exporter 可以自动发现服务,无需 Prometheus 直接配置目标。
- 自定义探测:用户可以编写自定义的探测脚本来检查服务的可用性、响应时间等。
- 协议支持:支持多种协议的探测,如 HTTP、HTTPS、SMTP、POP3、IMAP、TCP、DNS 等。
- 指标收集:收集探测过程中的各种指标,如探测的成功率、响应时间、HTTP 状态码等。
3.3.1 黑盒探针安装
去这里找最新版的下载。Releases · prometheus/blackbox_exporter (github.com)
wget https://github.com/prometheus/blackbox_exporter/releases/download/v0.25.0/blackbox_exporter-0.25.0.linux-amd64.tar.gz
tar xzvf blackbox_exporter-0.25.0.linux-amd64.tar.gz -C /usr/local
cd /usr/local/
mv blackbox_exporter-0.25.0.linux-amd64/ blackbox_exporter
vim /lib/systemd/system/blackbox_exporter.service
[Unit]
Description=Prometheus Blackbox Exporter
After=network.target
[Service]
Type=simple
User=root
Group=root
ExecStart=/usr/local/blackbox_exporter/blackbox_exporter --config.file=/usr/local/blackbox_exporter/blackbox.yml --web.listen-address=:9115
Restart=on-failure
[Install]
WantedBy=multi-user.target
systemctl start blackbox_exporter
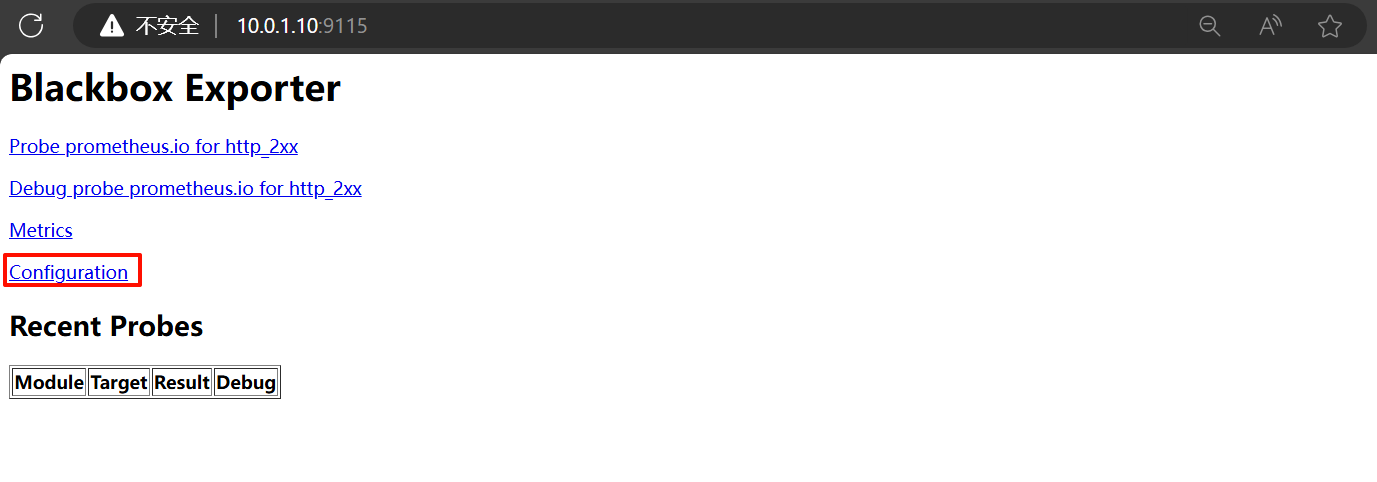
systemctl enable blackbox_exporter访问IP:9115
3.3.2 黑盒探测http
http 探针是进行黑盒监控时最常用的探针之一,通过 http 探针能够网站或者 http 服务建立有效的监控,包括其本身的可用性,以及用户体验相关的如响应时间等等。除了能够在服务出现异常的时候及时报警,还能帮助运维分析和优化网站体验。
修改配置文件
[root@prome-node-01 ~]# vim /usr/local/prometheus/prometheus.yml
- job_name: 'blackbox-http'
    # metrics的path 注意不都是/metrics
    metrics_path: /probe
    # 传入的参数
    params:
      module: [http_2xx]  # Look for a HTTP 200 response.
      target: [prometheus.io,www.baidu.com,10.0.1.10:3000]
    static_configs:
      - targets:
        - 10.0.1.10:9115
[root@prome-node-01 ~]# systemctl daemon-reload
[root@prome-node-01 ~]# systemctl restart prometheus
登录到Prometheus的target上查看。
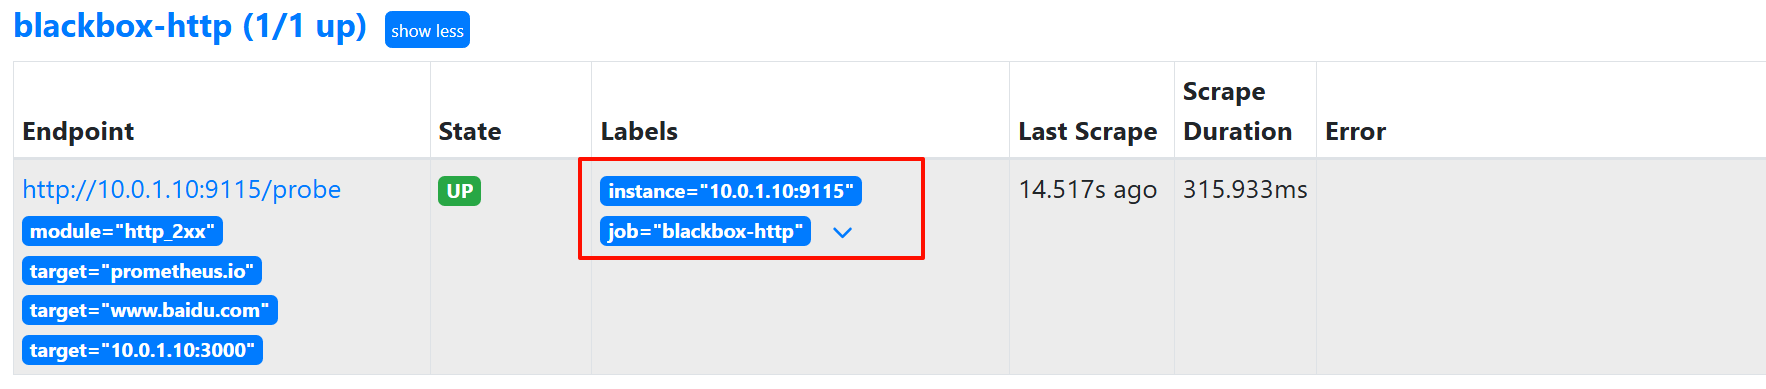
发现instance没有另外两个。
可以探测多实例,修改Prometheus配置文件,包含http和ssh:
- job_name: 'blackbox-http'
# metrics的path 注意不都是/metrics
metrics_path: /probe
# 传入的参数
params:
module: [http_2xx] # Look for a HTTP 200 response.
static_configs:
- targets:
- http://prometheus.io # Target to probe with http.
- https://www.baidu.com # Target to probe with https.
- http://10.0.1.10:3000 # Target to probe with http on port 3000.
relabel_configs:
- source_labels: [__address__]
target_label: __param_target
- source_labels: [__param_target]
target_label: instance
- target_label: __address__
replacement: 127.0.0.1:9115 # The blackbox exporter's real hostname:port.
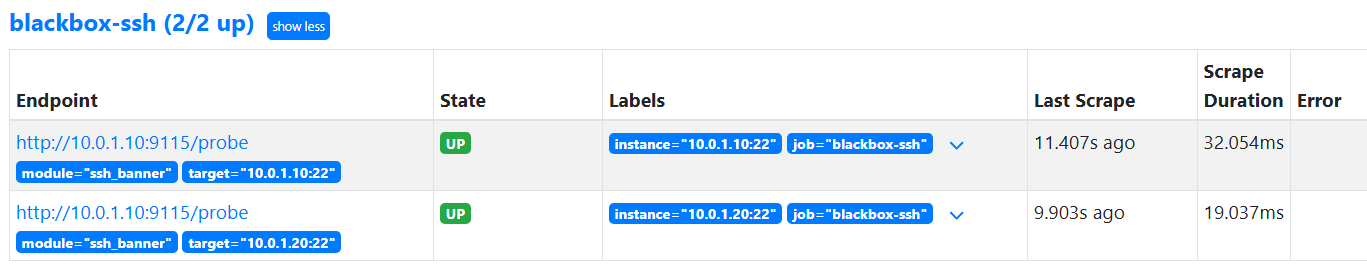
- job_name: 'blackbox-ssh'
# metrics的path 注意不都是/metrics
metrics_path: /probe
# 传入的参数
params:
module: [ssh_banner] # Look for a HTTP 200 response.
static_configs:
- targets:
- 10.0.1.10:22 # Target to probe with http.
- 10.0.1.20:22 # Target to probe with https.
relabel_configs:
- source_labels: [__address__]
target_label: __param_target
- source_labels: [__param_target]
target_label: instance
- target_label: __address__
replacement: 10.0.1.10:9115 # The blackbox exporter's real hostname:port.再次查看即可查看到三个。
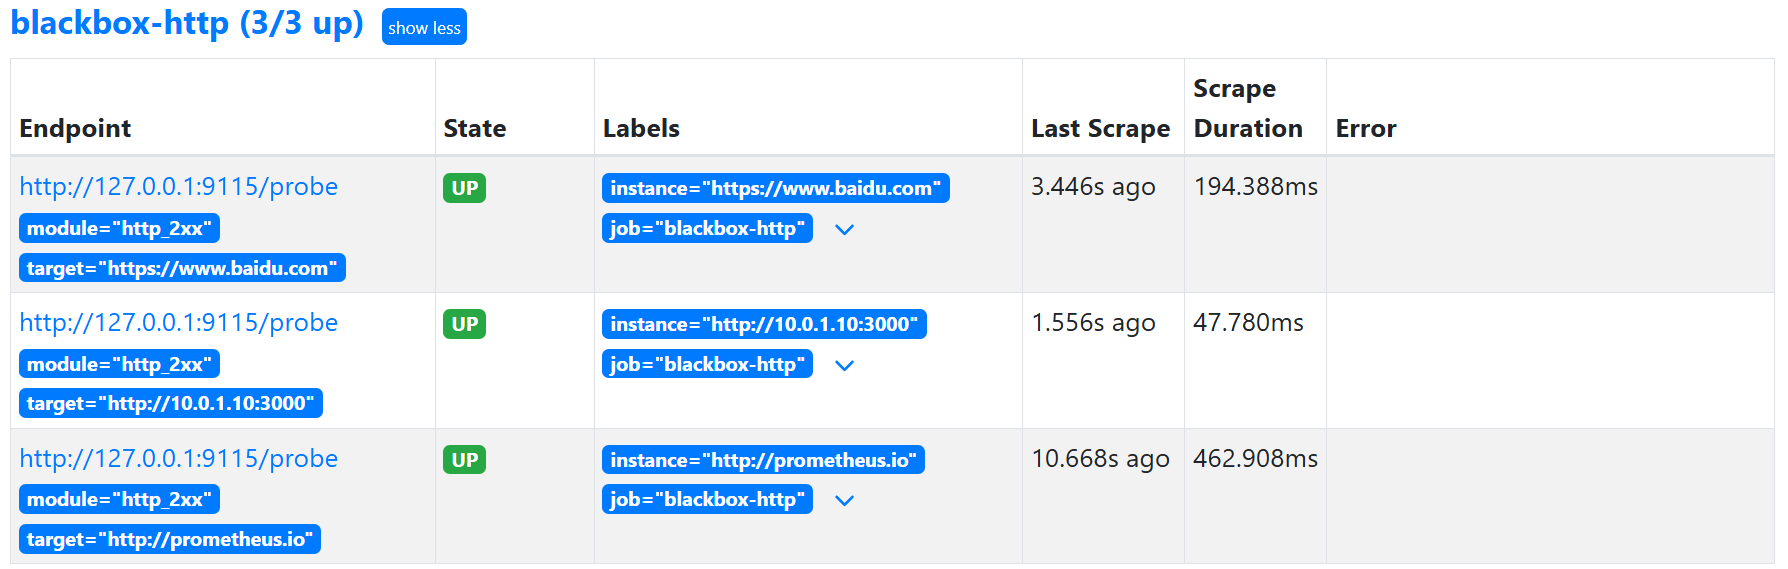
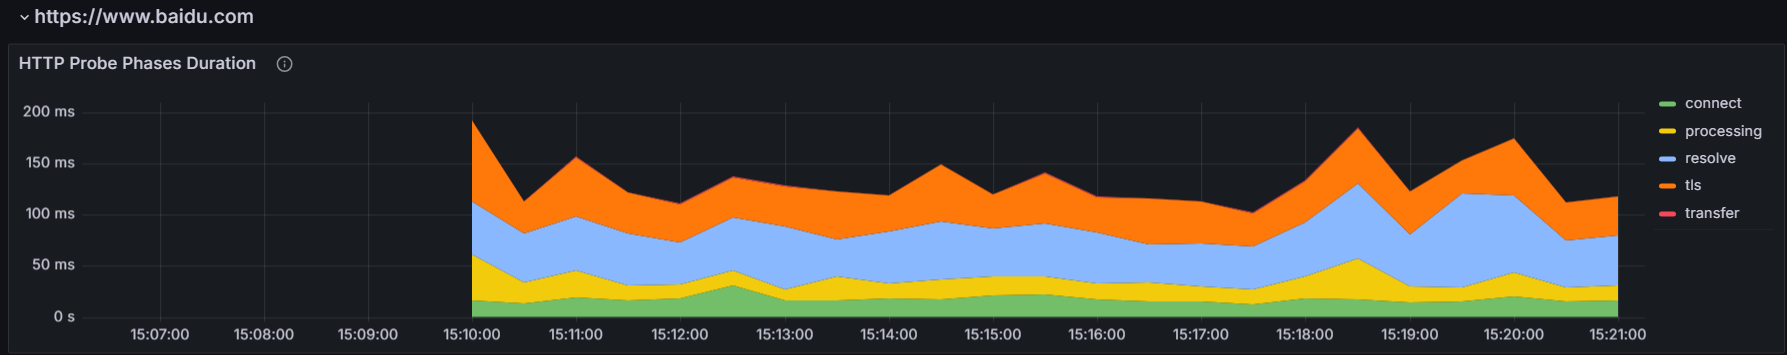
到grafana添加dashboard ID:13659
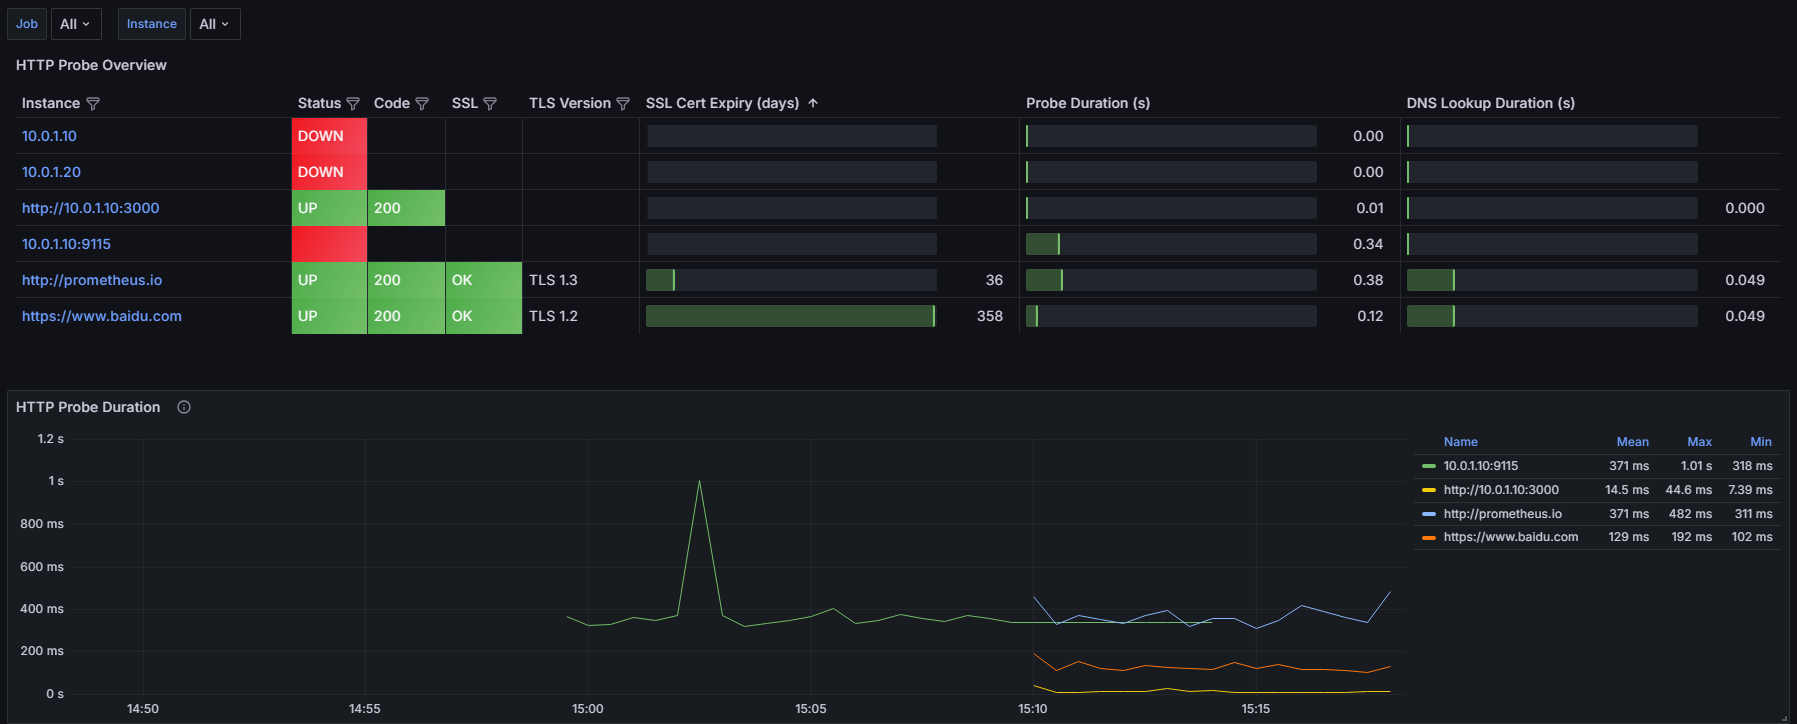
http trace中对于http各个状态的描述
- dns解析时间: DNSDone-DNSStart
- tls握手时间: gotConn - DNSDone
- tls connect连接时间: connectDone - DNSDone
- 非tls connect连接时间: gotConn - DNSDone
- processing 服务端处理时间: responseStart - gotConn
- transfer 数据传输时间: end - responseStart
黑盒探针http监控指标
- HTTP状态码:
probe_http_status_code表示 HTTP 响应的状态码,用于判断请求是否成功 11。 - 响应时间:
probe_http_duration_seconds表示 HTTP 请求各个阶段的处理耗时,例如连接、处理、解析、TLS 握手、数据传输等。 - SSL使用情况:
probe_http_ssl表示最终重定向是否使用了 SSL。 - 内容长度:
probe_http_content_length表示 HTTP 响应内容的长度。 - 重定向次数:
probe_http_redirects表示请求过程中发生重定向的次数。 - TLS版本信息:
probe_tls_version_info表示使用的 TLS 版本信息。 - SSL证书过期时间:
probe_ssl_earliest_cert_expiry表示 SSL 证书的最早过期时间。 - HTTP协议版本:
probe_http_version表示 HTTP 响应使用的协议版本。 - DNS查询耗时:
probe_dns_lookup_time_seconds表示 HTTP 拨测中的 DNS 查询耗时 。 - 拨测耗时:
probe_duration_seconds表示拨测耗时 。 - 拨测结果:
probe_success表示拨测是否成功。
3.3.3 黑盒探测ssh
查看target
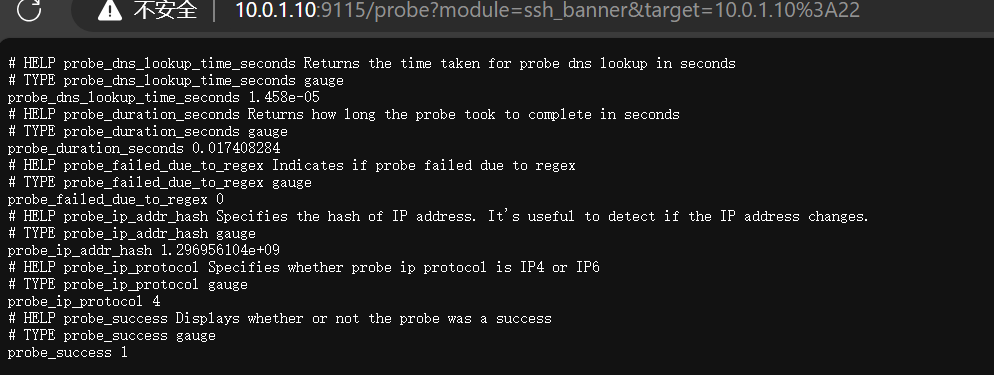
ssh探测过程说明
prometheus --> blackbox_exporter 使用配置 module: [ssh_banner] --> http://10.0.1.10:9115/probe?module=ssh_banner&target=10.0.1.10%3A22 --> 10.0.1.10:223.4 进程探测
3.4.1 部署进程探测process_exporter
去这里找最新版的下载。
Releases · ncabatoff/process-exporter (github.com)
wget https://github.com/ncabatoff/process-exporter/releases/download/v0.8.3/process-exporter-0.8.3.linux-amd64.tar.gz
tar xf process-exporter-0.8.3.linux-amd64.tar.gz -C /usr/local/
cd /usr/local/
mv process-exporter-0.8.3.linux-amd64/ process_exporter
vim /usr/lib/systemd/system/process_exporter.service
[Unit]
Description=process-exporter Exporter
Wants=network-online.target
After=network-online.target

[Service]
ExecStart=/usr/local/process_exporter/process-exporter -config.path=/usr/local/process_exporter/process-exporter.yaml
StandardOutput=syslog
StandardError=syslog
SyslogIdentifier=process-exporter
[Install]
WantedBy=default.target

vim /usr/local/process_exporter/process-exporter.yaml
process_names:
  - name: "{{.Comm}}"
    cmdline:
    - '.+'

systemctl enable process_exporter.service --now
3.4.2 process-exporter的配置
process_names是个数组,每个成员表示一个分组。
name是分组的名称,这里使用模版。cmdline用于对分组中的进程进行过滤,这里的正则表达式就表示过滤所有进程。
因此,上述配置文件的含义是:采集所有进程的指标数据,当遍历到某个进程时,获取该进程的进程名,然后放到进程名对应的分组。
name字段可以使用固定的字符串,也可以使用以下模版:
- {{.Comm}}:进程名
- {{.ExeBase}}:可执行文件的文件名,与进程的区别是,进程名有长度15的限制
- {{.ExeFull}}:可执行文件的全路径
- {{.Username}}:进程的有效用户名
- {{.Matches}}:用正则匹配cmdline等字段时得到的匹配项的map,例如下面的Cfgfile
- {{.PID}}:pid,使用pid表示这个组只会有这一个进程
- {{.StartTime}}:进程的起始时间
- {{.Cgroups}}:进程的cgoup,可以用于区分不同的容器
进行分组进程过滤除了使用cmdline字段,还可以使用comm和exe,分别表示进程名和二进制路径,并且遵循以下规则:
如果使用了多个字段,则必须都匹配,例如,如果既使用了comm,又使用了exe,两个过滤必须都满足
对于comm和exe,它们是字符串数组,并且是OR的关系。
对于cmdline,则是正则表达式数组,并且是AND的关系。
例如:
process_names:
  # 进程名过滤,超过15个字符会被截断
  - comm:
    - bash

  # argv[0],如果开头不是/,说明匹配进程名
  # 如果开头是/,则需要使用二进制路径全匹配
  - exe:
    - postgres
    - /usr/local/bin/prometheus

  # 如果使用多个字段进行匹配,则需要都匹配
  - name: "{{.ExeFull}}:{{.Matches.Cfgfile}}"
    exe:
    - /usr/local/bin/process-exporter
    cmdline:
    - -config.path\s+(?P<Cfgfile>\S+)
3.4.3 添加到Prometheus和exporter
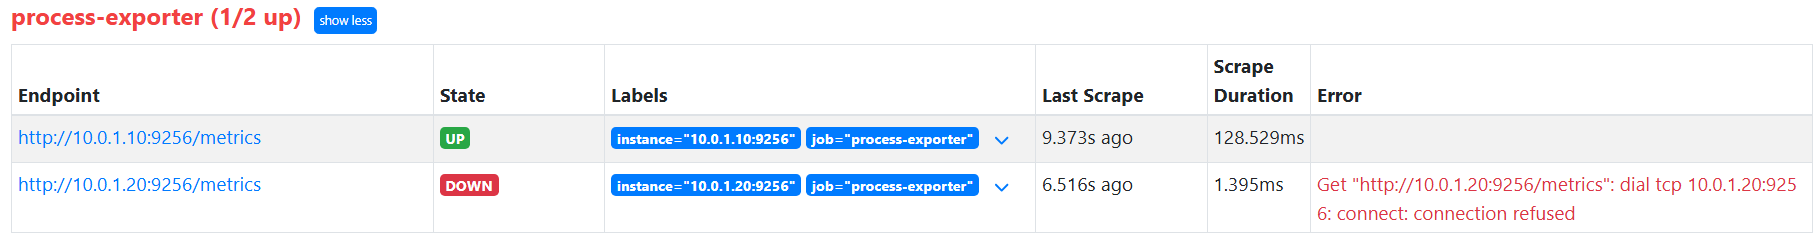
在Prometheus.yaml中添加job
  - job_name: process-exporter
    honor_timestamps: true
    scrape_interval: 15s
    scrape_timeout: 10s
    #metrics_path: /metrics
    #scheme: http
    static_configs:
    - targets:
      - 10.0.1.10:9256
      - 10.0.1.20:9256
查看target,因为没在Prome node02 创建exporter
在grafana中创建dashboard ID:4202
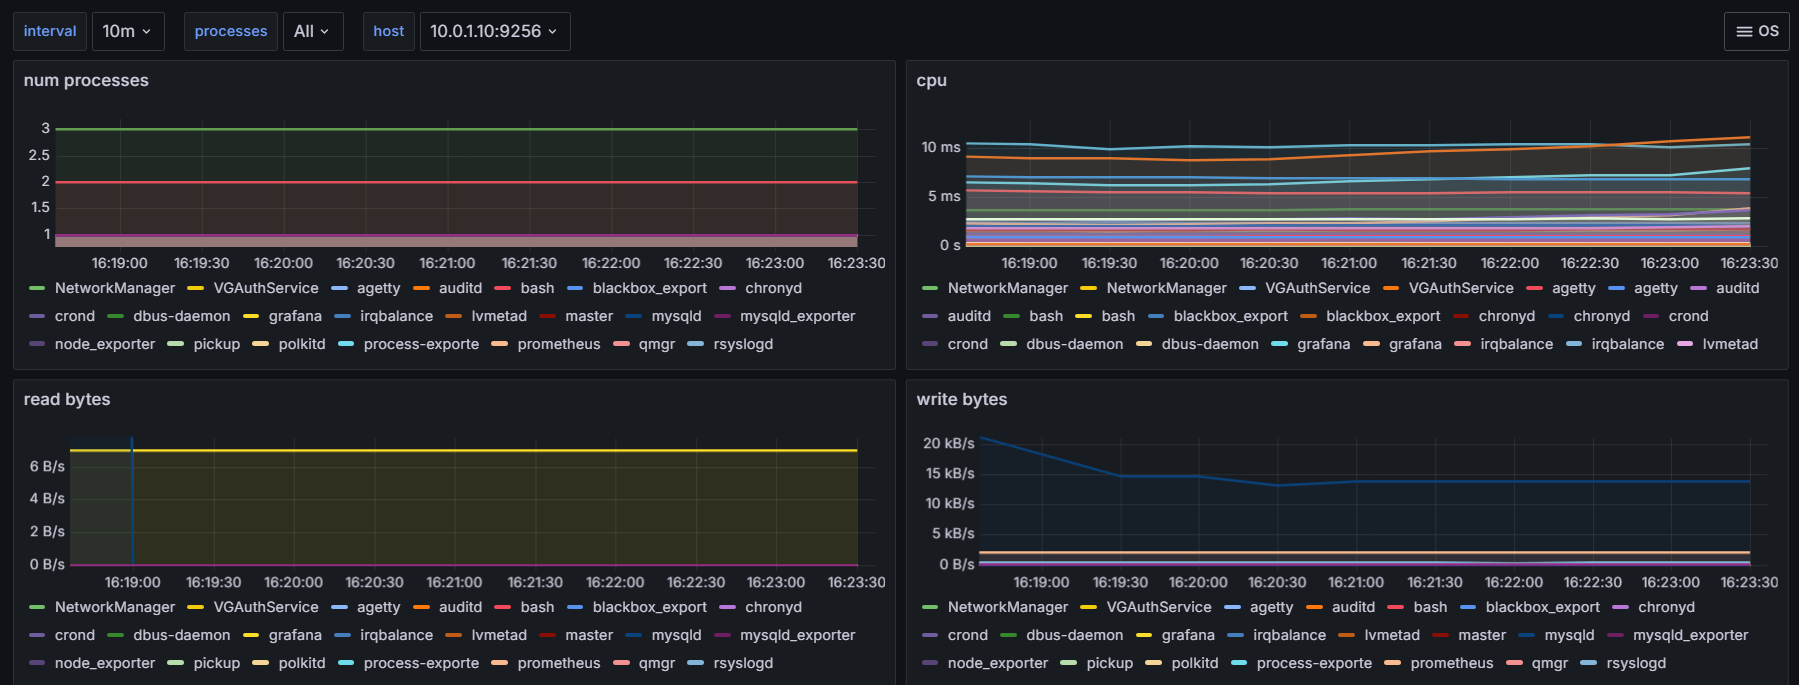
3.4.4 监控进程指标
在实际监控进程时,主要使用的指标就是cpu和内存。
process-exporter中进程的指标以namedprocess_namegroup开头:
namedprocess_namegroup_cpu_seconds_total:cpu使用时间,通过mode区分是user还是system
namedprocess_namegroup_memory_bytes:内存占用,通过memtype区分不同的占用类型
namedprocess_namegroup_num_threads:线程数
namedprocess_namegroup_open_filedesc:打开的文件句柄数
namedprocess_namegroup_read_bytes_total:进程读取的字节数
namedprocess_namegroup_thread_context_switches_total:线程上下文切换统计
namedprocess_namegroup_thread_count:线程数量统计
namedprocess_namegroup_thread_cpu_seconds_total:线程的cpu使用时间
namedprocess_namegroup_thread_io_bytes_total:线程的io


 8240
8240

 被折叠的 条评论
为什么被折叠?
被折叠的 条评论
为什么被折叠?
 到【灌水乐园】发言


