


环境准备:
1.安装prometheus
1.1下载
wget https://github.com/prometheus/prometheus/releases/download/v2.45.1/prometheus-2.45.1.linux-amd64.tar.gz
1.2解压
tar -zxvf prometheus-2.45.1.linux-amd64.tar.gz -C /home
mv /home/prometheus-2.45.1.linux-amd64 /home/prometheus
1.3创建prometheus.service
vim /usr/lib/systemd/system/prometheus.service [Unit] Description=Prometheus Server Documentation=https://prometheus.io/docs/introduction/overview/ After=network-online.target [Service] User=root Restart=on-failure ExecStart=/home/prometheus/prometheus \ --config.file=/home/prometheus/prometheus.yml \ --storage.tsdb.path=/home/prometheus/data [Install] WantedBy=multi-user.target
1.4载入配置启动
systemctl daemon-reload
systemctl start prometheus
systemctl enable prometheus
1.5验证
[root@gt-32 ~]# netstat -plntu |grep 9090
tcp6       0      0 :::9090                 :::*                    LISTEN      25105/prometheus
2.安装alertmanager
2.1下载
wget https://github.com/prometheus/alertmanager/releases/download/v0.24.0/alertmanager-0.24.0.linux-amd64.tar.gz
2.2解压
tar -zxvf alertmanager-0.24.0.linux-amd64.tar.gz -C /home/
mv /home/alertmanager-0.24.0.linux-amd64/ /home/alertmanager
2.3创建alertmanager.service
vim /usr/lib/systemd/system/alertmanager.service [Unit] Description=alertmanager Documentation=https://prometheus.io/ After=network.target StartLimitIntervalSec=0 [Service] Type=simple User=root Restart=on-failure ExecStart=/home/alertmanager/alertmanager --storage.path=/home/alertmanager/data/ \ --config.file=/home/alertmanager/alertmanager.yml [Install] WantedBy=default.target
2.4载入配置启动
systemctl daemon-reload
systemctl start alertmanager
systemctl enable alertmanager
2.5验证
[root@gt-32 ~]# netstat -plntu |grep 9094
tcp6       0      0 :::9094                 :::*                    LISTEN      26103/alertmanager
udp6       0      0 :::9094                 :::*                                26103/alertmanager
3.安装grafana
3.1下载
wget https://dl.grafana.com/enterprise/release/grafana-enterprise-10.2.0-1.x86_64.rpm
3.2安装
yum -y install grafana-enterprise-10.2.0-1.x86_64.rpm
3.3启动
systemctl start grafana-server
systemctl enable grafana-server
3.4验证
[root@gt-32 ~]# netstat -plntu |grep 3000
tcp6       0      0 :::3000                 :::*                    LISTEN      26665/grafana
4.安装node_exporter
4.1下载
wget https://github.com/prometheus/node_exporter/releases/download/v1.5.0/node_exporter-1.5.0.linux-amd64.tar.gz
4.2解压
tar -zxvf node_exporter-1.5.0.linux-amd64.tar.gz -C /home/
mv /home/node_exporter-1.5.0.linux-amd64/ /home/node_exporter
4.2创建node_exporter.service
vim /usr/lib/systemd/system/node_exporter.service [Unit] Description=node_exporter After=network.target [Service] ExecStart=/home/node_exporter/node_exporter\ --web.listen-address=:9100\ --collector.systemd\ --collector.systemd.unit-whitelist=(sshd|nginx).service\ --collector.processes\ --collector.tcpstat [Install] WantedBy=multi-user.target
4.3载入配置启动
systemctl daemon-reload
systemctl start node_exporter
systemctl enable node_exporter
4.4验证
[root@localhost node_exporter]# curl localhos:9100
<html>
                        <head><title>Node Exporter</title></head>
                        <body>
                        <h1>Node Exporter</h1>
                        <p><a href="/metrics">Metrics</a></p>
                        </body>
                        </html>

[root@localhost node_exporter]# netstat -plntu |grep 9100
tcp6       0      0 :::9100                 :::*                    LISTEN      1355/node_exporter
配置:
1.将node_exporter添加到Prometheus服务器
1.1修改prometheus.yml
cd /home/prometheus/ vim prometheus.yml # my global config global: scrape_interval: 15s # Set the scrape interval to every 15 seconds. Default is every 1 minute. evaluation_interval: 15s # Evaluate rules every 15 seconds. The default is every 1 minute. # scrape_timeout is set to the global default (10s). # Alertmanager configuration alerting: alertmanagers: - static_configs: - targets: # - alertmanager:9093 # Load rules once and periodically evaluate them according to the global 'evaluation_interval'. rule_files: # - "first_rules.yml" # - "second_rules.yml" # A scrape configuration containing exactly one endpoint to scrape: # Here it's Prometheus itself. scrape_configs: # The job name is added as a label `job=<job_name>` to any timeseries scraped from this config. - job_name: "prometheus" # metrics_path defaults to '/metrics' # scheme defaults to 'http'. static_configs: - targets: ["localhost:9090"] #添加node_exporter - job_name: "node_exporter" static_configs: - targets: ["192.168.33.57:9100"]
2.2通过promtool工具,检测配置文件是否正确
[root@gt-32 prometheus]# ./promtool check config prometheus.yml
Checking prometheus.yml
 SUCCESS: prometheus.yml is valid prometheus config file syntax
2.3热加载配置:
curl -X POST http://localhost:9090/-/reload
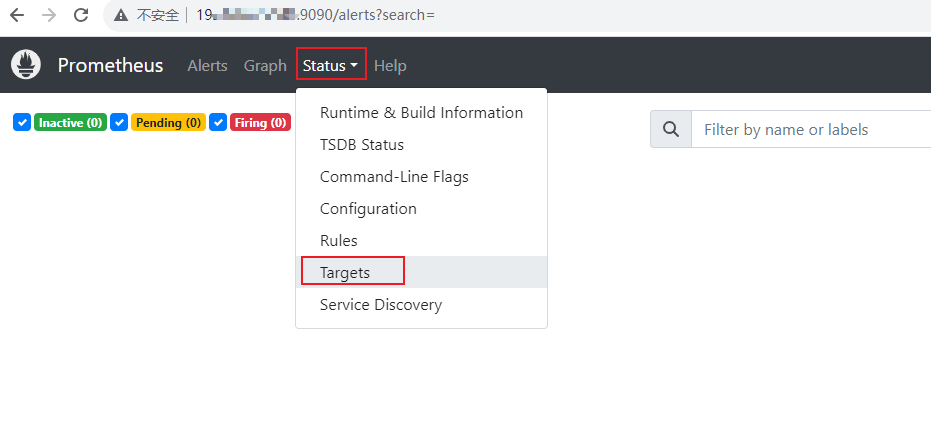
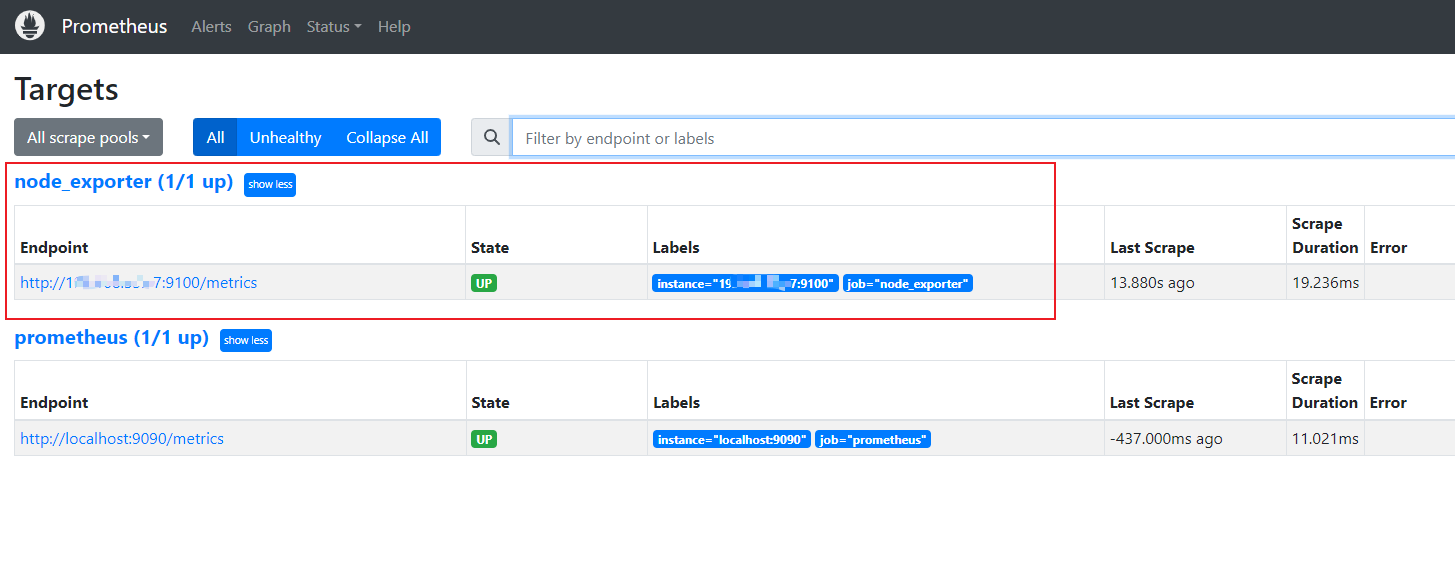
2.4验证
2.grafana配置
http://ip:3000/ 用户名密码默认 admin

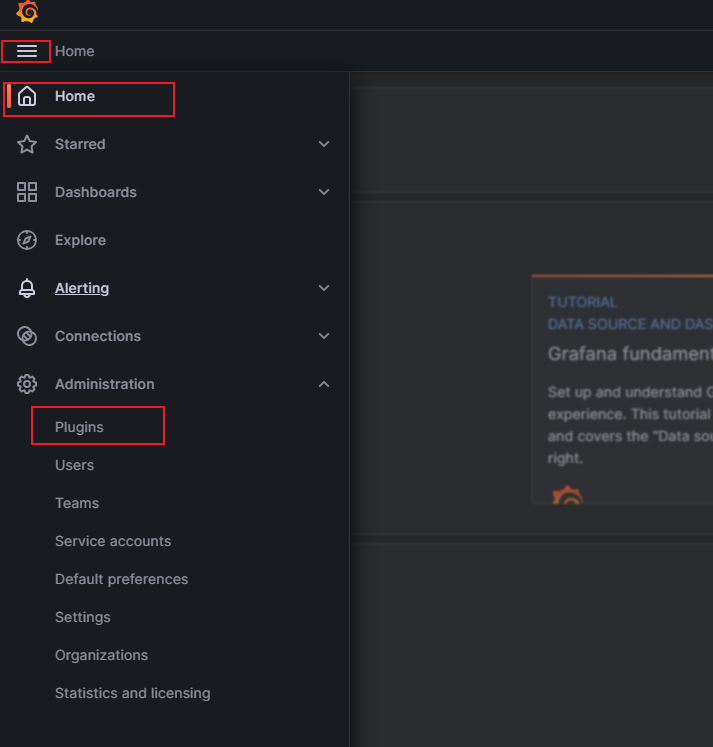
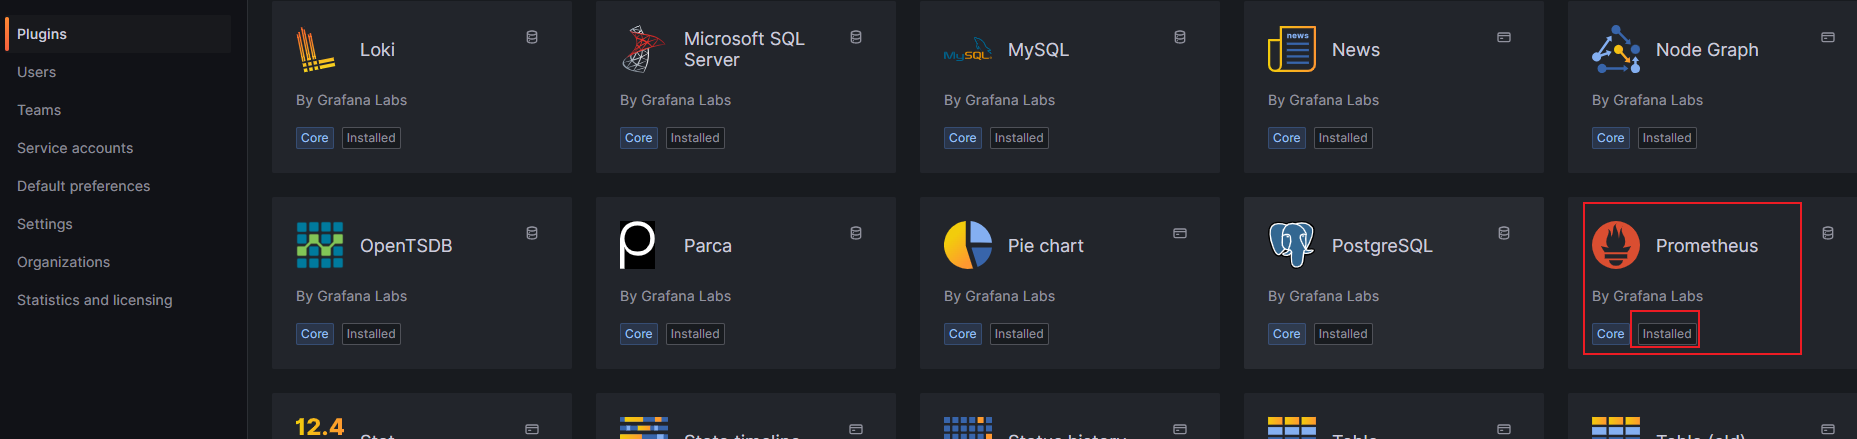
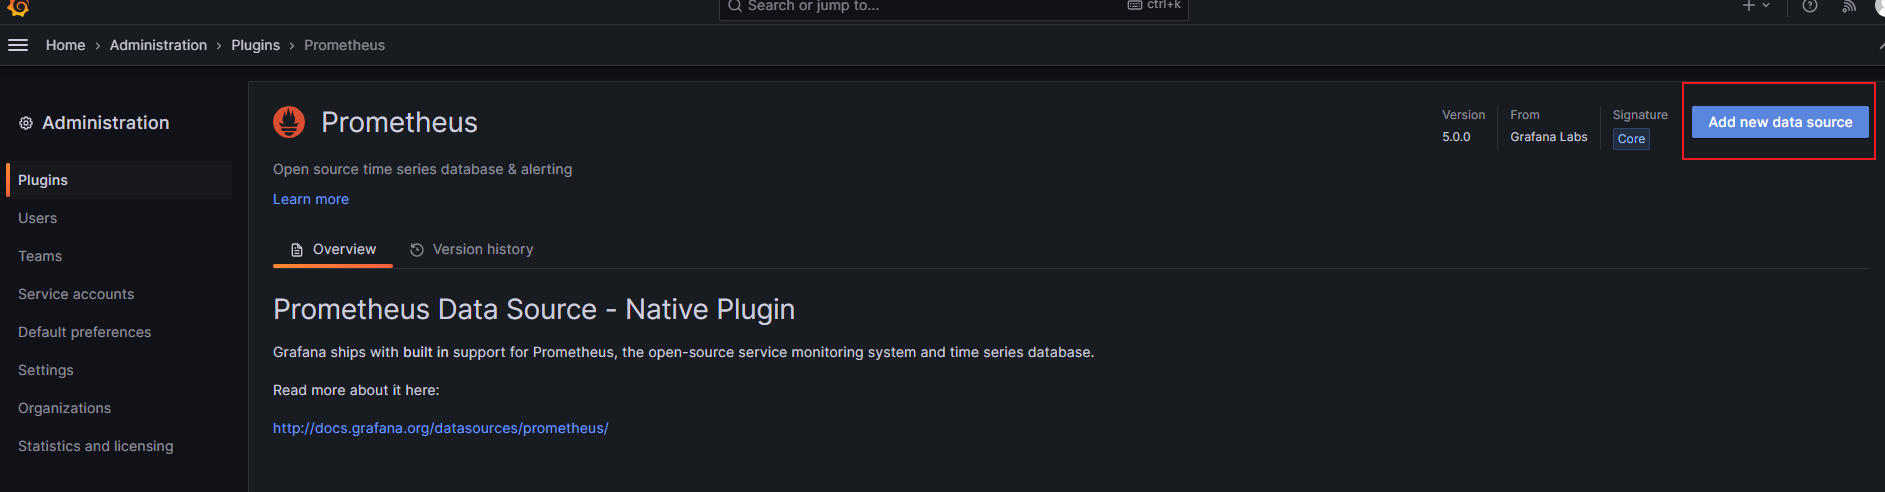
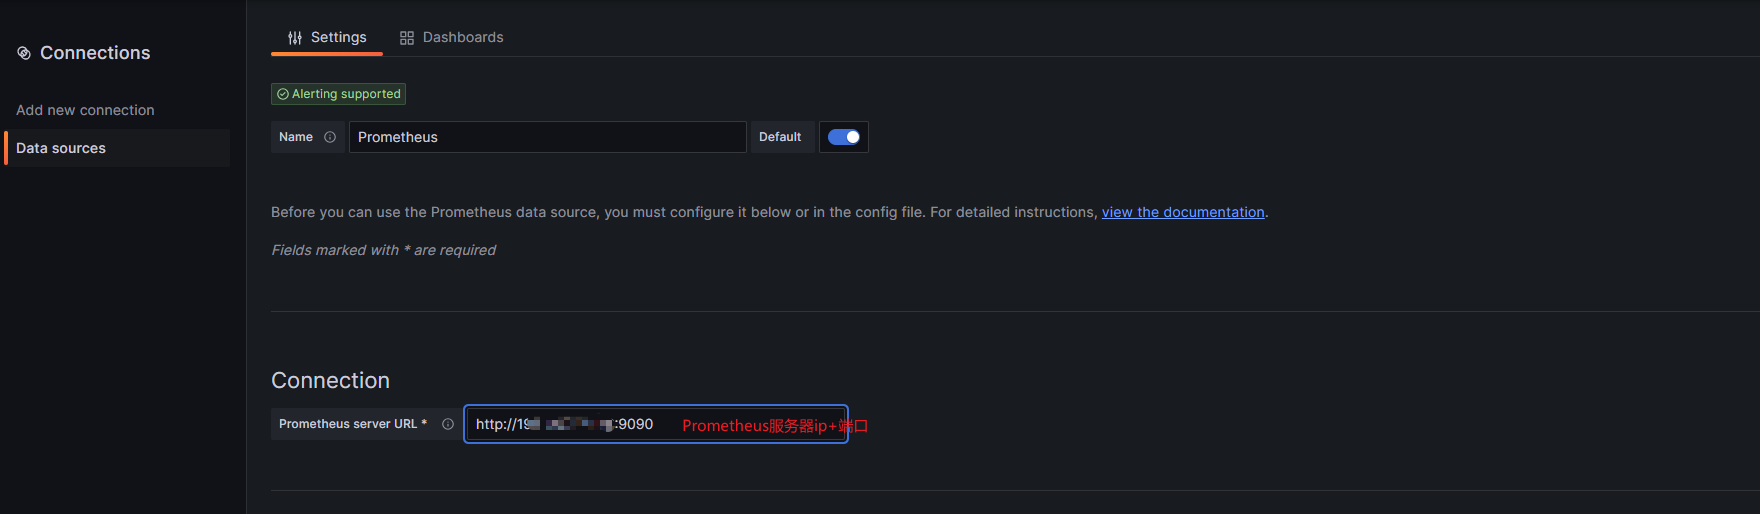
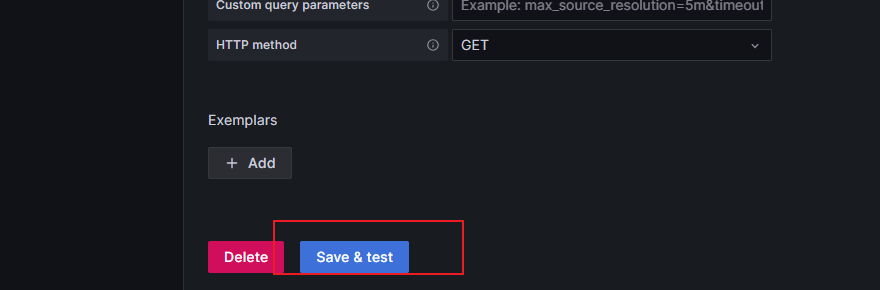
2.1添加Prometheus数据源
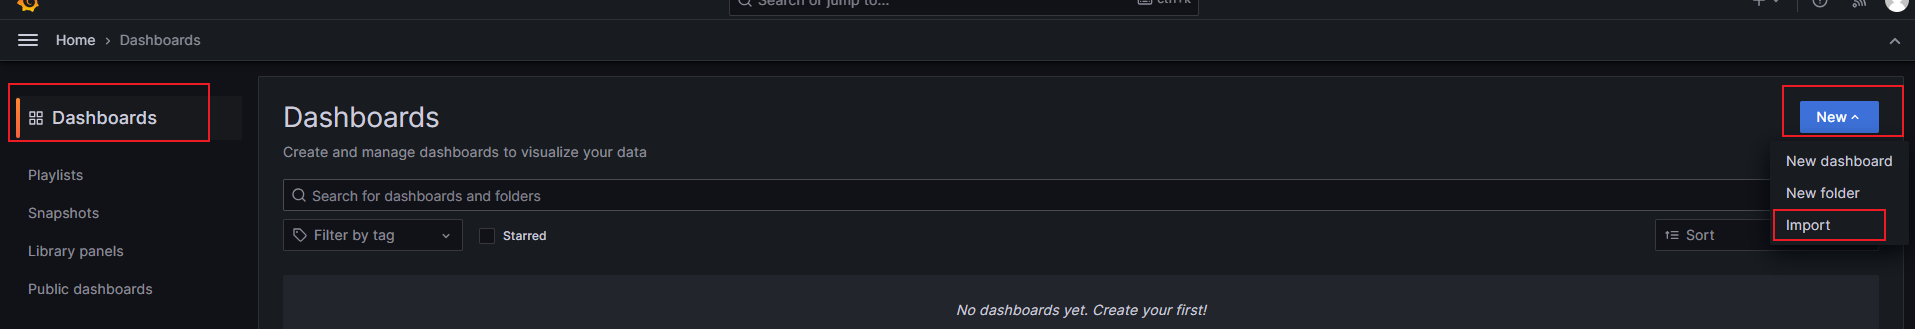
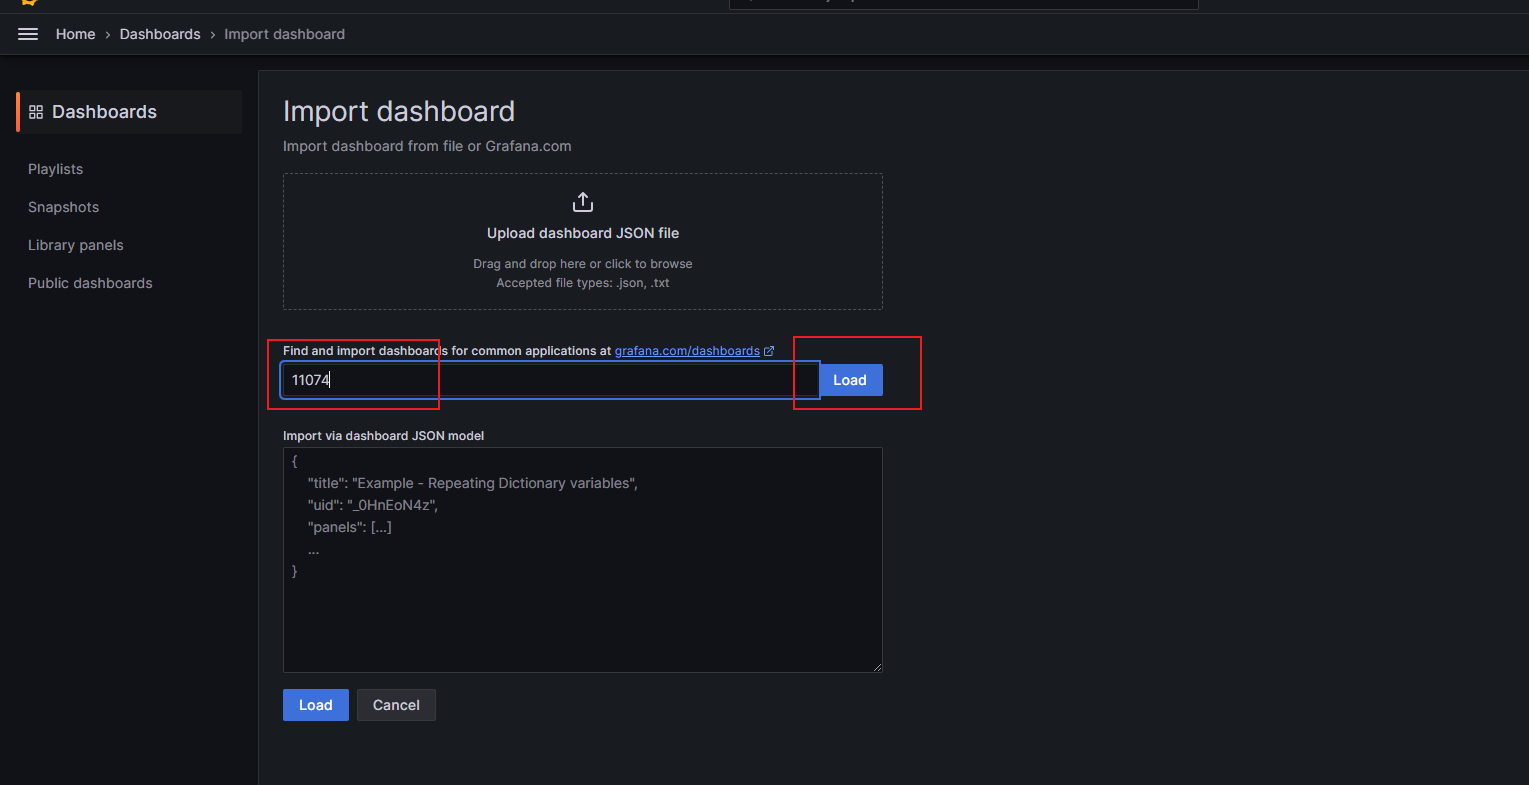
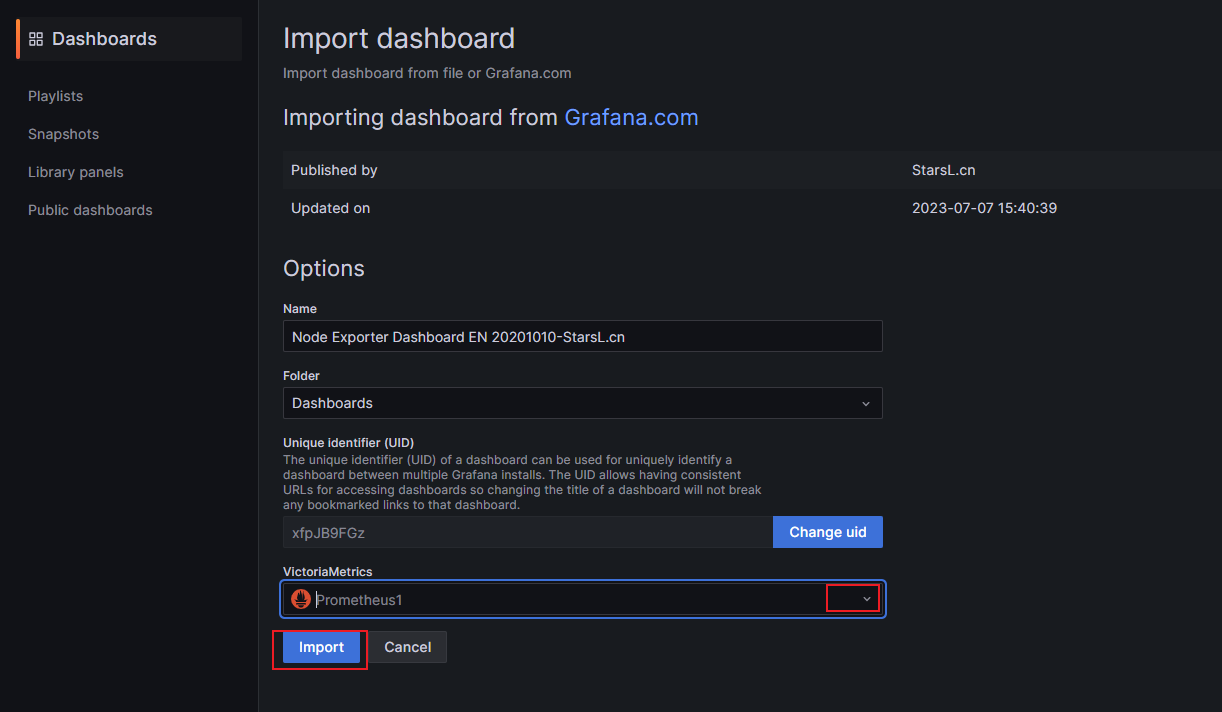
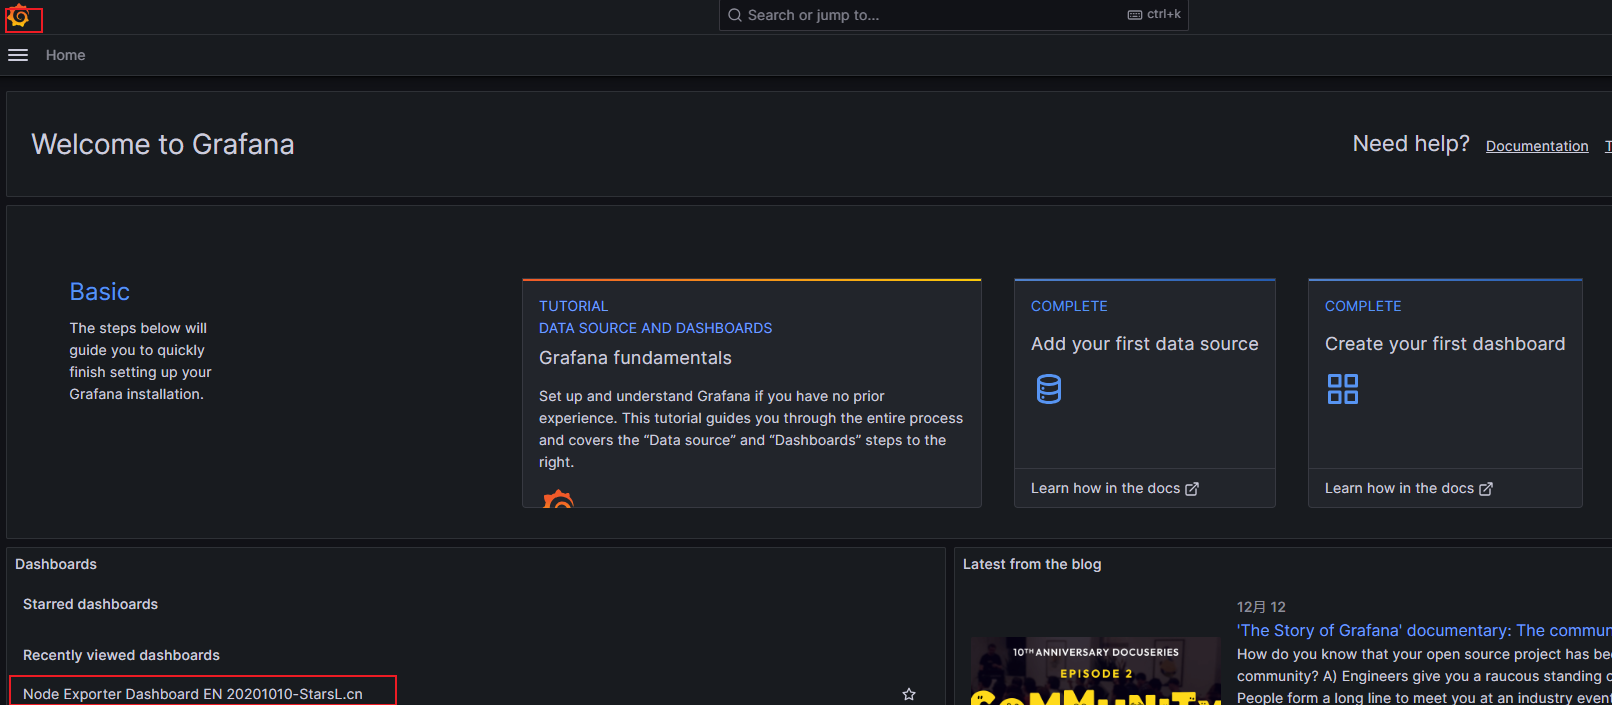
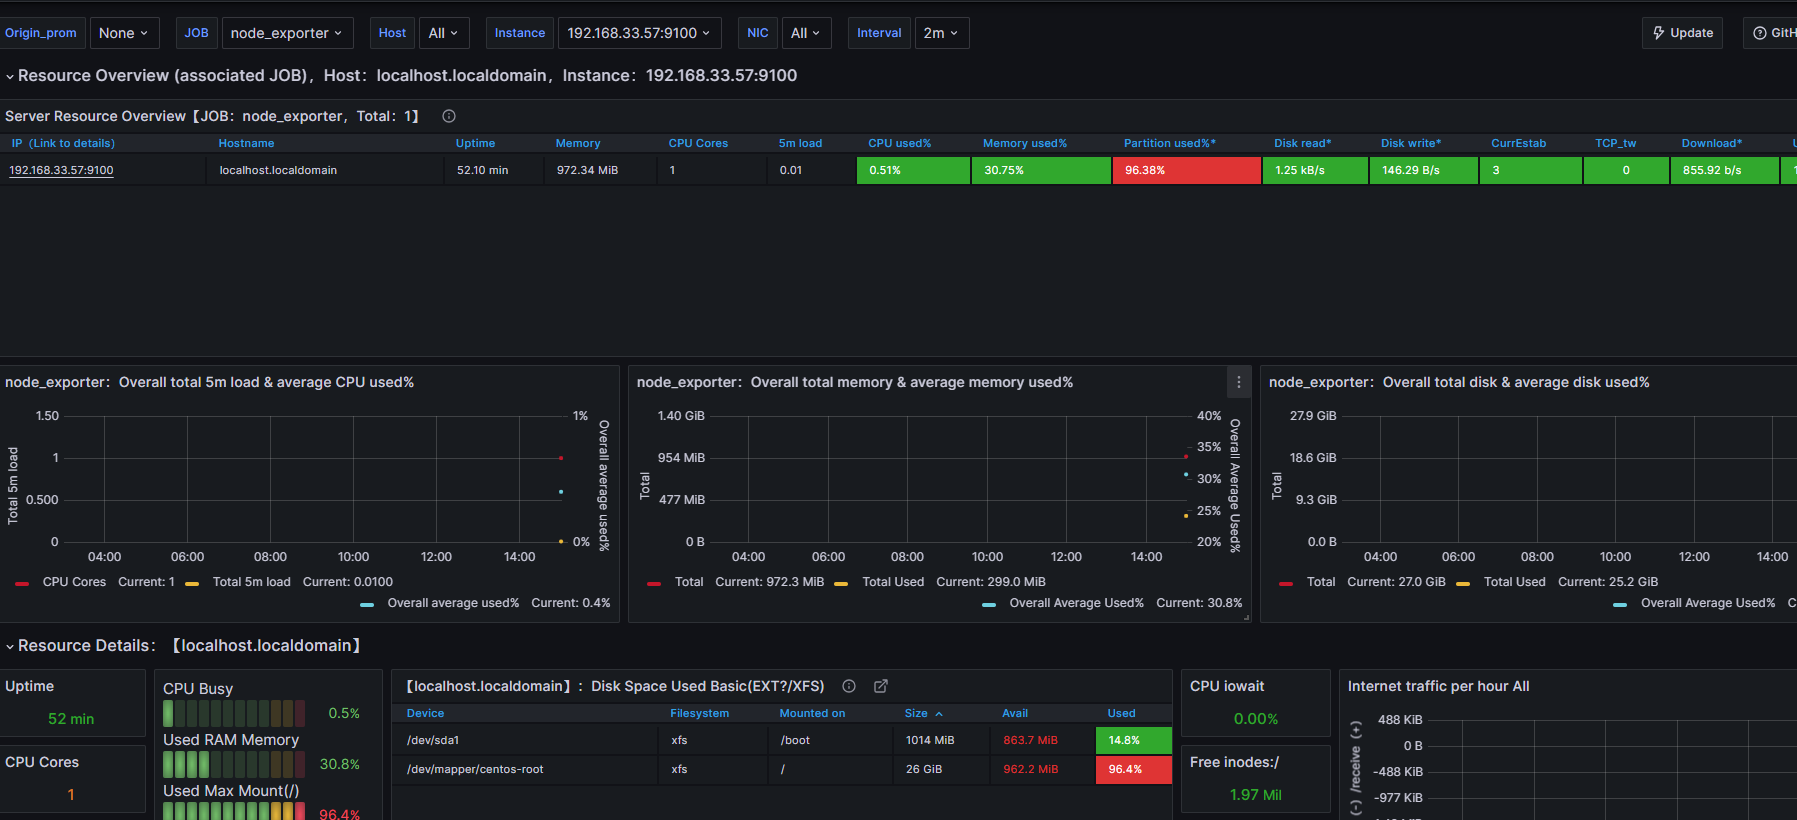
2.2添加dashboard
3.alertmanager告警
3.1vim prometheus.yml
# my global config global: scrape_interval: 15s # Set the scrape interval to every 15 seconds. Default is every 1 minute. evaluation_interval: 15s # Evaluate rules every 15 seconds. The default is every 1 minute. # scrape_timeout is set to the global default (10s). # Alertmanager configuration alerting: alertmanagers: - static_configs: - targets: - 192.168.x.x:9093 # Alertmanager 地址 # Load rules once and periodically evaluate them according to the global 'evaluation_interval'. rule_files: # - "first_rules.yml" # - "second_rules.yml" - "rule/*.yml" # 告警规则 # A scrape configuration containing exactly one endpoint to scrape: # Here it's Prometheus itself. scrape_configs: # The job name is added as a label `job=<job_name>` to any timeseries scraped from this config. - job_name: "prometheus" # metrics_path defaults to '/metrics' # scheme defaults to 'http'. static_configs: - targets: ["localhost:9090"] - job_name: "node_exporter" static_configs: - targets: ["192.168.33.57:9100"]
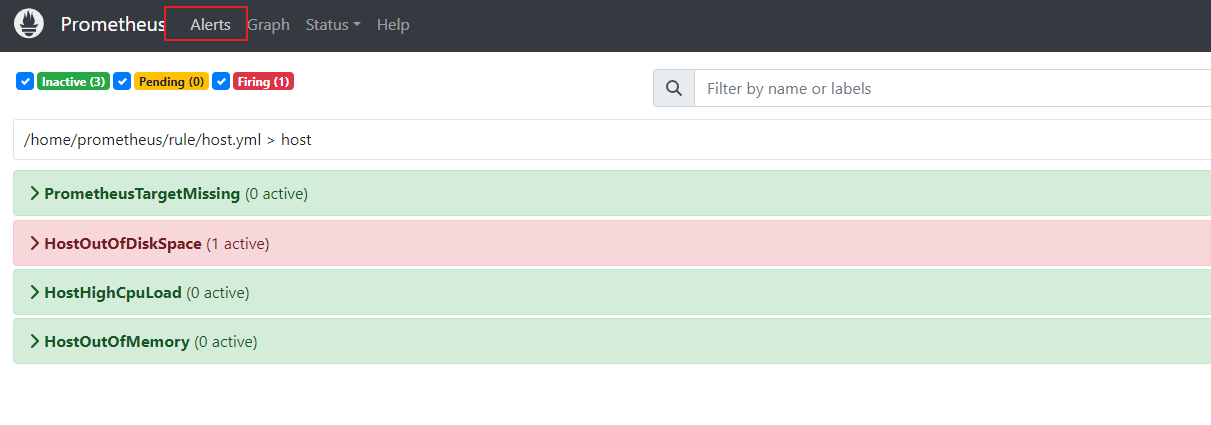
3.2创建告警规则
vim /home/prometheus/rule/host.yml
groups:
- name: host
rules:
- alert: PrometheusTargetMissing
expr: up == 0
for: 1m
labels:
severity: critical
annotations:
summary: 服务器宕机 (instance {{ $labels.instance }})
description: "服务器宕机,或者node exporter未启动\n VALUE = {{ $value }}\n LABELS = {{ $labels }}"
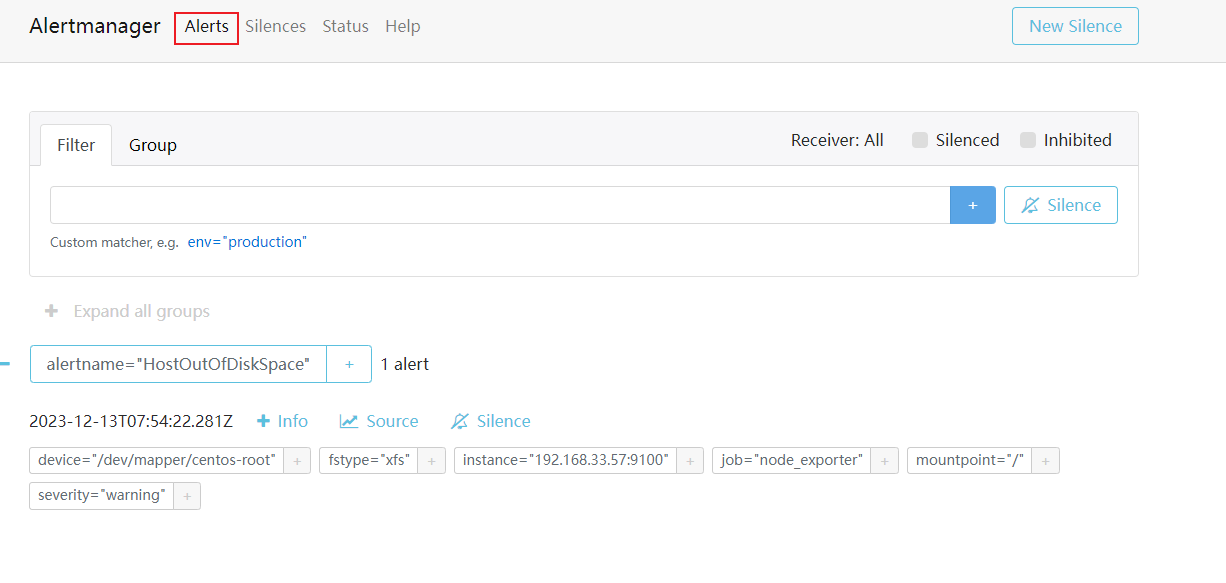
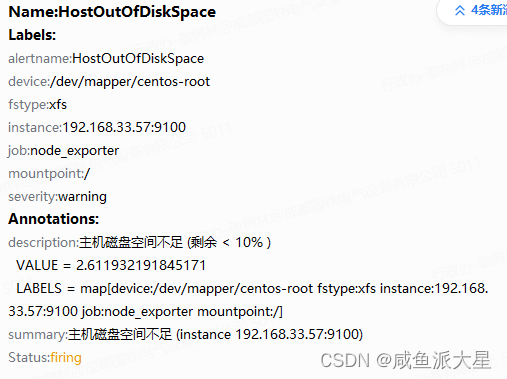
- alert: HostOutOfDiskSpace
expr: (node_filesystem_avail_bytes * 100) / node_filesystem_size_bytes < 5 and ON (instance, device, mountpoint) node_filesystem_readonly == 0
for: 10s
labels:
severity: warning
annotations:
summary: 主机磁盘空间不足 (instance {{ $labels.instance }})
description: "主机磁盘空间不足 (剩余 < 10% )\n VALUE = {{ $value }}\n LABELS = {{ $labels }}"
- alert: HostHighCpuLoad
expr: 100 - (avg by(instance) (rate(node_cpu_seconds_total{mode="idle"}[2m])) * 100) > 80
for: 0m
labels:
severity: warning
annotations:
summary: CPU使用率过高! (instance {{ $labels.instance }})
description: "CPU使用率超过 > 80%\n VALUE = {{ $value }}\n LABELS = {{ $labels }}"
- alert: HostOutOfMemory
expr: node_memory_MemAvailable_bytes / node_memory_MemTotal_bytes * 100 < 10
for: 2m
labels:
severity: warning
annotations:
summary: 内存使用率过高 (instance {{ $labels.instance }})
description: "内存使用率过高 (剩余< 10% )\n VALUE = {{ $value }}\n LABELS = {{ $labels }}"
3.3重启服务
systemctl restart prometheus
3.4配置报警
vim /home/alertmanager/alertmanager.yml # global:全局配置,主要配置告警方式,如邮件、webhook等。 global: resolve_timeout: 15s templates: - '/home/alertmanager/*.tmpl' # Alertmanager告警模板 route: group_by: ['env','instance','type','group','job','alertname'] group_wait: 15s # 当收到告警的时候,等待15秒看是否还有告警,如果有就一起发出去 group_interval: 15s # 发送警告间隔时间 repeat_interval: 30s # 重复报警的间隔时间 receiver: 'wechat' receivers: - name: 'wechat' webhook_configs: - url: 'http://192.168.32.146:8080/adapter/wx' # webhook地址 send_resolved: true inhibit_rules: - source_match: severity: 'critical' target_match: severity: 'warning' equal: ['env','instance','type','group','job','alertname']
3.5检查配置文件
[root@gt-32 alertmanager]# ./amtool check-config alertmanager.yml
Checking 'alertmanager.yml'  SUCCESS
Found:
 - global config
 - route
 - 0 inhibit rules
 - 1 receivers
 - 1 templates
  SUCCESS
3.6创建告警模板
mkdir -p /home/alertmanager/template
vim /home/alertmanager/template/test.tmpl
{{ define "wechat.default.message" }}
{{- if gt (len .Alerts.Firing) 0 -}}
{{- range $index, $alert := .Alerts -}}
{{- if eq $index 0 }}
========= 监控报警 =========
告警状态:{{ .Status }}
告警级别:{{ .Labels.severity }}
告警类型:{{ $alert.Labels.alertname }}
故障主机: {{ $alert.Labels.instance }}
告警主题: {{ $alert.Annotations.summary }}
告警详情: {{ $alert.Annotations.message }}{{ $alert.Annotations.description}};
触发阀值:{{ .Annotations.value }}
故障时间: {{ ($alert.StartsAt.Add 28800e9).Format "2006-01-02 15:04:05" }}
========= = end = =========
{{- end }}
{{- end }}
{{- end }}
{{- if gt (len .Alerts.Resolved) 0 -}}
{{- range $index, $alert := .Alerts -}}
{{- if eq $index 0 }}
========= 异常恢复 =========
告警类型:{{ .Labels.alertname }}
告警状态:{{ .Status }}
告警主题: {{ $alert.Annotations.summary }}
告警详情: {{ $alert.Annotations.message }}{{ $alert.Annotations.description}};
故障时间: {{ ($alert.StartsAt.Add 28800e9).Format "2006-01-02 15:04:05" }}
恢复时间: {{ ($alert.EndsAt.Add 28800e9).Format "2006-01-02 15:04:05" }}
{{- if gt (len $alert.Labels.instance) 0 }}
实例信息: {{ $alert.Labels.instance }}
{{- end }}
========= = end = =========
{{- end }}
{{- end }}
{{- end }}
{{- end }}
4.webhook
docker run --name webhook-adapter -p 8080:80 -d guyongquan/webhook-adapter --adapter=/app/prometheusalert/wx.js=/wx=xx #企业微信机器人地址


 1092
1092


 被折叠的 条评论
为什么被折叠?
被折叠的 条评论
为什么被折叠?
 到【灌水乐园】发言


