


项目需求:
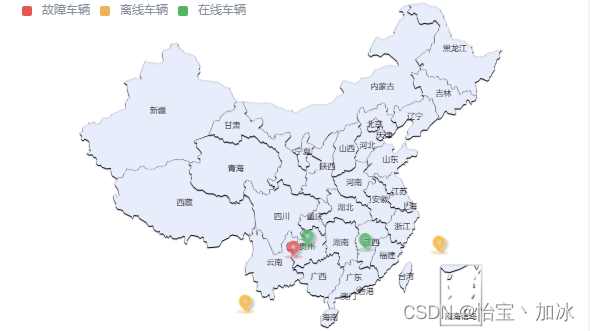
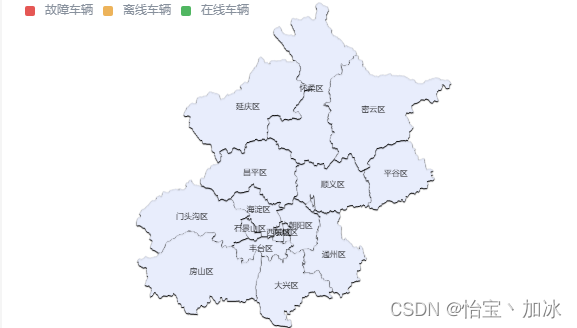
两大类,一个中国地图, 点击省份时, 绘制省份地图, 另一个是世界地图, 地图上存在车辆点可查看车辆信息.
中国地图效果:
省份地图效果(如北京):
世界地图效果:

不管是vue还是react用法是一样的!
首先需要准备各省份地图,中国地图及世界地图json数据.
1.中国地图及各省份地图json数据获取链接
2.世界地图json数据获取可私聊不无偿
话不多说上代码(本案例使用的react)!
1.下载echarts
import chinaJson from '@/tools/map/china.json' //中国地图数据
import worldJson from '@/tools/map/world.json' //世界地图数据
import mapDriver from '@/tools/map/mapDriver.js' //中国各个省份映射表
import * as echarts from 'echarts' //全局引入 ,可按需引入
2. 配置echatrs options
 // options
        let options = {
            tooltip: {        // 提示框组件
                show: true,     // 显示提示框组件
                trigger: "item",     // 触发类型
                triggerOn: "mousemove",  // 出发条件
                formatter: "名称:{b}<br/>坐标:{c}"
            },
            series,  // 数据
            geo: {
                map: name || 'china',  // 引入地图 省份或者 国家
                roam: false, //开启鼠标缩放和漫
                zoom: 1.23,
                label: {
                    normal: {
                        //静态的时候展示样式
                        show: name === 'world' ? false : true, //是否显示地图省份得名称
                        textStyle: {
                            color: "#000",
                            fontSize: 8,
                            fontFamily: "Arial"
                        }
                    },
                    emphasis: {  // 高亮状态下的样式
                        //动态展示的样式
                        show: name === 'world' ? false : true,
                        color: "#fff"
                    }
                },
                itemStyle: {   // 地图区域的多边形 图形样式。
                    normal: {
                        areaColor: "rgb(231,237,252)",
                        borderWidth: 0.5, //设置外层边框
                        shadowBlur: 1,
                        shadowOffsetY: 1,
                        shadowOffsetX: 0,
                        // shadowColor: "#01012a",
                        borderColor: 'rgba(0, 0, 0, 0.1)',
                    },
                    emphasis: {
                        areaColor: "rgb(194,209,254)",
                        shadowOffsetX: 0,
                        shadowOffsetY: 0,
                        shadowBlur: 5,
                        borderWidth: 0,
                        shadowColor: "rgba(0, 0, 0, 0.5)"
                    }
                }
            },
            visualMap: {
                // 设置地图范围值显示的颜色
                selectedMode: false, // 不能选择
                hoverLink: false, // 取消鼠标移入效果
                textStyle: {
                    color: '#86909C',
                    fontSize: 12
                },
                orient: 'horizontal',
                itemGap: 10,
                itemWidth: 10,
                itemHeight: 10,
                pieces: [
                    {
                        gt: 0.9,
                        lte: 1,
                        label: '在线车辆',
                        color: '#41B75F'
                    },
                    {
                        gte: 0.8,
                        lte: 0.9,
                        label: '离线车辆',
                        color: '#F3B153'
                    },
                    {
                        lt: 0.8,
                        label: '故障车辆',
                        color: '#EE5050'
                    }
                ],
                top: 0,
                left: 0
            }
        }
3.初始化方法
//初始化地图
    let initMap = () => {
        echarts.registerMap("china", chinaJson)
        changeOptions("china")
        let chart = echarts.init(chartRef.current)
        setMyChart(chart)
        myChartRef.current = chart
        myChartRef.current.setOption(distributionOptionsRef.current)
        //点击事件
        myChartRef.current.on("click", chinaParam => {
            let idx = mapDriver.provincesText.findIndex(it => it.indexOf(chinaParam.name) !== -1)
            let code = mapDriver.provinces[idx] || 100000
            getProvinceMapOpt(code, mapDriver.provincesName[idx])
        })
        window.onresize = function () {
            myChartRef.current.resize()
        }
    }
4. 切换省份方法
//显示各省地图
    const getProvinceMapOpt = async (provinceAlphabet, name) => {
        let res = await api.getAxiosData(`province/${provinceAlphabet}`)
        if (res) {
            echarts.registerMap(name, res)
            changeOptions(name)
            myChartRef.current.setOption(distributionOptionsRef.current, true)
        }
    }
5. 切换options方法
let changeOptions = (name = 'china') => {
        // 经纬度数据
        const seriesList = [
            {
                icon: require('@/assets/img/green-dot.png'),
                name: "在线车辆",
                data: [
                    {
                        value: [106.9, 27.7],
                        itemStyle: { color: '#41b75f' }
                    },
                    {
                        value: [115.29, 27.32],
                        itemStyle: { color: '#41b75f' }
                    }
                ]
            },
            {
                icon: require('@/assets/img/yellow-dot.png'),
                name: "离线车辆",
                data: [
                    {
                        value: [126.04, 27.03],
                        itemStyle: { color: 'rgb(243, 177, 83)' }
                    },
                    {
                        value: [97.82, 20.58],
                        itemStyle: { color: 'rgb(243, 177, 83)' }
                    }
                ]
            },
            {
                icon: require('@/assets/img/red-dot.png'),
                name: "故障车辆",
                data: [
                    {
                        value: [104.82, 26.58],
                        itemStyle: { color: 'rgb(238, 80, 80)' }
                    }
                ]
            }
        ]
        // 图标
        const series = seriesList.map(v => {
            return {
                type: "scatter", //配置显示方式为用户自定义
                coordinateSystem: "geo",
                symbol: "image://" + v.icon,
                symbolSize: 20,
                data: v.data
            }
        })

        // options
        let options = {
            tooltip: {        // 提示框组件
                show: true,     // 显示提示框组件
                trigger: "item",     // 触发类型
                triggerOn: "mousemove",  // 出发条件
                formatter: "名称:{b}<br/>坐标:{c}"
            },
            series,  // 数据
            geo: {
                map: name || 'china',  // 引入地图 省份或者 国家
                roam: false, //开启鼠标缩放和漫
                zoom: 1.23,
                label: {
                    normal: {
                        //静态的时候展示样式
                        show: name === 'world' ? false : true, //是否显示地图省份得名称
                        textStyle: {
                            color: "#000",
                            fontSize: 8,
                            fontFamily: "Arial"
                        }
                    },
                    emphasis: {  // 高亮状态下的样式
                        //动态展示的样式
                        show: name === 'world' ? false : true,
                        color: "#fff"
                    }
                },
                itemStyle: {   // 地图区域的多边形 图形样式。
                    normal: {
                        areaColor: "rgb(231,237,252)",
                        borderWidth: 0.5, //设置外层边框
                        shadowBlur: 1,
                        shadowOffsetY: 1,
                        shadowOffsetX: 0,
                        // shadowColor: "#01012a",
                        borderColor: 'rgba(0, 0, 0, 0.1)',
                    },
                    emphasis: {
                        areaColor: "rgb(194,209,254)",
                        shadowOffsetX: 0,
                        shadowOffsetY: 0,
                        shadowBlur: 5,
                        borderWidth: 0,
                        shadowColor: "rgba(0, 0, 0, 0.5)"
                    }
                }
            },
            visualMap: {
                // 设置地图范围值显示的颜色
                selectedMode: false, // 不能选择
                hoverLink: false, // 取消鼠标移入效果
                textStyle: {
                    color: '#86909C',
                    fontSize: 12
                },
                orient: 'horizontal',
                itemGap: 10,
                itemWidth: 10,
                itemHeight: 10,
                pieces: [
                    {
                        gt: 0.9,
                        lte: 1,
                        label: '在线车辆',
                        color: '#41B75F'
                    },
                    {
                        gte: 0.8,
                        lte: 0.9,
                        label: '离线车辆',
                        color: '#F3B153'
                    },
                    {
                        lt: 0.8,
                        label: '故障车辆',
                        color: '#EE5050'
                    }
                ],
                top: 0,
                left: 0
            }
        }
        setDistributionOptions(options)
        distributionOptionsRef.current = options
    }
6. 切换世界及中国地图方法
//切换地图类型 type => 'china' || 'world'
    let changeMapType = (type) => {
        let json = type === 'china' ? chinaJson : worldJson
        echarts.registerMap(type, json)
        changeOptions(type)
        myChartRef.current.setOption(distributionOptionsRef.current, true)
    }
7. mapDriver.js
const provinces = ['310000', '130000', '140000', '150000', '210000', '220000', '230000', '320000', '330000', '340000', '350000', '360000', '370000', '410000', '420000', '430000', '440000', '450000', '460000', '510000', '520000', '530000', '540000', '610000', '620000', '630000', '640000', '650000', '110000', '120000', '500000', '810000', '820000', '710000'];
const provincesText = ['上海', '河北省', '山西省', '内蒙古自治区', '辽宁省', '吉林省', '黑龙江省', '江苏省', '浙江省', '安徽省', '福建省', '江西省', '山东省', '河南省', '湖北省', '湖南省', '广东省', '广西省', '海南省', '四川省', '贵州省', '云南省', '西藏自治区', '陕西省', '甘肃省', '青海省', '宁夏回族自治区', '新疆维吾尔自治区', '北京市', '天津市', '重庆市', '香港', '澳门', '台湾省'];
const provincesName = ['shanghai', 'hebei', 'shanxi', 'neimenggu', 'liaoning', 'jilin', 'heilongjiang', 'jiangsu', 'zhejiang', 'anhui', 'fujian', 'jiangxi', 'shandong', 'henan', 'hubei', 'hunan', 'guangdong', 'guangxi', 'hainan', 'sichuan', 'guizhou', 'yunnan', 'xizang', 'shanxi1', 'gansu', 'qinghai', 'ningxia', 'xinjiang', 'beijing', 'tianjin', 'chongqing', 'xianggang', 'aomen', 'taiwan'];

const mapJson = {provinces, provincesText, provincesName}
export default mapJson
8.完整代码奉上
import chinaJson from '@/tools/map/china.json'
import worldJson from '@/tools/map/world.json'
import mapDriver from '@/tools/map/mapDriver.js'
import * as echarts from 'echarts'; //全局引入 ,可按需引入
import { useEffect, useRef, useState, forwardRef, useImperativeHandle } from 'react';
import api from '@/api/index'

const Map = forwardRef((props, ref) => {
    const chartRef = useRef()

    //echart实例
    let [myChart, setMyChart] = useState(null)
    let myChartRef = useRef()
    //地图配置对象
    let [distributionOptions, setDistributionOptions] = useState('')
    let distributionOptionsRef = useRef()

    let changeOptions = (name = 'china') => {
        // 经纬度数据
        const seriesList = [
            {
                icon: require('@/assets/img/green-dot.png'),
                name: "在线车辆",
                data: [
                    {
                        value: [106.9, 27.7],
                        itemStyle: { color: '#41b75f' }
                    },
                    {
                        value: [115.29, 27.32],
                        itemStyle: { color: '#41b75f' }
                    }
                ]
            },
            {
                icon: require('@/assets/img/yellow-dot.png'),
                name: "离线车辆",
                data: [
                    {
                        value: [126.04, 27.03],
                        itemStyle: { color: 'rgb(243, 177, 83)' }
                    },
                    {
                        value: [97.82, 20.58],
                        itemStyle: { color: 'rgb(243, 177, 83)' }
                    }
                ]
            },
            {
                icon: require('@/assets/img/red-dot.png'),
                name: "故障车辆",
                data: [
                    {
                        value: [104.82, 26.58],
                        itemStyle: { color: 'rgb(238, 80, 80)' }
                    }
                ]
            }
        ]
        // 图标
        const series = seriesList.map(v => {
            return {
                type: "scatter", //配置显示方式为用户自定义
                coordinateSystem: "geo",
                symbol: "image://" + v.icon,
                symbolSize: 20,
                data: v.data
            }
        })

        // options
        let options = {
            tooltip: {        // 提示框组件
                show: true,     // 显示提示框组件
                trigger: "item",     // 触发类型
                triggerOn: "mousemove",  // 出发条件
                formatter: "名称:{b}<br/>坐标:{c}"
            },
            series,  // 数据
            geo: {
                map: name || 'china',  // 引入地图 省份或者 国家
                roam: false, //开启鼠标缩放和漫
                zoom: 1.23,
                label: {
                    normal: {
                        //静态的时候展示样式
                        show: name === 'world' ? false : true, //是否显示地图省份得名称
                        textStyle: {
                            color: "#000",
                            fontSize: 8,
                            fontFamily: "Arial"
                        }
                    },
                    emphasis: {  // 高亮状态下的样式
                        //动态展示的样式
                        show: name === 'world' ? false : true,
                        color: "#fff"
                    }
                },
                itemStyle: {   // 地图区域的多边形 图形样式。
                    normal: {
                        areaColor: "rgb(231,237,252)",
                        borderWidth: 0.5, //设置外层边框
                        shadowBlur: 1,
                        shadowOffsetY: 1,
                        shadowOffsetX: 0,
                        // shadowColor: "#01012a",
                        borderColor: 'rgba(0, 0, 0, 0.1)',
                    },
                    emphasis: {
                        areaColor: "rgb(194,209,254)",
                        shadowOffsetX: 0,
                        shadowOffsetY: 0,
                        shadowBlur: 5,
                        borderWidth: 0,
                        shadowColor: "rgba(0, 0, 0, 0.5)"
                    }
                }
            },
            visualMap: {
                // 设置地图范围值显示的颜色
                selectedMode: false, // 不能选择
                hoverLink: false, // 取消鼠标移入效果
                textStyle: {
                    color: '#86909C',
                    fontSize: 12
                },
                orient: 'horizontal',
                itemGap: 10,
                itemWidth: 10,
                itemHeight: 10,
                pieces: [
                    {
                        gt: 0.9,
                        lte: 1,
                        label: '在线车辆',
                        color: '#41B75F'
                    },
                    {
                        gte: 0.8,
                        lte: 0.9,
                        label: '离线车辆',
                        color: '#F3B153'
                    },
                    {
                        lt: 0.8,
                        label: '故障车辆',
                        color: '#EE5050'
                    }
                ],
                top: 0,
                left: 0
            }
        }
        setDistributionOptions(options)
        distributionOptionsRef.current = options
    }

    //显示各省地图
    const getProvinceMapOpt = async (provinceAlphabet, name) => {
        let res = await api.getAxiosData(`province/${provinceAlphabet}`)
        if (res) {
            echarts.registerMap(name, res)
            changeOptions(name)
            myChartRef.current.setOption(distributionOptionsRef.current, true)
        }
    }

    //初始化地图
    let initMap = () => {
        echarts.registerMap("china", chinaJson)
        changeOptions("china")
        let chart = echarts.init(chartRef.current)
        setMyChart(chart)
        myChartRef.current = chart
        myChartRef.current.setOption(distributionOptionsRef.current)
        //点击事件
        myChartRef.current.on("click", chinaParam => {
            let idx = mapDriver.provincesText.findIndex(it => it.indexOf(chinaParam.name) !== -1)
            let code = mapDriver.provinces[idx] || 100000
            getProvinceMapOpt(code, mapDriver.provincesName[idx])
        })
        window.onresize = function () {
            myChartRef.current.resize()
        }
    }

    //切换地图类型
    let changeMapType = (type) => {
        let json = type === 'china' ? chinaJson : worldJson
        echarts.registerMap(type, json)
        changeOptions(type)
        myChartRef.current.setOption(distributionOptionsRef.current, true)
    }

    //暴露出去的数据
    useImperativeHandle(ref, () => ({
        initMap, //初始化表格
        changeMapType
    }))

    return <div id='map' ref={chartRef} />
})
export default Map;


 6万+
6万+


 被折叠的 条评论
为什么被折叠?
被折叠的 条评论
为什么被折叠?
 到【灌水乐园】发言


