


前言
夜莺简介
夜莺监控( Nightingale )是一款国产、开源云原生监控分析系统,采用 All-In-One 的设计,集数据采集、可视化、监控告警、数据分析于一体。于 2020 年 3 月 20 日,在 github 上发布 v1 版本,已累计迭代 60 多个版本。从 v5 版本开始与 Prometheus、VictoriaMetrics、Grafana、Telegraf、Datadog 等生态紧密协同集成,提供开箱即用的企业级监控分析和告警能力,已有众多企业选择将 Prometheus + AlertManager + Grafana 的组合方案升级为使用夜莺监控
用夜莺的好处
- 实时监控报警
- 提高系统可用性
- 资源利用率优化
- 数据可视化和报告
- 可扩展性和定制性
夜莺所关联的各个组件
Mysql:所有的告警信息,配置信息(比如普罗米修斯的),告警规则等等都存储在mysql里面
Redis:存储一些验证信息,JWT的token,metadata元信息,元数据,心跳信息等
TSDB:时序数据库(可以支持Prometheus、M3DB、VictoriaMetrics、Thanos等)
N9e:Nightingale | 夜莺监控,一款先进的开源云原生监控分析系统,采用 All-In-One 的设计,集数据采集、可视化、监控告警、数据分析于一体,与云原生生态紧密集成,提供开箱即用的企业级监控分析和告警能力。于 2022 年 5 月 11 日,捐赠予中国计算机学会开源发展委员会(CCF ODC),为 CCF ODC 成立后接受捐赠的首个开源项目,Nightingale 可以接收各种采集器上报的监控数据,转存到时序库(可以支持Prometheus、M3DB、VictoriaMetrics、Thanos等),并提供告警规则、屏蔽规则、订阅规则的配置能力,提供监控数据的查看能力,提供告警自愈机制(告警触发之后自动回调某个webhook地址或者执行某个脚本),提供历史告警事件的存储管理、分组查看的能力,n9e可以做集群,多个n9e分担告警规则的处理和压力,n9e也分为无状态和有状态服务
LB:nginx做7层代理
categraf:是夜莺监控的默认的自制的数据采集器
部署操作
安装前置依赖
- mysql
- redis
[root@node3 ~]# netstat -anput | grep mysql
tcp        0      0 0.0.0.0:3306            0.0.0.0:*               LISTEN      3939/mysqld
[root@node3 ~]# netstat -anput | grep redis
tcp        0      0 127.0.0.1:6379          0.0.0.0:*               LISTEN      4048/redis-server 1
二进制方式部署n9e
#下载n9e程序安装包
[root@node3 n9e]# pwd
/opt/n9e
[root@node3 n9e]# wget https://download.flashcat.cloud/n9e-v6.3.1-linux-amd64.tar.gz

#将n9e相关的文件解压到/opt/n9e目录中
[root@node3 n9e]# tar -zxvf n9e-v6.3.1-linux-amd64.tar.gz

#解压缩之后,可以看到n9e.sql是建表语句,然后导入数据库
[root@node3 n9e]# mysql -uroot -p1234 < n9e.sql

#修改配置文件 指定mysql和redis的地址和端口
[root@node3 n9e]# vim etc/config.toml
DSN="root:1234@tcp(127.0.0.1:3306)/n9e_v6charset=utf8mb4&parseTime=True&loc=Local&allowNativePasswords=true"
Address = "127.0.0.1:6379"

#启动n9e    如果需要systemd托管,自行准备service文件,我觉得service文件有手就会写
[root@node3 n9e]# nohup ./n9e &> n9e.log &
[1] 3446

#检查n9e.log是否有异常日志,检查端口是否在监听,正常应该监听在17000
[root@node3 n9e]# ss -tlnp | grep 17000
LISTEN     0      128       [::]:17000                 [::]:*                   users:(("n9e",pid=3446,fd=12))
如果日志和端口都没有啥问题,恭喜,你完成了夜莺的安装! 通过浏览器访问这个机器的17000就可以访问到页面了 http://ip:17000

默认账号/密码:root/root.2020

夜莺日志的位置:/opt/n9e/n9e.log
安装VictoriaMetrics
victoriaMetrics下载地址在github releases上,如果没有加速器的话 我已经给大家准备好了!!!
包地址:百度网盘 请输入提取码
提取码:00kz
将VictoriaMetrics程序包进行解压
[root@node3 victoria]# pwd
/opt/victoria
[root@node3 victoria]# cd
[root@node3 ~]# tar -zxf victoria-metrics-linux-amd64-v1.93.11.tar.gz -C /opt/victoria

查看解压后文件
[root@node3 victoria]# ll
总用量 21232
-rwxr-xr-x 1 lcc lcc 21741456 2月   1 23:16 victoria-metrics-prod

启动
[root@node3 victoria]# nohup ./victoria-metrics-prod &> stdout.log &
[2] 3696

查看端口8428
[root@node3 victoria]# ss -tlnp | grep 8428
LISTEN     0      128          *:8428                     *:*                   users:(("victoria-metric",pid=3696,fd=7))
访问接口http://ip:8428

如上,就表示安装成功了
打通夜莺和victoriaMetrics
分两个步骤,首先就类似上面配置 Prometheus 数据源那种方式,在夜莺里配置一个 VictoriaMetrics 的数据源,比如我的配置:


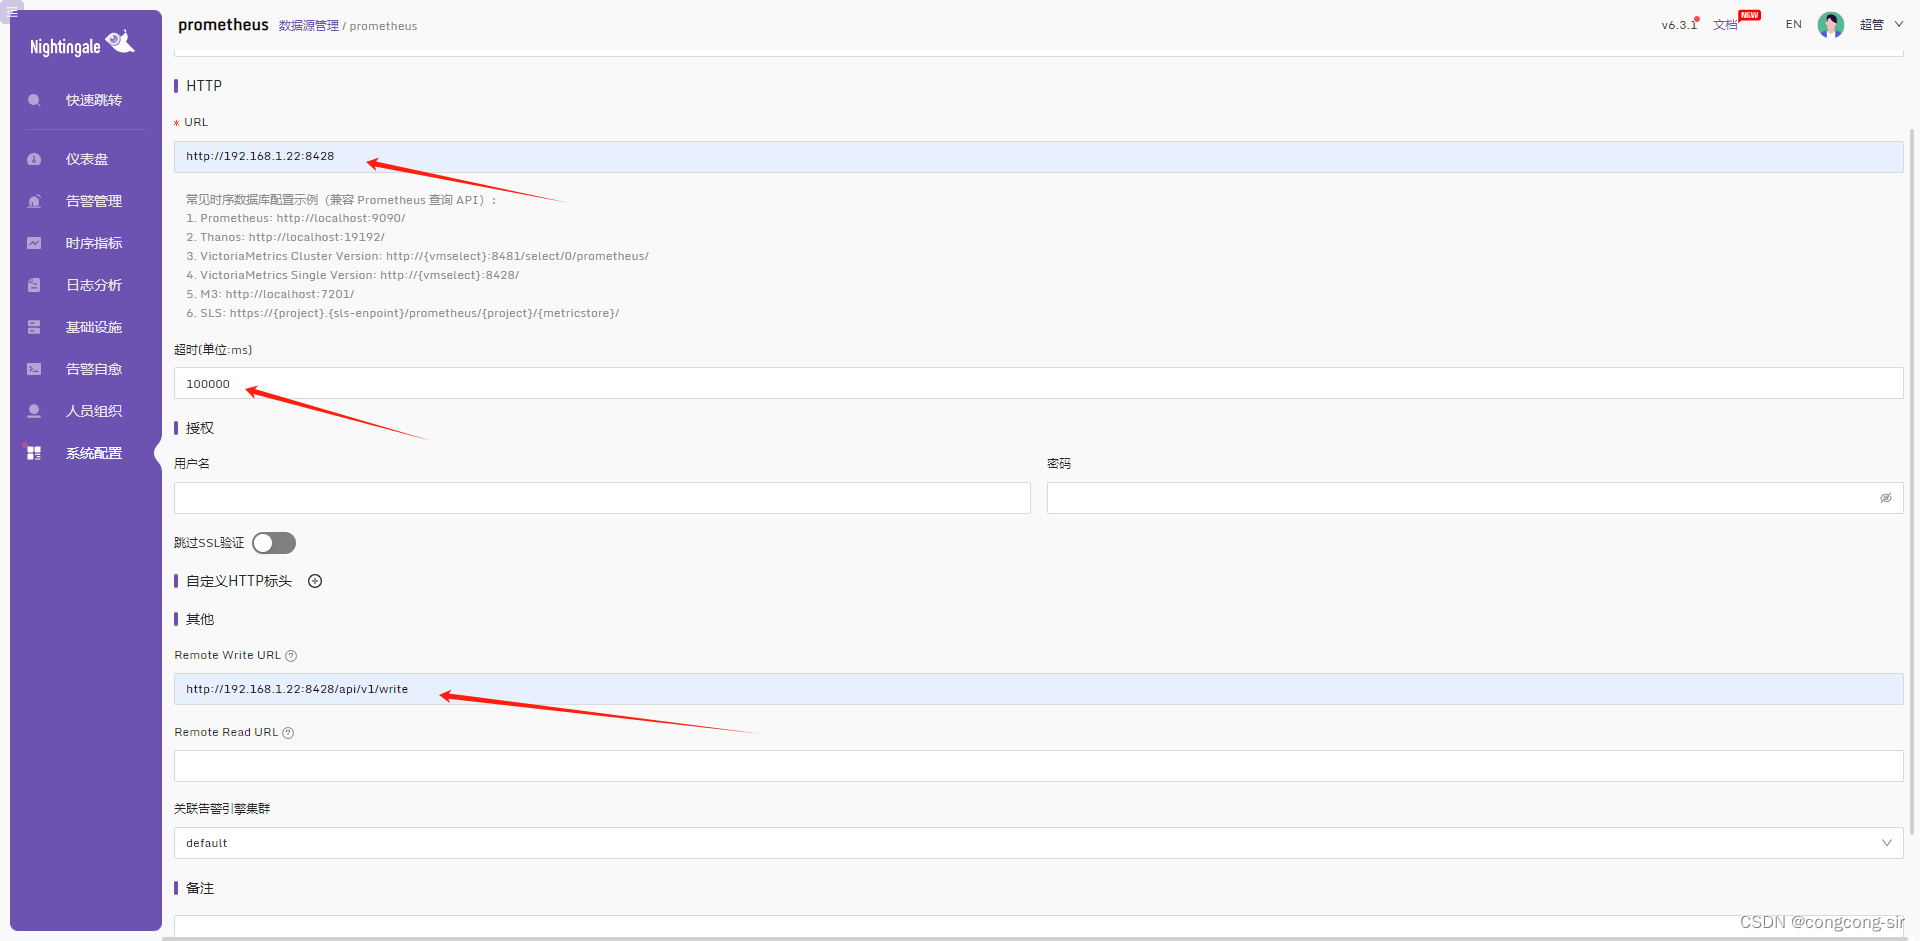 填写信息保存
进入夜莺的配置目录/opt/n9e/etc
[root@node3 ~]# cd /opt/n9e/etc/
[root@node3 etc]# vim config.toml
[[Pushgw.Writers]]
# Url = "http://127.0.0.1:8480/insert/0/prometheus/api/v1/write"
Url = "http://192.168.1.22:8428/api/v1/write"
重启
[root@node3 etc]# killall n9e
[root@node3 n9e]# nohup ./n9e &> n9e.log &
[3] 59159
[root@node3 n9e]# ss -lntup | grep n9e
tcp    LISTEN     0      128    [::]:17000              [::]:*                   users:(("n9e",pid=59159,fd=12))
安装categraf采集器
首先先安装依赖
[root@node3 ~]# yum install -y libpcap进行程序码的下载
[root@node3 opt]# pwd
/opt
[root@node3 opt]# wget https://download.flashcat.cloud/categraf-v0.3.32-linux-amd64-with-cgo-plugin.tar.gz
[root@node3 opt]# tar -zxf categraf-v0.3.32-linux-amd64-with-cgo-plugin.tar.gz
[root@node3 opt]# mv categraf-v0.3.32-linux-amd64-with-cgo-plugin categraf
修改配置文件:conf/config.toml
[writer_opt]
batch = 2000
chan_size = 10000

修改为n9e的地址和端口
[[writers]]
url = "http://192.168.1.22:17000/prometheus/v1/write"

[heartbeat]
enable = true

# report os version cpu.util mem.util metadata
url = "http://192.168.1.22:17000/v1/n9e/heartbeat"
设置systemd托管
[root@node3 conf]# pwd
/opt/categraf/conf
[root@node3 conf]# cp categraf.service /usr/lib/systemd/system/categraf.service
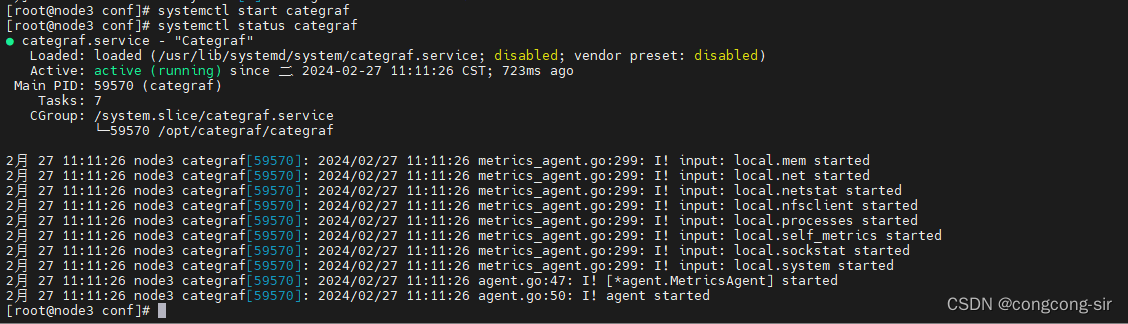
[root@node3 conf]# systemctl start categraf
[root@node3 conf]# systemctl status categraf
● categraf.service - "Categraf"
Loaded: loaded (/usr/lib/systemd/system/categraf.service; disabled; vendor preset: disabled)
Active: failed (Result: start-limit) since 二 2024-02-27 11:08:20 CST; 5s ago
Process: 59512 ExecStart=/opt/categraf/categraf (code=exited, status=127)
Main PID: 59512 (code=exited, status=127)
2月 27 11:08:20 node3 systemd[1]: categraf.service: main process exited, code=exited, status=127/n/a
2月 27 11:08:20 node3 categraf[59512]: /opt/categraf/categraf: error while loading shared libraries: libpcap.so.0.8: cannot open shared object file: No such file or directory
2月 27 11:08:20 node3 systemd[1]: Unit categraf.service entered failed state.
2月 27 11:08:20 node3 systemd[1]: categraf.service failed.
2月 27 11:08:20 node3 systemd[1]: categraf.service holdoff time over, scheduling restart.
2月 27 11:08:20 node3 systemd[1]: Stopped "Categraf".
2月 27 11:08:20 node3 systemd[1]: start request repeated too quickly for categraf.service
2月 27 11:08:20 node3 systemd[1]: Failed to start "Categraf".
2月 27 11:08:20 node3 systemd[1]: Unit categraf.service entered failed state.
2月 27 11:08:20 node3 systemd[1]: categraf.service failed.启动时可能会报错:/opt/categraf/categraf: error while loading shared libraries: libpcap.so.0.8: cannot open shared object file: No such file or directory 没有libpcap.so.0.8
解决办法:
#安装
[root@node3 conf]# yum install libpcap -y

#查看安装版本
[root@node3 conf]# ls -al /usr/lib64/libpcap.so*
lrwxrwxrwx. 1 root root     16 8月  15 2023 /usr/lib64/libpcap.so.1 -> libpcap.so.1.5.3
-rwxr-xr-x. 1 root root 266528 4月   6 2022 /usr/lib64/libpcap.so.1.5.3

#软连接到需要的版本
[root@node3 conf]# ln -s /usr/lib64/libpcap.so.1.5.3 /usr/lib64/libpcap.so.0.8
查看运行状态
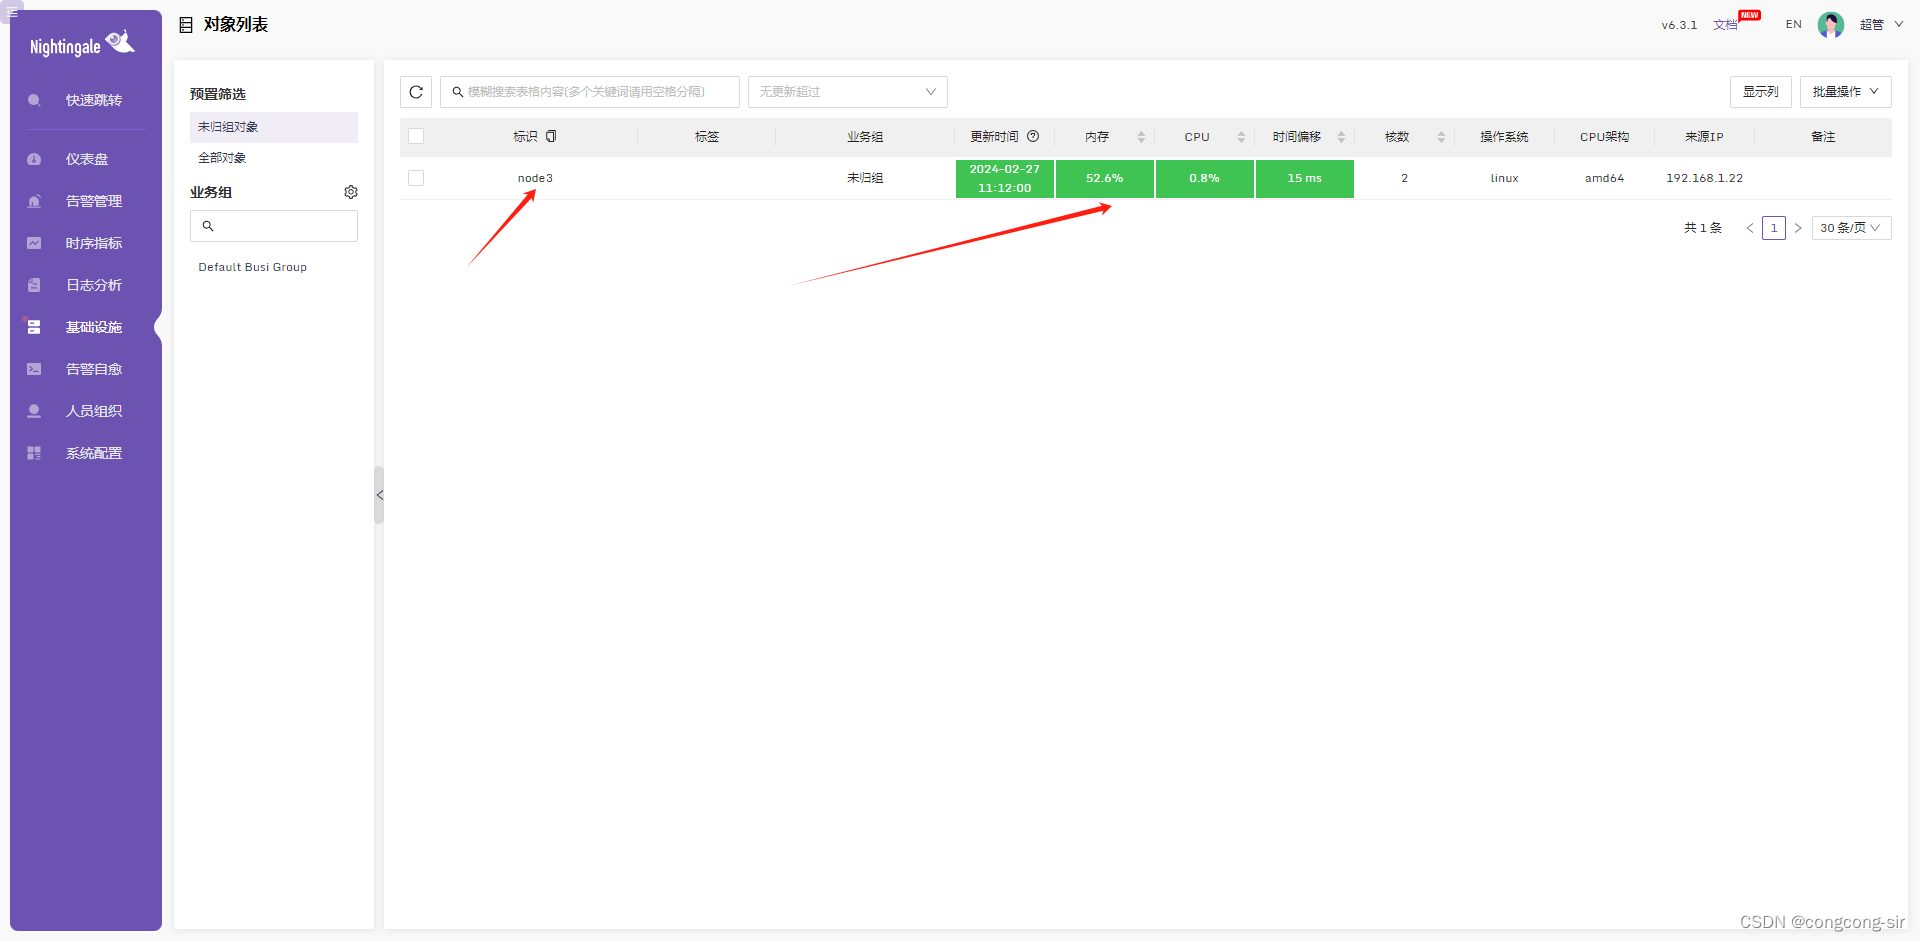
 安装完成后就可以在基础设施中查看到机器的状态了
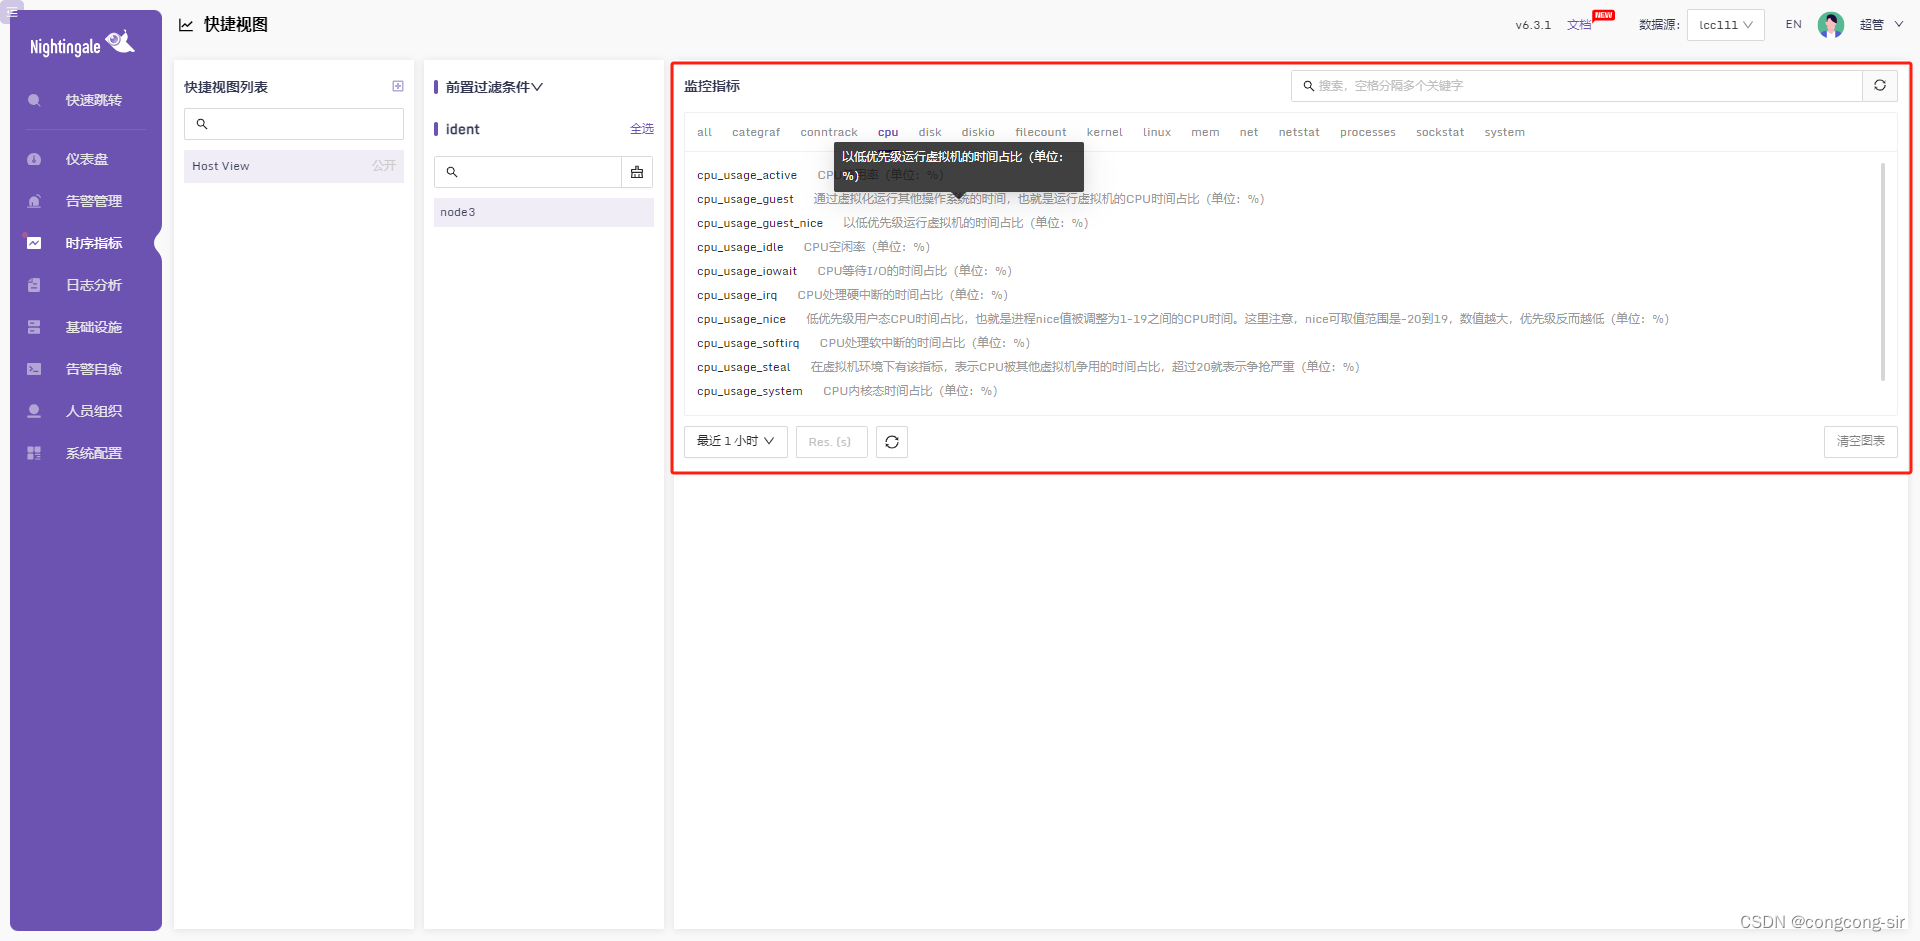
 查看时序指标
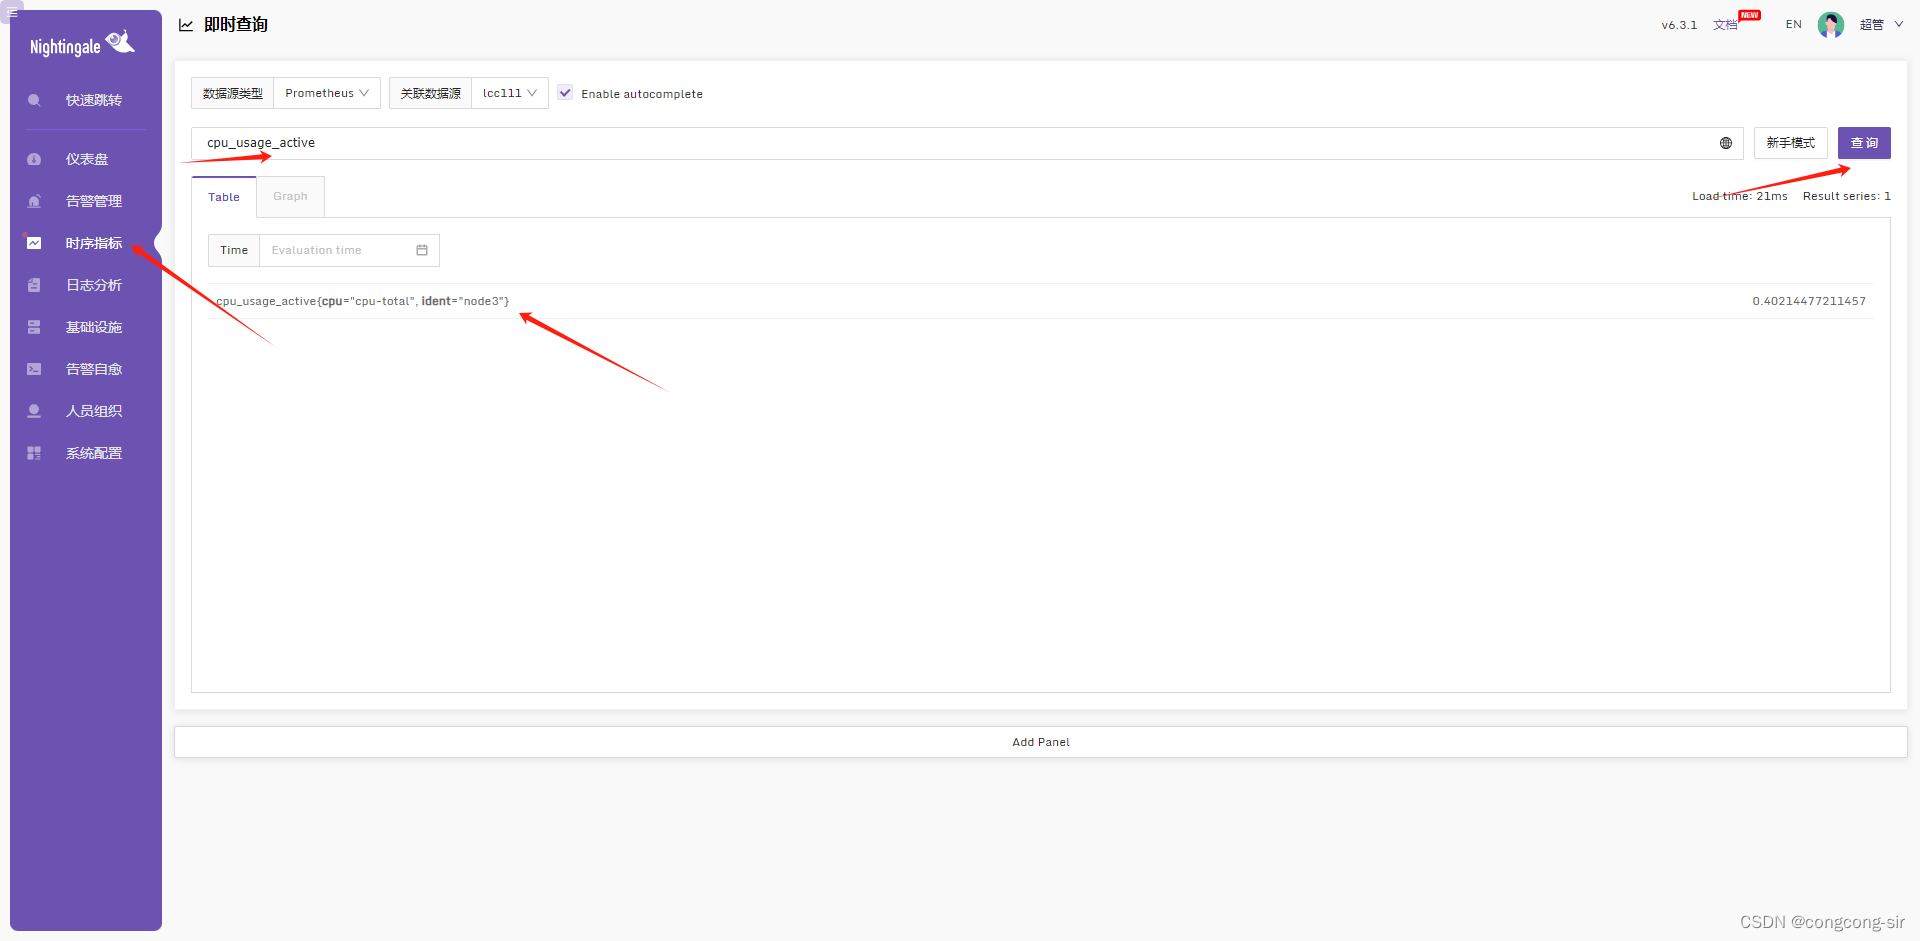 也可以在这个页面快速查看
 多节点监控
多节点监控
与上面步骤相同,只需要部署多个categraf即可
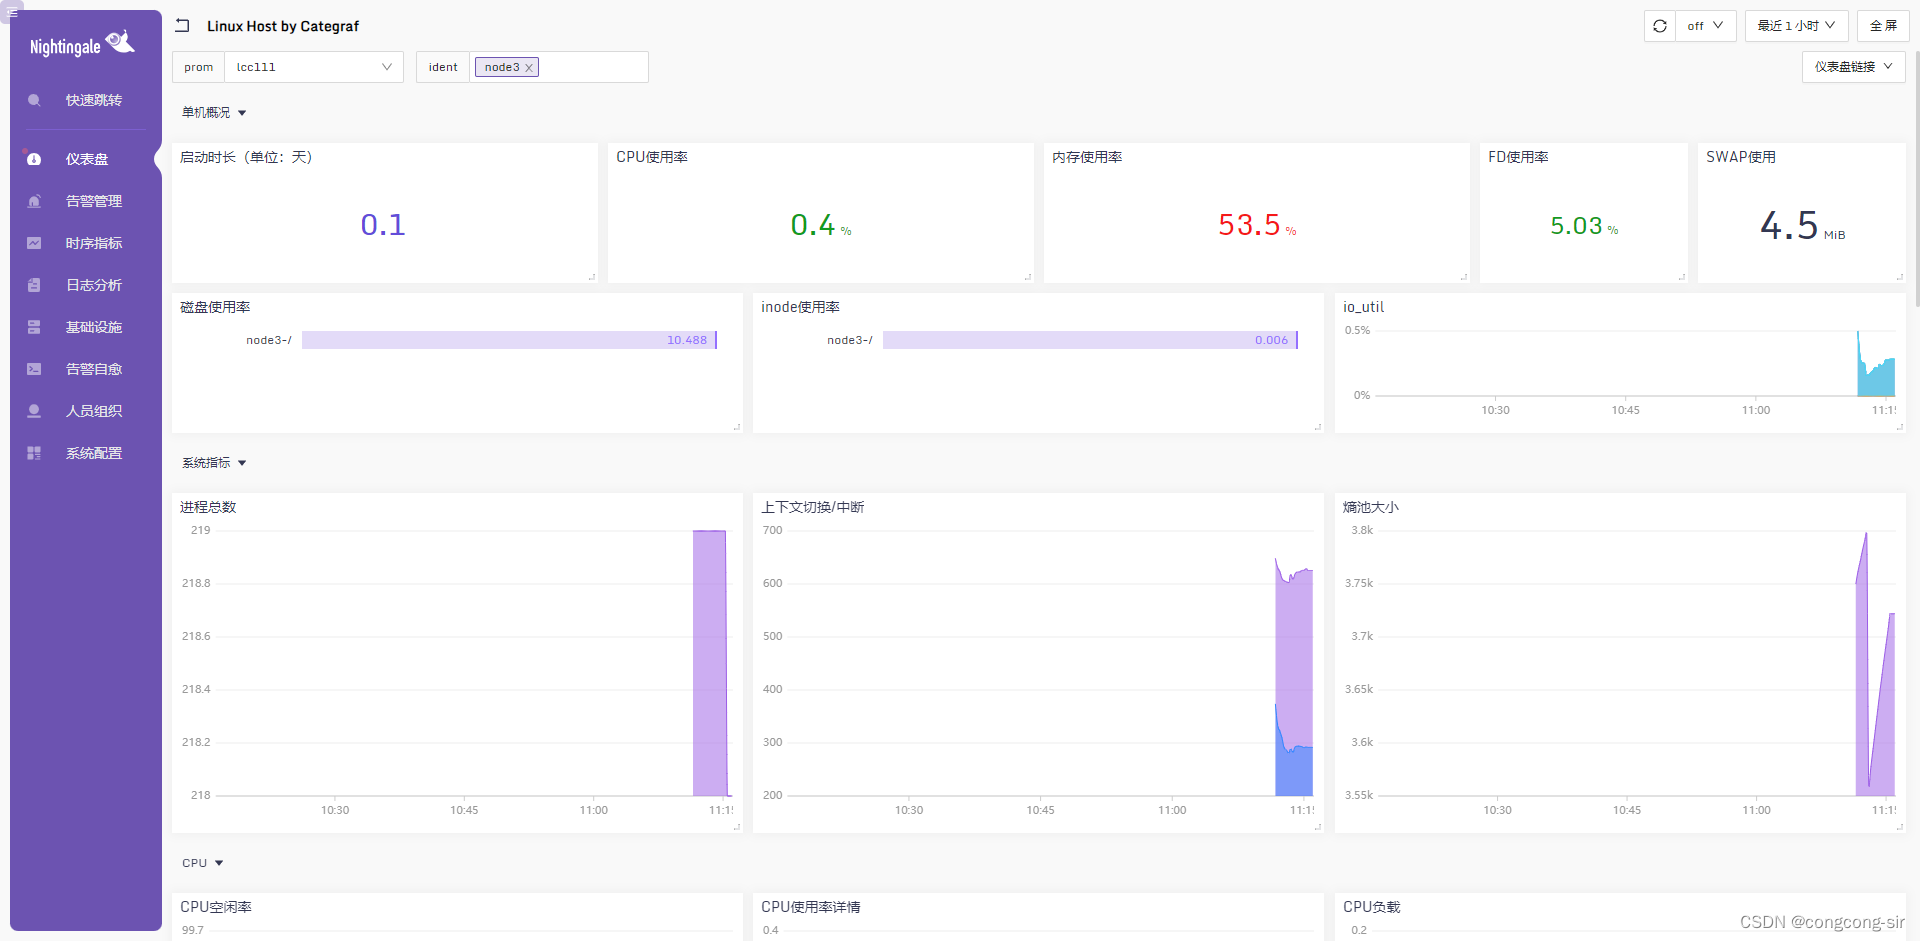
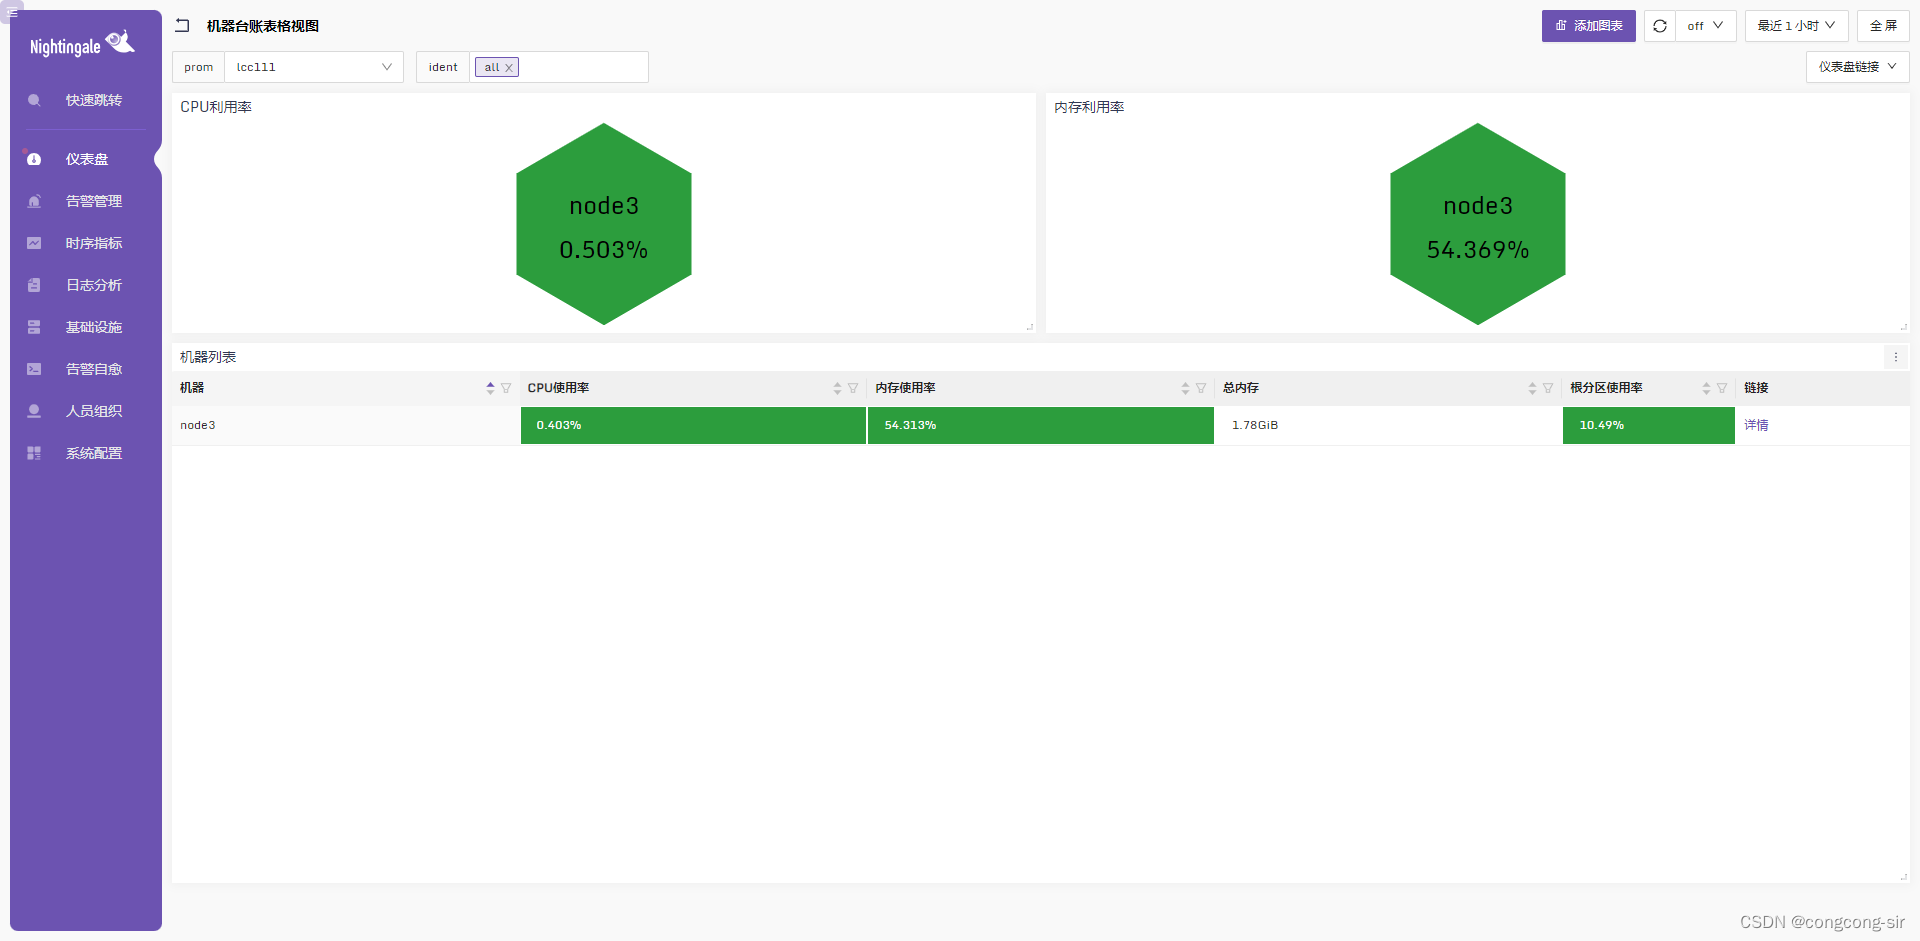
配置服务器监控
上面步骤我们已经在页面通过victoria查询出数据,这里我们还可以通过仪表盘的形式来展示

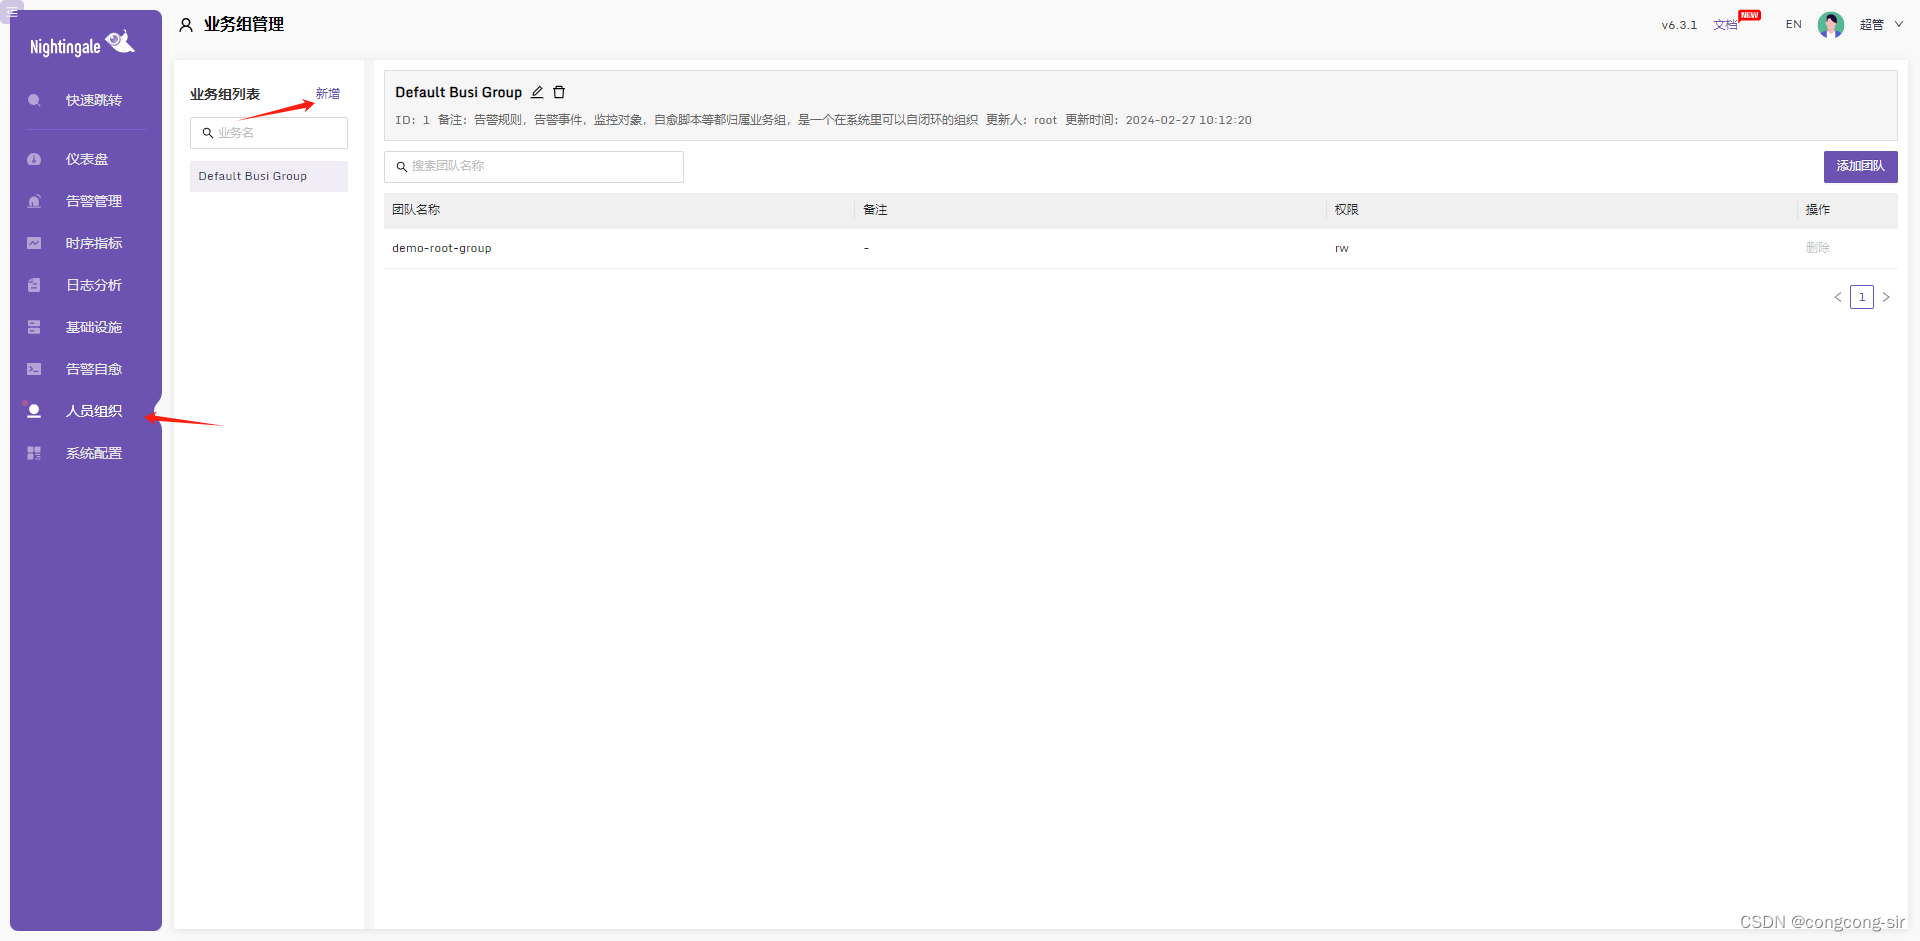
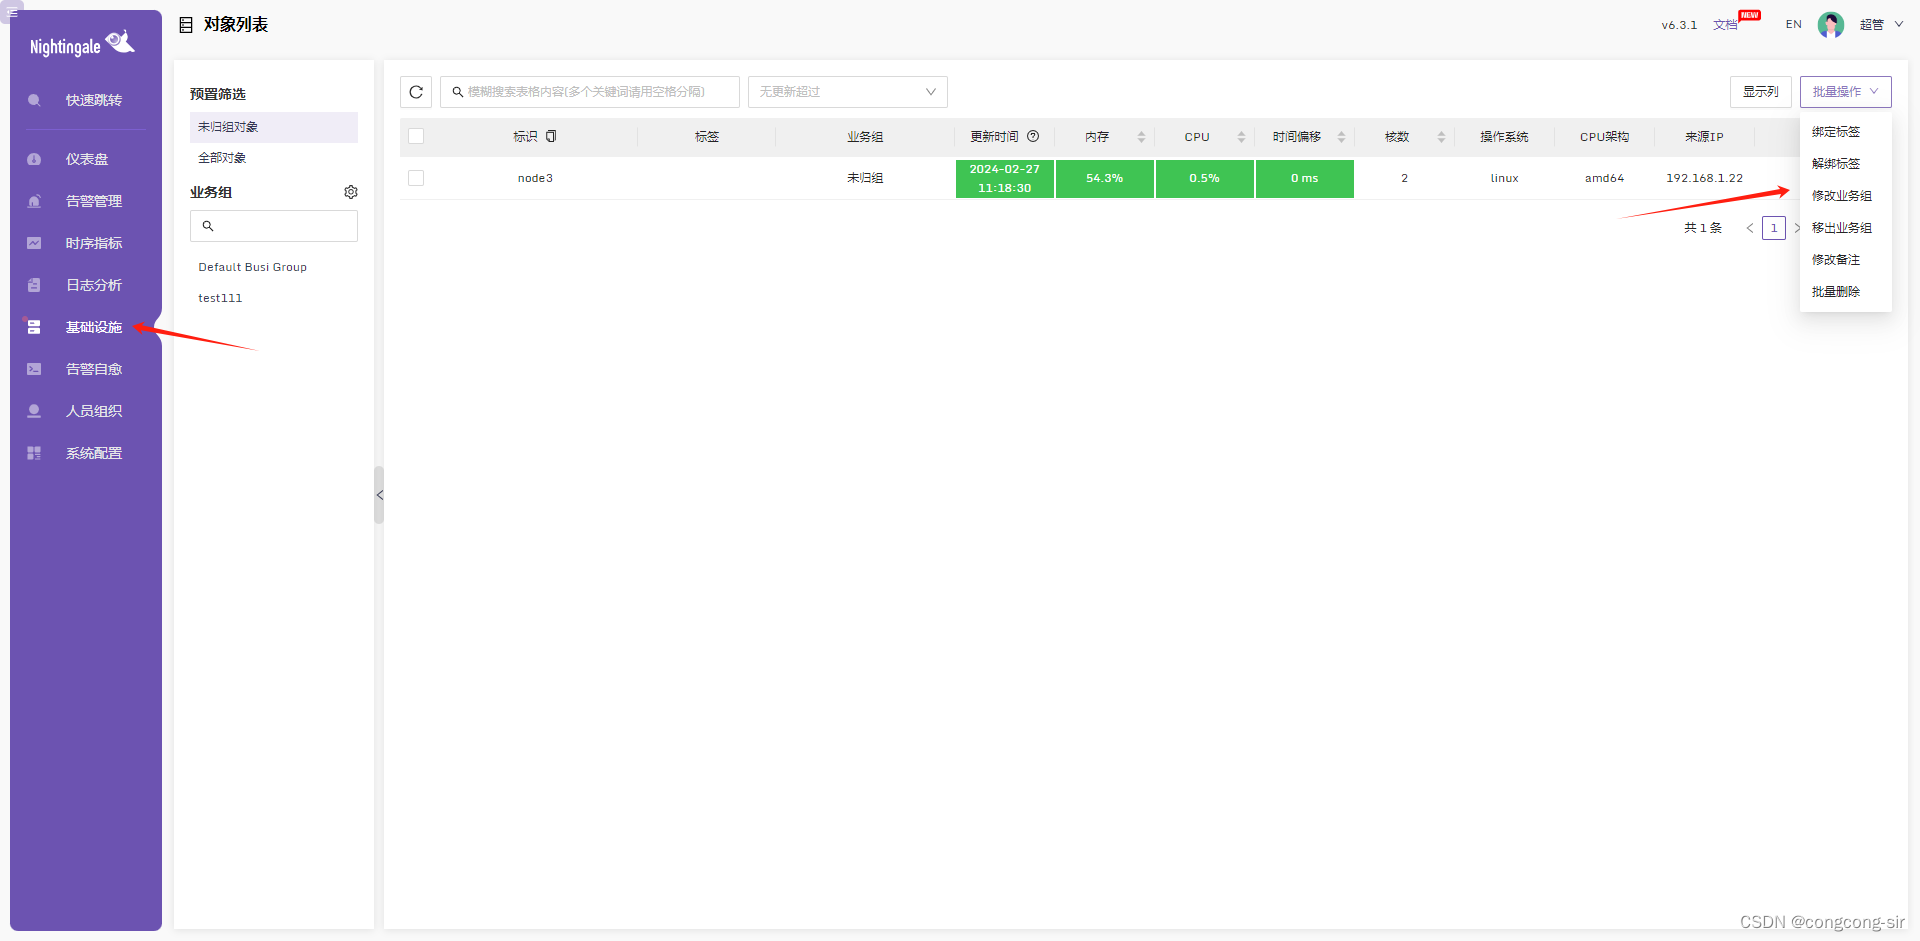
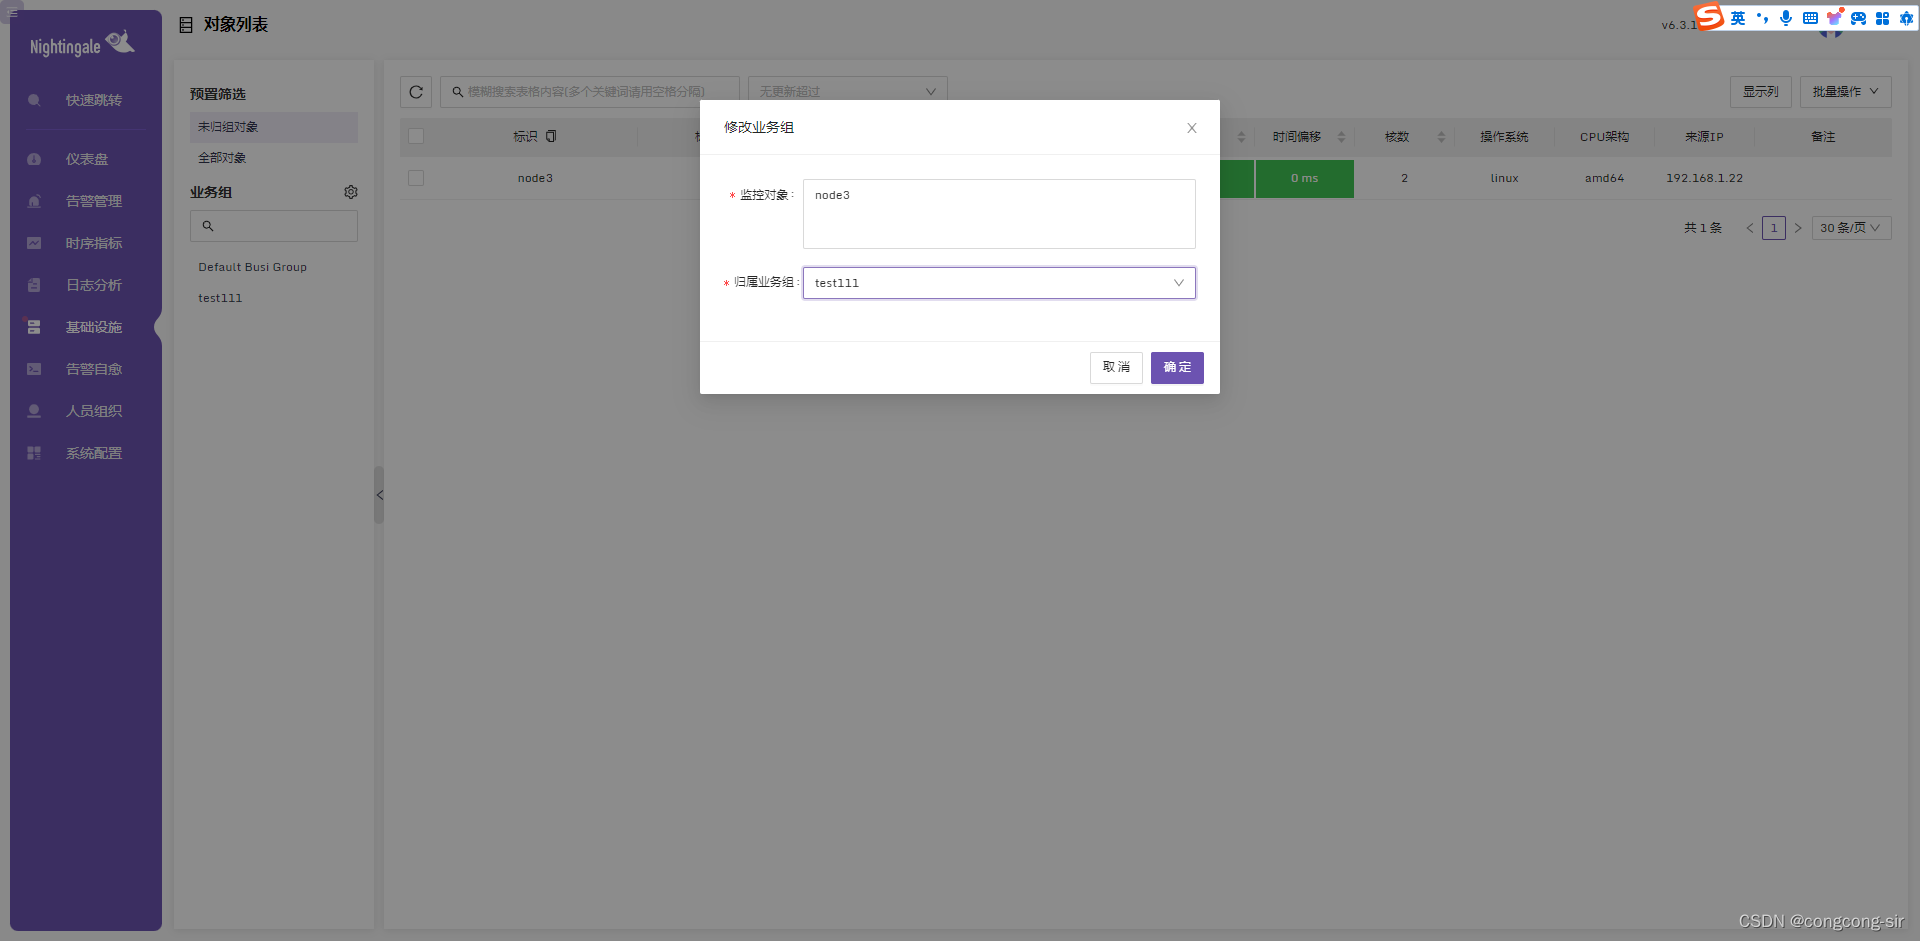
 将未归组的机器加入业务组中
先新增业务组
修改未归组对象到新增业务组中
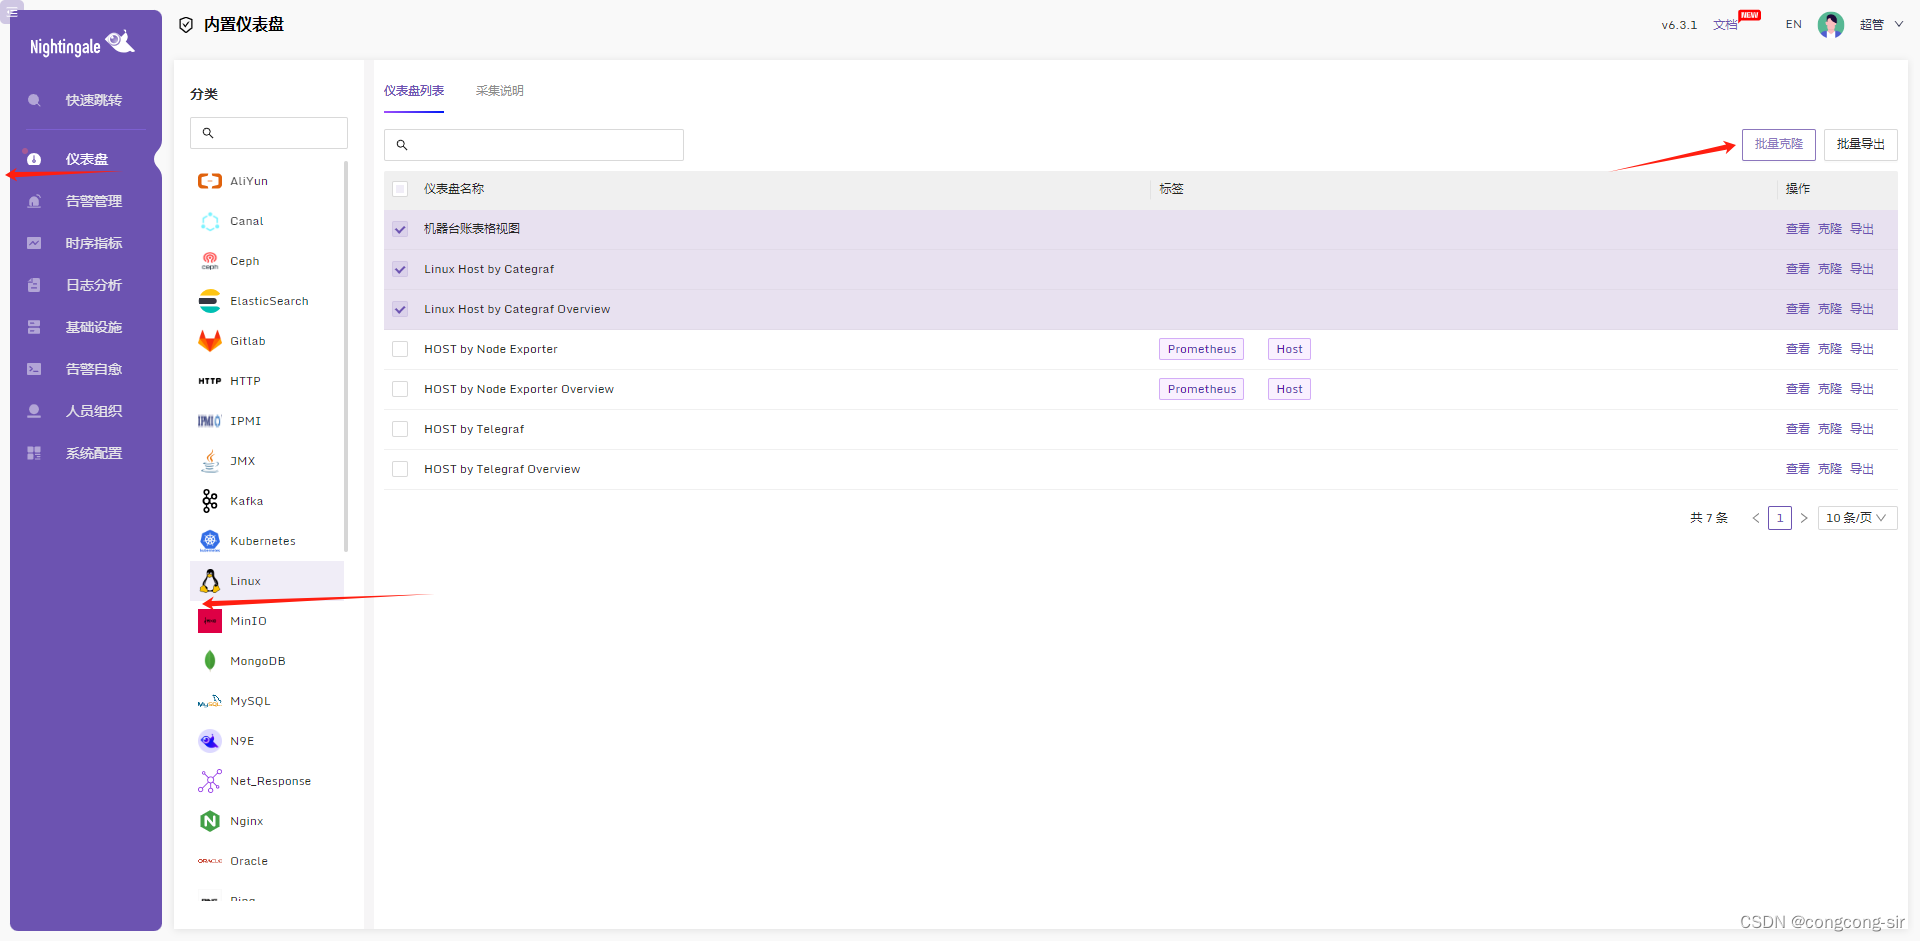
将夜莺自带的服务器监控指标克隆到业务组中


部署完毕!!! 下一章我会发布配置监控指标外加企业级钉钉报警 关注我别错过


 433
433

 被折叠的 条评论
为什么被折叠?
被折叠的 条评论
为什么被折叠?
 到【灌水乐园】发言


