


夜莺监控( Nightingale )
概述
基于夜莺监控( Nightingale )的一套完善的监控体系。
技术选型
categraf
简介
Categraf 是一个来自快猫研发团队开源的监控采集Agent,类似 Telegraf、Grafana-Agent、Datadog-Agent,采用 All-in-one 的设计,不但支持指标采集,也支持日志和调用链路的数据采集。
categraf 的代码托管在 github:https://github.com/flashcatcloud/categraf
产品对比
categraf 和 telegraf、exporters、grafana-agent、datadog-agent
-
telegraf是 influxdb 生态的产品,因为 influxdb 是支持字符串数据的,所以 telegraf 采集的很多 field 是字符串类型,另外 influxdb 的设计,允许 labels 是非稳态结构,比如 result_code 标签,有时其 value 是 0,有时其 value 是 1,在 influxdb 中都可以接受。但是上面两点,在类似 prometheus 的时序库中,处理起来就很麻烦。 -
prometheus生态有各种 exporters,但是设计逻辑都是一个监控类型一个 exporter,甚至一个实例一个 exporter,生产环境可能会部署特别多的 exporters,管理起来略麻烦。 -
grafana-agentimport 了大量 exporters 的代码,没有裁剪,没有优化,没有最佳实践在产品上的落地,有些中间件,仍然是一个 grafana-agent 一个目标实例,管理起来也很不方便。 -
datadog-agent确实是集大成者,但是大量代码是 python 的,整个发布包也比较大,有不少历史包袱,而且生态上是自成一派,和社区相对割裂。 -
categraf
- 支持 remote_write 写入协议,支持将数据写入 promethues、M3DB、VictoriaMetrics、InfluxDB;
- 指标数据只采集数值,不采集字符串,标签维持稳态结构
采用 all-in-one 的设计,所有的采集工作用一个 agent 搞定;- 纯Go代码编写,静态编译依赖少,容易分发,易于安装;
- 尽可能落地最佳实践,不需要采集的数据无需采集,针对可能会对时序库造成高基数的问题在采集侧做出处理;
- 不但提供采集能力,还要整理出监控大盘和告警规则,可以直接导入使用.
nightingale
简介
夜莺监控( Nightingale )是一款国产、开源云原生监控分析系统,采用 All-In-One 的设计,集数据采集、可视化、监控告警、数据分析于一体。于 2020 年 3 月 20 日,在 github 上发布 v1 版本,已累计迭代 60 多个版本。从 v5 版本开始与 Prometheus、VictoriaMetrics、Grafana、Telegraf、Datadog 等生态紧密协同集成,提供开箱即用的企业级监控分析和告警能力,已有众多企业选择将 Prometheus + AlertManager + Grafana 的组合方案升级为使用夜莺监控。夜莺监控,由滴滴开发和开源,并于 2022 年 5 月 11 日,捐赠予中国计算机学会开源发展委员会(CCF ODC),为 CCF ODC 成立后接受捐赠的第一个开源项目。夜莺监控的核心开发团队,也是Open-Falcon项目原核心研发人员。
特性:
- 开箱即用:支持 Docker、Helm Chart、云服务等多种部署方式;集数据采集、监控告警、可视化为一体;内置多种监控仪表盘、快捷视图、告警规则模板,导入即可快速使用;大幅降低云原生监控系统的建设成本、学习成本、使用成本;
- 专业告警:可视化的告警配置和管理,支持丰富的告警规则,提供屏蔽规则、订阅规则的配置能力,支持告警多种送达渠道,支持告警自愈、告警事件管理等;
- 云原生:以交钥匙的方式快速构建企业级的云原生监控体系,支持 Categraf、Telegraf、Grafana-agent 等多种采集器,支持 Prometheus、VictoriaMetrics、M3DB、ElasticSearch 等多种数据库,兼容支持导入 Grafana 仪表盘,与云原生生态无缝集成;
- 高性能、高可用:得益于夜莺的多数据源管理引擎,和夜莺引擎侧优秀的架构设计,借助于高性能时序库,可以满足数亿时间线的采集、存储、告警分析场景,节省大量成本;夜莺监控组件均可水平扩展,无单点,已在上千家企业部署落地,经受了严苛的生产实践检验;
- 灵活扩展、中心化管理:夜莺监控,可部署在 1 核 1G 的云主机,可在上百台机器集群化部署,可运行在 K8s 中;也可将时序库、告警引擎等组件下沉到各机房、各 Region,兼顾边缘部署和中心化统一管理,解决数据割裂,缺乏统一视图的难题;
- 开放社区:托管于中国计算机学会开源发展委员会,有快猫星云和众多公司的持续投入,和数千名社区用户的积极参与,以及夜莺监控项目清晰明确的定位,都保证了夜莺开源社区健康、长久的发展。活跃、专业的社区用户也在持续沉淀更多的最佳实践于产品中。
系统架构
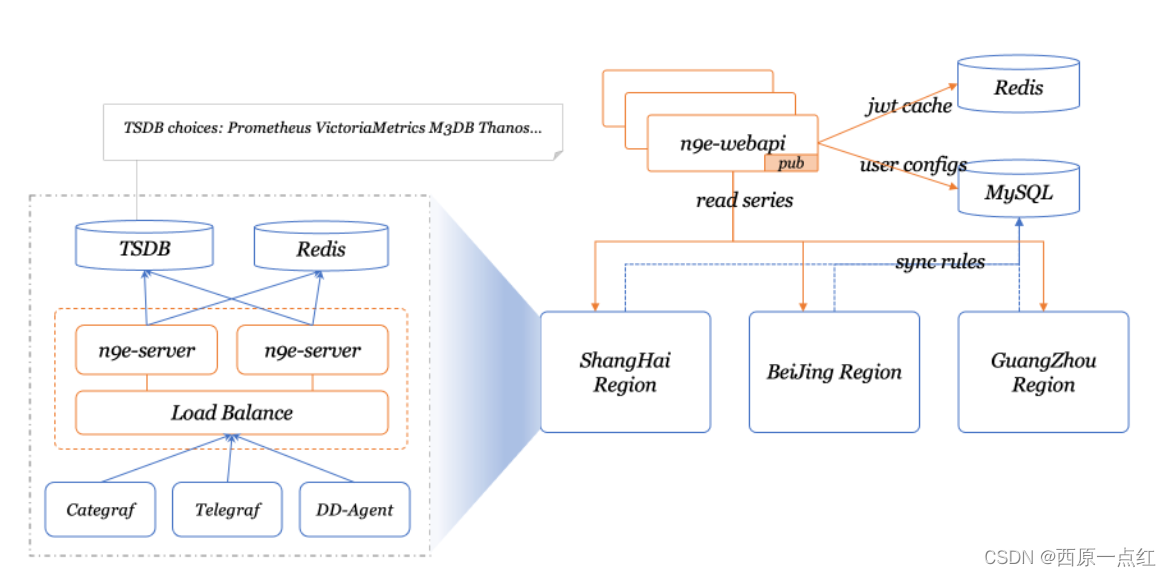
夜莺(Nightingale )的核心是 server 和 webapi 两个模块,webapi 无状态,放到中心端,承接前端请求,将用户配置写入数据库;server 是告警引擎和数据转发模块,一般随着时序库走,一个时序库就对应一套 server,每套 server 可以只用一个实例,也可以多个实例组成集群,server 可以接收 Categraf、Telegraf、Grafana-Agent、Datadog-Agent、Falcon-Plugins 上报的数据,写入后端时序库,周期性从数据库同步告警规则,然后查询时序库做告警判断。每套 server 依赖一个 redis。
产品对比
-
Zabbix:
Zabbix 是一款老牌的监控系统,对机器和网络设备的监控覆盖很全,比如支持 AIX 系统,常见的开源监控都是支持 Linux、Windows,AIX 较少能够支持,Zabbix 用户群体广泛,国内很多公司基于 Zabbix 做商业化服务,不过 Zabbix 使用数据库做存储,容量有限,今年推出的 TimescaleDB 对容量有较大提升,大家可以尝试下;其次 Zabbix 整个产品设计是面向静态资产的,在云原生场景下显得力不从心。 -
Prometheus:
Nightingale 可以简单看做是 Prometheus 的一个企业级版本,把 Prometheus 当做 Nightingale 的一个内部组件(时序库),当然,也不是必须的,时序库除了 Prometheus,还可以使用 VictoriaMetrics、M3DB 等,各种 Exporter 采集器也可以继续使用。
Nightingale 可以接入多个 Prometheus,可以允许用户在页面上配置告警规则、屏蔽规则、订阅规则,在页面上查看告警事件、做告警事件聚合统计,配置告警自愈机制,管理监控对象,配置监控大盘等,就把 Nightingale 看做是 Prometheus 的一个 WEBUI 也是可以的,不过实际上,它远远不止是一个 WEBUI,用一下就会深有感触。 -
Nightingale:
Nightingale 直接支持 PromQL,支持 Prometheus、M3DB、VictoriaMetrics 多种时序库,支持 Categraf、Telegraf、Datadog-Agent、Grafana-Agent 做监控数据采集,支持 Grafana 看图,整个设计更加云原生。
Prometheus
简介
Prometheus是一个开源的系统监控和报警系统,现在已经加入到CNCF基金会,成为继k8s之后第二个在CNCF托管的项目,在kubernetes容器管理系统中,通常会搭配prometheus进行监控,同时也支持多种exporter采集数据,还支持pushgateway进行数据上报,Prometheus性能足够支撑上万台规模的集群。
特点
1)多维度数据模型
每一个时间序列数据都由metric度量指标名称和它的标签labels键值对集合唯一确定:这个metric度量指标名称指定监控目标系统的测量特征(如:http_requests_total- 接收http请求的总计数)。labels开启了Prometheus的多维数据模型:对于相同的度量名称,通过不同标签列表的结合, 会形成特定的度量维度实例。(例如:所有包含度量名称为/api/tracks的http请求,打上method=POST的标签,则形成了具体的http请求)。这个查询语言在这些度量和标签列表的基础上进行过滤和聚合。改变任何度量上的任何标签值,则会形成新的时间序列图。
2)灵活的查询语言(PromQL):可以对采集的metrics指标进行加法,乘法,连接等操作;
3)可以直接在本地部署,不依赖其他分布式存储;
4)通过基于HTTP的pull方式采集时序数据;
5)可以通过中间网关pushgateway的方式把时间序列数据推送到prometheus server端;
6)可通过服务发现或者静态配置来发现目标服务对象(targets)。
7)有多种可视化图像界面,如Grafana等。
8)高效的存储,每个采样数据占3.5 bytes左右,300万的时间序列,30s间隔,保留60天,消耗磁盘大概200G。
9)做高可用,可以对数据做异地备份,联邦集群,部署多套prometheus,pushgateway上报数据
组件介绍
1)Prometheus Server: 用于收集和存储时间序列数据。
2)Client Library: 客户端库,检测应用程序代码,当Prometheus抓取实例的HTTP端点时,客户端库会将所有跟踪的metrics指标的当前状态发送到prometheus server端。
3)Exporters: prometheus支持多种exporter,通过exporter可以采集metrics数据,然后发送到prometheus server端,所有向promtheus server提供监控数据的程序都可以被称为exporter
4)Alertmanager: 从 Prometheus server 端接收到 alerts 后,会进行去重,分组,并路由到相应的接收方,发出报警,常见的接收方式有:电子邮件,微信,钉钉, slack等。
5)Grafana:监控仪表盘,可视化监控数据
6)pushgateway: 各个目标主机可上报数据到pushgateway,然后prometheus server统一从pushgateway拉取数据。
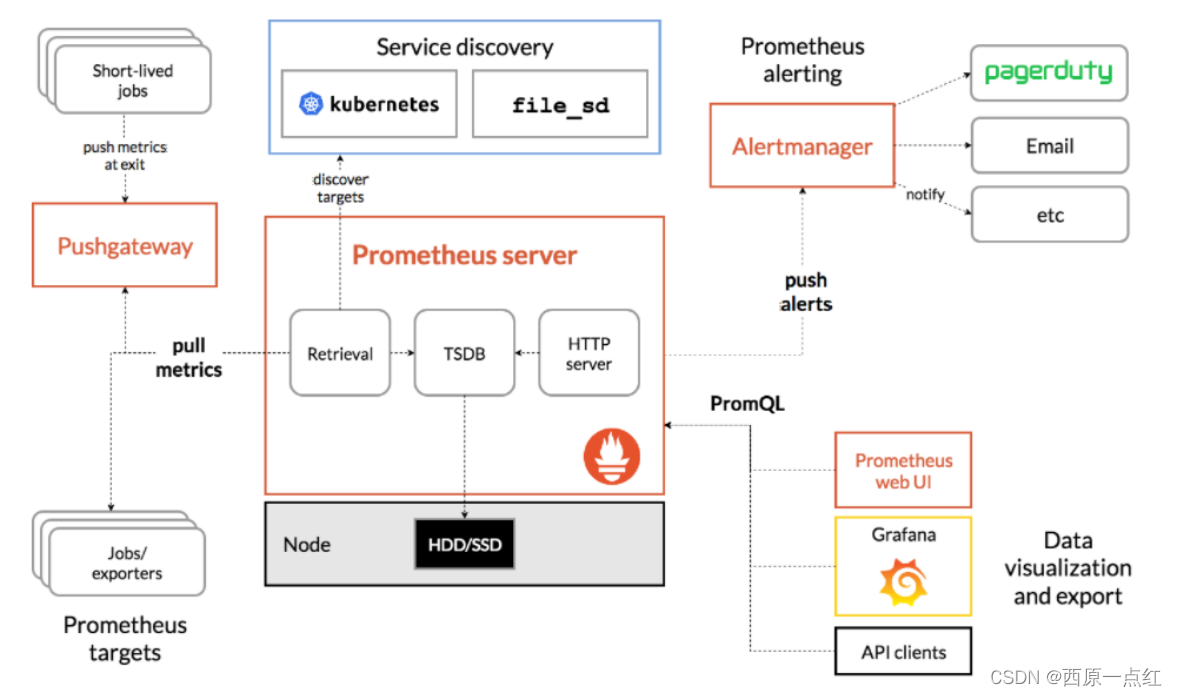
从上图可发现,Prometheus整个生态圈组成主要包括prometheus server,Exporter,pushgateway,alertmanager,grafana,Web ui界面,Prometheus server由三个部分组成,Retrieval,Storage,PromQL
- Retrieval负责在活跃的target主机上抓取监控指标数据
- Storage存储主要是把采集到的数据存储到磁盘中
- PromQL是Prometheus提供的查询语言模块。
相关项目地址:
https://github.com/ccfos/nightingale/
https://gitlink.org.cn/ccfos/nightingale
https://gitee.com/didiglobal/nightingale-nightingale
https://github.com/ccfos/nightingale/releases
架构规划
组件架构
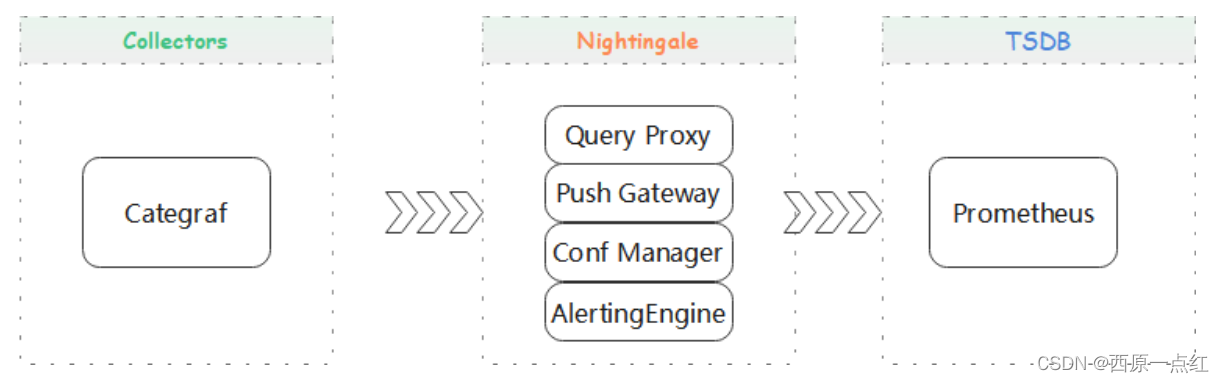
- collectors:采集器,这里选择Categraf。
- Nightingale:接收采集器上报的监控数据,转存到时序库,,并提供告警规则、屏蔽规则、订阅规则的配置能力,提供监控数据的查看能力,提供告警自愈机制(告警触发之后自动回调某个webhook地址或者执行某个脚本),提供历史告警事件的存储管理、分组查看的能力。
- Prometheus:时序库,存储采集器上报的监控数据。
- Ibex:告警自愈功能依赖的模块,提供一个批量执行命令的通道,可以做到在告警的时候自动去目标机器执行脚本。
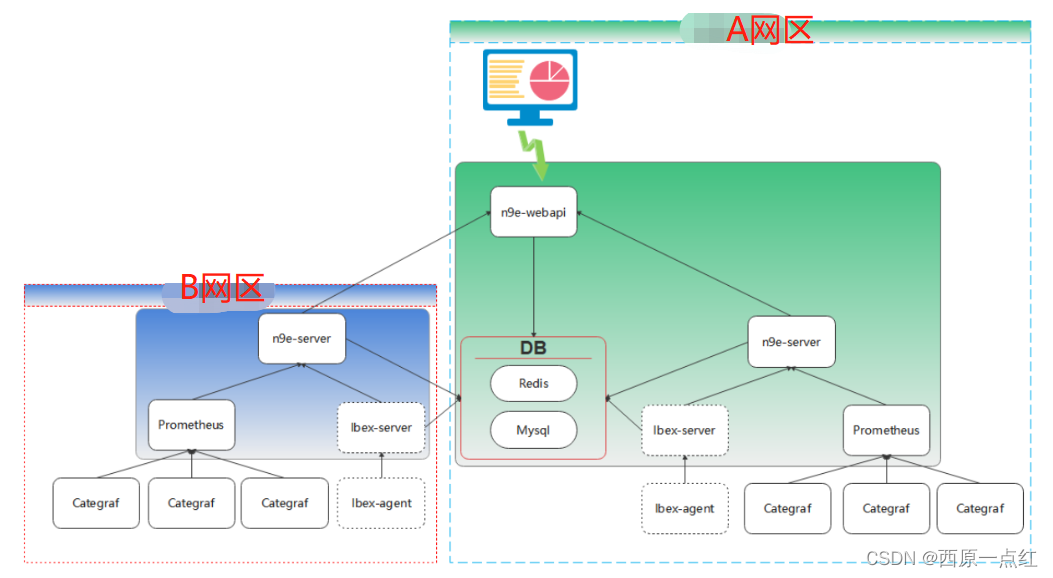
部署架构
安装配置
服务端(Nightingale)
概述
根据【架构规划】-【组件架构】
Nightingale用于接收采集器上报的监控数据,转存到时序库,,并提供告警规则、屏蔽规则、订阅规则的配置能力,提供监控数据的查看能力,提供告警自愈机制(告警触发之后自动回调某个webhook地址或者执行某个脚本),提供历史告警事件的存储管理、分组查看的能力。
服务端由4个部分组成:
- n9e-webapi
- n9e-server
- MySQL
- redis
- Prometheus
- Ibex
架构

- n9e-webapi:用于提供 API 给前端 JavaScript 使用
- n9e-server:告警引擎和数据转发器
- MySQL:关系型数据库,存储配置、用户、告警规则等基础信息
- redis:缓存数据库,jwt、cache
- Prometheus::时序库,存储采集器上报的监控数据
- Ibex:自愈组件
安装
Docker
基础环境:docker、 Docker-compose、git
- 拉取代码包
# git clone https://github.com/ccfos/nightingale//nightingale.git
- 修改默认mysql密码
相关配置文件路径:
nightingale/docker/Docker-compose.yaml
nightingale/docker/n9eetc/server.conf
nightingale/docker/n9eetc/webapi.conf
nightingale/docker/docker/ibexetc/server.conf
修改内容如下:
Docker-compose.yaml
services:
  mysql:
    image: mysql:5.7
    container_name: mysql
    hostname: mysql
    restart: always
    ports:
      - "3306:3306"
    environment:
      TZ: Asia/Shanghai
      MYSQL_ROOT_PASSWORD: 修改后密码
    volumes:
      - ./mysqldata:/var/lib/mysql/
      - ./initsql:/docker-entrypoint-initdb.d/
      - ./mysqletc/my.cnf:/etc/my.cnf
    networks:
      - nightingale
server.conf
[DB]
# postgres: host=%s port=%s user=%s dbname=%s password=%s sslmode=%s
DSN="root:修改后密码@tcp(mysql:3306)/n9e_v5?charset=utf8mb4&parseTime=True&loc=Local&allowNativePasswords=true"
# enable debug mode or not
Debug = false
# mysql postgres
DBType = "mysql"
# unit: s
MaxLifetime = 7200
# max open connections
MaxOpenConns = 150
# max idle connections
MaxIdleConns = 50
# table prefix
TablePrefix = ""
# enable auto migrate or not
# EnableAutoMigrate = false
webapi.conf
[DB]
# postgres: host=%s port=%s user=%s dbname=%s password=%s sslmode=%s
DSN="root:修改后密码@tcp(mysql:3306)/n9e_v5?charset=utf8mb4&parseTime=True&loc=Local&allowNativePasswords=true"
# enable debug mode or not
Debug = true
# mysql postgres
DBType = "mysql"
# unit: s
MaxLifetime = 7200
# max open connections
MaxOpenConns = 150
# max idle connections
MaxIdleConns = 50
# table prefix
TablePrefix = ""
# enable auto migrate or not
# EnableAutoMigrate = false
ibexetc/server.conf
[MySQL]
# mysql address host:port
Address = "mysql:3306"
# mysql username
User = "root"
# mysql password
Password = "修改后密码"
# database name
DBName = "ibex"
# connection params
Parameters = "charset=utf8mb4&parseTime=True&loc=Local&allowNativePasswords=true"
- 使用Docker Compose一键启动夜莺
# cd nightingale/docker
# docker-compose up -d
Creating network "docker_nightingale" with driver "bridge"
Restarting categraf   ... done
Restarting nserver    ... done
Restarting nwebapi    ... done
Restarting agentd     ... done
Restarting ibex       ... done
Restarting redis      ... done
Restarting mysql      ... done
Restarting prometheus ... done
传统安装部署
基础环境:redis、mysql5.7
1. 安装 Prometheus
# 安装Prometheus
mkdir -p /opt/prometheus
wget https://s3-gz01.didistatic.com/n9e-pub/prome/prometheus-2.28.0.linux-amd64.tar.gz -O prometheus-2.28.0.linux-amd64.tar.gz
tar xf prometheus-2.28.0.linux-amd64.tar.gz
cp -far prometheus-2.28.0.linux-amd64/*  /opt/prometheus/
# 创建Prometheus service 文件
cat <<EOF >/etc/systemd/system/prometheus.service
[Unit]
Description="prometheus"
Documentation=https://prometheus.io/
After=network.target
[Service]
Type=simple
ExecStart=/opt/prometheus/prometheus  --config.file=/opt/prometheus/prometheus.yml --storage.tsdb.path=/opt/prometheus/data --web.enable-lifecycle --enable-feature=remote-write-receiver --query.lookback-delta=2m
Restart=on-failure
SuccessExitStatus=0
LimitNOFILE=65536
StandardOutput=syslog
StandardError=syslog
SyslogIdentifier=prometheus
[Install]
WantedBy=multi-user.target
EOF
# 启动 Prometheus
systemctl daemon-reload
systemctl enable prometheus
systemctl restart prometheus
systemctl status prometheus
2. 安装夜莺
mkdir -p /opt/n9e && cd /opt/n9e
# 去 https://github.com/didi/nightingale/releases 找最新版本的包
tarball=n9e-5.14.2.tar.gz
urlpath=https://github.com/didi/nightingale/releases/download/v5.14.2/${tarball}
wget $urlpath || exit 1
tar zxvf ${tarball}
# 导入数据库文件
mysql -uroot -p数据库密码 < docker/initsql/a-n9e.sql
2.1 修改夜莺相关配置
由于默认的配置文件的数据库密码为 1234 ,所以需要调整(mysql、redis同理)。
相关配置文件路径:
etc/server.conf
etc/webapi.conf
server.conf
[DB]
# postgres: host=%s port=%s user=%s dbname=%s password=%s sslmode=%s
# 修改为自己已安装的数据库连接信息
DSN="root:1234@tcp(127.0.0.1:3306)/n9e_v5?charset=utf8mb4&parseTime=True&loc=Local&allowNativePasswords=true"
# enable debug mode or not
Debug = false
# mysql postgres
DBType = "mysql"
# unit: s
MaxLifetime = 7200
# max open connections
MaxOpenConns = 150
# max idle connections
MaxIdleConns = 50
# table prefix
TablePrefix = ""
# enable auto migrate or not
# EnableAutoMigrate = false
webapi.conf
[DB]
# 修改为自己已安装的数据库连接信息
DSN="root:1234@tcp(127.0.0.1:3306)/n9e_v5?charset=utf8mb4&parseTime=True&loc=Local&allowNativePasswords=true"
# enable debug mode or not
Debug = false
# mysql postgres
DBType = "mysql"
# unit: s
MaxLifetime = 7200
# max open connections
MaxOpenConns = 150
# max idle connections
MaxIdleConns = 50
# table prefix
TablePrefix = ""
# enable auto migrate or not
# EnableAutoMigrate = false
2.2 创建service文件(日志会记录于系统日志路径:/var/logs/message)----不建议
vim etc/service/n9e-server.service
cp etc/service/n9e-server.service /usr/lib/systemd/system/
systemctl start n9e-server
systemctl enable n9e-server
2.3 启动
nohup ./n9e server &> server.log &
nohup ./n9e webapi &> webapi.log &
# check logs
# check port
3. 安装Ibex(自选)
项目地址:
- Repo:https://github.com/flashcatcloud/ibex
- Linux-amd64 有编译好的二进制:https://github.com/flashcatcloud/ibex/releases
Ibex 是告警自愈功能依赖的模块,提供一个批量执行命令的通道,可以做到在告警的时候自动去目标机器执行脚本。
所谓的告警自愈,典型手段是在告警触发时自动回调某个 webhook 地址,在这个 webhook 里写告警自愈的逻辑,夜莺默认支持这种方式。另外,夜莺还可以更进一步,配合 ibex 这个模块,在告警触发的时候,自动去告警的机器执行某个脚本,这种机制可以大幅简化构建运维自愈链路的工作量,毕竟,不是所有的运维人员都擅长写 http server,但所有的运维人员,都擅长写脚本。这种方式是典型的物理机时代的产物,希望各位朋友用不到这个工具(说明贵司的IT技术已经走得非常靠前了)。
-
架构

ibex 包括 server 和 agentd 两个模块,agentd 周期性调用 server 的 rpc 接口,询问有哪些任务要执行,如果有分配给自己的任务,就从 server 拿到任务脚本信息,在本地 fork 一个进程运行,然后将结果上报给服务端。为了简化部署,server 和 agentd 融合成了一个二进制,就是 ibex,通过传入不同的参数来启动不同的角色。ibex 架构图如下:
-
安装
下载安装包之后,解压缩,在 etc 下可以找到服务端和客户端的配置文件,在 sql 目录下可以找到初始化 sql 脚本。
3.1 初始化 sql
mysql < sql/ibex.sql
3.2 启动 server
server 的配置文件是 etc/server.conf,注意修改里边的 mysql 连接地址,配置正确的 mysql 用户名和密码。然后就可以直接启动了:
nohup ./ibex server &> server.log &
ibex 没有 web 页面,只提供 api 接口,鉴权方式是 http basic auth,basic auth 的用户名和密码默认都是 ibex,在 etc/server.conf 中可以找到,如果ibex 部署在互联网,一定要修改默认用户名和密码,当然,因为 Nightingale 要调用 ibex,所以 Nightingale 的 server.conf 和 webapi.conf 中也配置了 ibex 的 basic auth 账号信息,需要一并修改。
3.3 启动agentd
客户端的配置agentd.conf 内容如下:
# debug, release
RunMode = "release"
# task meta storage dir
MetaDir = "./meta"
[Heartbeat]
# unit: ms
Interval = 1000
# rpc servers
Servers = ["10.2.3.4:20090"]
# $ip or $hostname or specified string
Host = "telegraf01"
- Heartbeat:Interval 是心跳频率,默认是 1000 毫秒,如果机器量比较小,比如小于 1000 台,维持 1000 毫秒没问题,如果机器量比较大,可以适当调大这个频率,比如 2000 或者 3000,可以减轻服务端的压力。
- Servers:数组,配置的是 ibex-server 的地址,ibex-server 可以启动多个,多个地址都配置到这里即可。
- Host:本机的唯一标识,有三种配置方式,如果配置为
$ip,系统会自动探测本机的 IP,如果是 $hostname,系统会自动探测本机的 hostname,如果是其他字符串,那就直接把该字符串作为本机的唯一标识。每个机器上都要部署 ibex-agentd,不同的机器要保证 Host 字段获取的内容不能重复。
要想做到告警的机器自动执行脚本,需要保证告警消息中的 ident 表示机器标识,且和 ibex-agentd 中的 Host 配置对应上。
下面是启动 ibex-agentd 的命令:
nohup ./ibex agentd &> agentd.log &
配置
nightingale
server.conf
# debug, release
# 运行方式选择
RunMode = "release"

# 集群名称,必须与webapi.conf 中对应"[[Clusters]]"配置下的name保持一致,且不能为中文
# my cluster name
ClusterName = "ZW-HLW"

# 默认业务组关键字名称,不要更改
# Default busigroup Key name
# do not change
BusiGroupLabelKey = "busigroup"

# 休眠时间,休眠x秒,然后启动判断引擎
# sleep x seconds, then start judge engine
EngineDelay = 60
# 禁用使用率报告
DisableUsageReport = false

# 从那里读取配置,默认为config
# config | database
ReaderFrom = "config"

# 日志配置
[Log]
# log write dir
Dir = "logs"
# log level: DEBUG INFO WARNING ERROR
Level = "INFO"
# stdout, stderr, file
Output = "stdout"
# # rotate by time
# KeepHours: 4
# # rotate by size
# RotateNum = 3
# # unit: MB
# RotateSize = 256

# http配置
[HTTP]
# http listening address
Host = "0.0.0.0"
# http listening port
Port = 19000
# https cert file path
CertFile = ""
# https key file path
KeyFile = ""
# whether print access log
PrintAccessLog = false
# whether enable pprof
PProf = false
# http graceful shutdown timeout, unit: s
ShutdownTimeout = 30
# max content length: 64M
MaxContentLength = 67108864
# http server read timeout, unit: s
ReadTimeout = 20
# http server write timeout, unit: s
WriteTimeout = 40
# http server idle timeout, unit: s
IdleTimeout = 120

# [BasicAuth]
# user002 = "ccc26da7b9aba533cbb263a36c07dcc9"

# 心跳配置
[Heartbeat]
# auto detect if blank
IP = ""
# unit ms
Interval = 1000

# 邮件服务配置,不需要请全注释
[SMTP]
Host = "smtp.163.com"
Port = 994
User = "username"
Pass = "password"
From = "username@163.com"
InsecureSkipVerify = true
Batch = 5

# 消息通知媒介配置(告警)
## 模板配置
### TemplatesDir指定模板文件的目录,这个目录下有多个模板文件,遵从Go Template语法,可以控制告警发送的消息的格式
### NotifyConcurrency 表示并发度,可以维持默认,处理不过来了,有事件堆积(事件是否堆积可以查看n9e-server的这个指标:n9e_server_alert_queue_size,通过 /metrics 接口暴露的)了再调大
### NotifyBuiltinChannels 是配置Go代码内置的通知媒介,默认5个通知媒介都让Go代码来做,如果某些通知媒介想做一些自定义,可以从这个数组中删除对应的通知媒介,Go代码就不处理那个通知媒介了,自定义的通知媒介可以在后面介绍的脚本里自行处理,灵活自定义
[Alerting]
# timeout settings, unit: ms, default: 30000ms
Timeout=30000
TemplatesDir = "./etc/template"
NotifyConcurrency = 10
# use builtin go code notify
NotifyBuiltinChannels = ["email", "dingtalk", "wecom", "feishu", "mm"]

## 配置告警通知脚本
### CallScript是配置告警通知脚本的,如果没有自定义的需求,Go内置的5种发送通道 ["email", "dingtalk", "wecom", "feishu","mm"] 完全可以满足需求,这个CallScript是无需关注的,所以默认Enable=false。
### 如果内置的发送逻辑搞不定了,比如想支持短信、电话等通知方式,就可以启用CallScript,夜莺发现这里的Enable=true且指定了一个脚本,就会去执行这个脚本,把告警事件的内容发给这个脚本,由这个脚本做后续处理。
### notify.py的同级目录,还有一个notify.bak.py,很多逻辑可以参考这个脚本。因为夜莺刚开始的版本发送告警只能通过脚本来做,后来才内置到go代码中的,所以,notify.bak.py里备份了很多老的逻辑,大家可以参考。
[Alerting.CallScript]
# built in sending capability in go code
# so, no need enable script sender
Enable = false
ScriptPath = "./etc/script/notify.py"

## CallPlugin是动态链接库的方式加载外部逻辑,默认Enable=false
[Alerting.CallPlugin]
Enable = false
# use a plugin via `go build -buildmode=plugin -o notify.so`
PluginPath = "./etc/script/notify.so"
# The first letter must be capitalized to be exported
Caller = "N9eCaller"

## 这个配置如果开启,n9e-server会把生成的告警事件publish给redis,如果有自定义的逻辑,可以去subscribe,然后自行处理。
[Alerting.RedisPub]
Enable = false
# complete redis key: ${ChannelPrefix} + ${Cluster}
ChannelPrefix = "/alerts/"

## 这是全局Webhook,如果启用,n9e-server生成告警事件之后,就会回调这个Url,对接一些第三方系统。告警事件的内容会encode成json,放到HTTP request body中,POST给这个Url,也可以自定义Header,即Headers配置,Headers是个数组,必须是偶数个,Key1, Value1, Key2, Value2 这个写法。
[Alerting.Webhook]
Enable = false
Url = "http://a.com/n9e/callback"
BasicAuthUser = ""
BasicAuthPass = ""
Timeout = "5s"
Headers = ["Content-Type", "application/json", "X-From", "N9E"]

[NoData]
Metric = "target_up"
# unit: second
Interval = 120

# 自愈组件配置
[Ibex]
# callback: ${ibex}/${tplid}/${host}
Address = "ibex:10090"
# basic auth
BasicAuthUser = "ibex"
BasicAuthPass = "ibex"
# unit: ms
Timeout = 3000

# redis连接配置
[Redis]
# address, ip:port
Address = "redis:6379"
# requirepass
Password = ""
# # db
# DB = 0

# mysql连接配置
[DB]
# postgres: host=%s port=%s user=%s dbname=%s password=%s sslmode=%s
DSN="root:数据库密码@tcp(mysql:3306)/n9e_v5?charset=utf8mb4&parseTime=True&loc=Local&allowNativePasswords=true"
# enable debug mode or not
Debug = false
# mysql postgres
DBType = "mysql"
# unit: s
MaxLifetime = 7200
# max open connections
MaxOpenConns = 150
# max idle connections
MaxIdleConns = 50
# table prefix
TablePrefix = ""
# enable auto migrate or not
# EnableAutoMigrate = false

# 一个server对应一个时序库,表示:去该时序库读取监控数据
# 采集器采集数据上报给server,server将获取的数据写入writer,server获取数据分析判断从reader处读
[Reader]
# prometheus base url
Url = "http://prometheus:9090"
# Basic auth username
BasicAuthUser = ""
# Basic auth password
BasicAuthPass = ""
# timeout settings, unit: ms
Timeout = 30000
DialTimeout = 3000
MaxIdleConnsPerHost = 100

[WriterOpt]
# queue channel count
QueueCount = 1000
# queue max size
QueueMaxSize = 1000000
# once pop samples number from queue
QueuePopSize = 1000
# metric or ident
ShardingKey = "ident"

# 一个server对应一个【reader】,对应多个[[writer]],及将采集器上报的数据存储与不同的时序库
[[Writers]]
Url = "http://prometheus:9090/api/v1/write"
# Basic auth username
BasicAuthUser = ""
# Basic auth password
BasicAuthPass = ""
# timeout settings, unit: ms
Timeout = 10000
DialTimeout = 3000
TLSHandshakeTimeout = 30000
ExpectContinueTimeout = 1000
IdleConnTimeout = 90000
# time duration, unit: ms
KeepAlive = 30000
MaxConnsPerHost = 0
MaxIdleConns = 100
MaxIdleConnsPerHost = 100
# [[Writers.WriteRelabels]]
# Action = "replace"
# SourceLabels = ["__address__"]
# Regex = "([^:]+)(?::\\d+)?"
# Replacement = "$1:80"
# TargetLabel = "__address__"

# [[Writers]]
# Url = "http://m3db:7201/api/v1/prom/remote/write"
# # Basic auth username
# BasicAuthUser = ""
# # Basic auth password
# BasicAuthPass = ""
# # timeout settings, unit: ms
# Timeout = 30000
# DialTimeout = 10000
# TLSHandshakeTimeout = 30000
# ExpectContinueTimeout = 1000
# IdleConnTimeout = 90000
# # time duration, unit: ms
# KeepAlive = 30000
# MaxConnsPerHost = 0
# MaxIdleConns = 100
# MaxIdleConnsPerHost = 100
webapi.conf
# debug, release
# 运行方式选择
RunMode = "release"

# i18n配置相关
# # custom i18n dict config
# I18N = "./etc/i18n.json"

# # custom i18n request header key
# I18NHeaderKey = "X-Language"

# metrics descriptions
MetricsYamlFile = "./etc/metrics.yaml"
BuiltinAlertsDir = "./etc/alerts"
BuiltinDashboardsDir = "./etc/dashboards"

# config | api
ClustersFrom = "config"

# using when ClustersFrom = "api"
# ClustersFromAPIs = []

# 告警通知渠道配置
[[NotifyChannels]]
Label = "邮箱"
# do not change Key
Key = "email"

[[NotifyChannels]]
Label = "钉钉机器人"
# do not change Key
Key = "dingtalk"

[[NotifyChannels]]
Label = "企微机器人"
# do not change Key
Key = "wecom"

[[NotifyChannels]]
Label = "飞书机器人"
# do not change Key
Key = "feishu"

[[NotifyChannels]]
Label = "mm bot"
# do not change Key
Key = "mm"

[[ContactKeys]]
Label = "Wecom Robot Token"
# do not change Key
Key = "wecom_robot_token"

[[ContactKeys]]
Label = "Dingtalk Robot Token"
# do not change Key
Key = "dingtalk_robot_token"

[[ContactKeys]]
Label = "Feishu Robot Token"
# do not change Key
Key = "feishu_robot_token"

[[ContactKeys]]
Label = "MatterMost Webhook URL"
# do not change Key
Key = "mm_webhook_url"

# 日志配置
[Log]
# log write dir
Dir = "logs"
# log level: DEBUG INFO WARNING ERROR
Level = "DEBUG"
# stdout, stderr, file
Output = "stdout"
# # rotate by time
# KeepHours: 4
# # rotate by size
# RotateNum = 3
# # unit: MB
# RotateSize = 256

# http服务配置
[HTTP]
# http listening address
Host = "0.0.0.0"
# http listening port
Port = 18000
# https cert file path
CertFile = ""
# https key file path
KeyFile = ""
# whether print access log
PrintAccessLog = true
# whether enable pprof
PProf = false
# http graceful shutdown timeout, unit: s
ShutdownTimeout = 30
# max content length: 64M
MaxContentLength = 67108864
# http server read timeout, unit: s
ReadTimeout = 20
# http server write timeout, unit: s
WriteTimeout = 40
# http server idle timeout, unit: s
IdleTimeout = 120

# JWT授权,建议更改SigningKey
[JWTAuth]
# signing key
SigningKey = "5b94a0fd640fe2765af826acfe42d151"
# unit: min
AccessExpired = 1500
# unit: min
RefreshExpired = 10080
RedisKeyPrefix = "/jwt/"

# 代理授权
[ProxyAuth]
# if proxy auth enabled, jwt auth is disabled
Enable = false
# username key in http proxy header
HeaderUserNameKey = "X-User-Name"
DefaultRoles = ["Standard"]

# 基本认证,建议更改
[BasicAuth]
user001 = "ccc26da7b9aba533cbb263a36c07dcc5"

# 匿名访问配置,默认关闭
[AnonymousAccess]
PromQuerier = false
AlertDetail = false

# LDAP配置,不涉及,可全注释
[LDAP]
Enable = false
Host = "ldap.example.org"
Port = 389
BaseDn = "dc=example,dc=org"
# AD: manange@example.org
BindUser = "cn=manager,dc=example,dc=org"
BindPass = "*******"
# openldap format e.g. (&(uid=%s))
# AD format e.g. (&(sAMAccountName=%s))
AuthFilter = "(&(uid=%s))"
CoverAttributes = true
TLS = false
StartTLS = true
# ldap user default roles
DefaultRoles = ["Standard"]

[LDAP.Attributes]
Nickname = "cn"
Phone = "mobile"
Email = "mail"

# OIDC认证配置,默认
[OIDC]
Enable = false
RedirectURL = "http://n9e.com/callback"
SsoAddr = "http://sso.example.org"
ClientId = ""
ClientSecret = ""
CoverAttributes = true
DefaultRoles = ["Standard"]

[OIDC.Attributes]
Nickname = "nickname"
Phone = "phone_number"
Email = "email"

# redis连接配置
[Redis]
# address, ip:port
Address = "redis:6379"
# requirepass
Password = ""
# # db
# DB = 0

# mysql连接配置
[DB]
# postgres: host=%s port=%s user=%s dbname=%s password=%s sslmode=%s
DSN="root:数据库密码@tcp(mysql:3306)/n9e_v5?charset=utf8mb4&parseTime=True&loc=Local&allowNativePasswords=true"
# enable debug mode or not
Debug = true
# mysql postgres
DBType = "mysql"
# unit: s
MaxLifetime = 7200
# max open connections
MaxOpenConns = 150
# max idle connections
MaxIdleConns = 50
# table prefix
TablePrefix = ""
# enable auto migrate or not
# EnableAutoMigrate = false

# [[ ]] 数组配置,可复制多份;集群配置,多集群接入时,配置多个Clusters,如下配置接入两个Prometheus集群
[[Clusters]]
# Prometheus cluster name
# 与server.conf的clustername 必须保持一致
Name = "ZW-HLW"
# Prometheus APIs base url
Prom = "http://prometheus:9090"
# Basic auth username
BasicAuthUser = ""
# Basic auth password
BasicAuthPass = ""
# timeout settings, unit: ms
Timeout = 30000
DialTimeout = 3000
MaxIdleConnsPerHost = 100

[[Clusters]]
# Prometheus cluster name
Name = "ZW-WW"
# # Prometheus APIs base url
Prom = "http://1.2.3.4:9090"
# # Basic auth username
BasicAuthUser = ""
# # Basic auth password
BasicAuthPass = ""
# # timeout settings, unit: ms
Timeout = 30000
DialTimeout = 3000
MaxIdleConnsPerHost = 100

# 自愈模块配置
[Ibex]
Address = "http://ibex:10090"
# basic auth
BasicAuthUser = "ibex"
BasicAuthPass = "ibex"
# unit: ms
Timeout = 3000

# TargetMetrics
[TargetMetrics]
TargetUp = '''max(max_over_time(target_up{ident=~"(%s)"}[%dm])) by (ident)'''
LoadPerCore = '''max(max_over_time(system_load_norm_1{ident=~"(%s)"}[%dm])) by (ident)'''
MemUtil = '''100-max(max_over_time(mem_available_percent{ident=~"(%s)"}[%dm])) by (ident)'''
DiskUtil = '''max(max_over_time(disk_used_percent{ident=~"(%s)", path="/"}[%dm])) by (ident)'''
alert_cur_event.go
警报当前事件源码:/src/models/alert_cur_event.go;
通过源码字段信息,可根据实际需求,定制化告警模板内容。
type AlertCurEvent struct {
	Id                 int64             `json:"id" gorm:"primaryKey"`                                          告警事件ID 【告警管理】→【历史告
	Cate               string            `json:"cate"`                                                          数据源类型
	Cluster            string            `json:"cluster"`                                                       所属集群名称
	GroupId            int64             `json:"group_id"`   // busi group id                                   所属业务组ID
	GroupName          string            `json:"group_name"` // busi group name                                 所属业务组名称
	Hash               string            `json:"hash"`       // rule_id + vector_key                            Hash值
	RuleId             int64             `json:"rule_id"`                                                       告警规则ID
	RuleName           string            `json:"rule_name"`                                                     告警规则名称
	RuleNote           string            `json:"rule_note"`                                                     告警规则备注
	RuleProd           string            `json:"rule_prod"`                                                     规则产品
	RuleAlgo           string            `json:"rule_algo"`                                                     规则算法
	Severity           int               `json:"severity"`                                                      告警级别1、2、3
	PromForDuration    int               `json:"prom_for_duration"`                                             持续时间
	PromQl             string            `json:"prom_ql"`                                                       告警规则PromQl
	PromEvalInterval   int               `json:"prom_eval_interval"`                                            执行频率
	Callbacks          string            `json:"-"`                  // for db
	CallbacksJSON      []string          `json:"callbacks" gorm:"-"` // for fe
	RunbookUrl         string            `json:"runbook_url"`                                                   回调地址
	NotifyRecovered    int               `json:"notify_recovered"`                                              启用恢复通知
	NotifyChannels     string            `json:"-"`                          // for db                          通知渠道
	NotifyChannelsJSON []string          `json:"notify_channels" gorm:"-"`   // for fe                          通知渠道json
	NotifyGroups       string            `json:"-"`                          // for db                          通知组
	NotifyGroupsJSON   []string          `json:"notify_groups" gorm:"-"`     // for fe                          通知组json
	NotifyGroupsObj    []*UserGroup      `json:"notify_groups_obj" gorm:"-"` // for fe                          通知组obj
	TargetIdent        string            `json:"target_ident"`                                                  目标标识,即告警服务器配置的Ident
	TargetNote         string            `json:"target_note"`                                                   目标备注,即告警服务器配置的备注
	TriggerTime        int64             `json:"trigger_time"`                                                  触发时间
	TriggerValue       string            `json:"trigger_value"`                                                 触发时值
	Tags               string            `json:"-"`                         // for db                           标签
	TagsJSON           []string          `json:"tags" gorm:"-"`             // for fe                           标签json
	TagsMap            map[string]string `json:"-" gorm:"-"`                // for internal usage               标签map
	IsRecovered        bool              `json:"is_recovered" gorm:"-"`     // for notify.py                    已恢复
	NotifyUsersObj     []*User           `json:"notify_users_obj" gorm:"-"` // for notify.py                    通知用户对象
	LastEvalTime       int64             `json:"last_eval_time" gorm:"-"`   // for notify.py 上次计算的时间
	LastSentTime       int64             `json:"last_sent_time" gorm:"-"`   // 上次发送时间
	NotifyCurNumber    int               `json:"notify_cur_number"`         // notify: current number           通知当前号码
	FirstTriggerTime   int64             `json:"first_trigger_time"`        //连续告警的首次告警时间
}
Prometheus
prometheus.yaml
一个默认的prometheus配置文件,此次不做详解。
# my global config
global:
  scrape_interval:     15s # Set the scrape interval to every 15 seconds. Default is every 1 minute.
  evaluation_interval: 15s # Evaluate rules every 15 seconds. The default is every 1 minute.
  # scrape_timeout is set to the global default (10s).

# Alertmanager configuration
alerting:
  alertmanagers:
  - static_configs:
    - targets:
      # - alertmanager:9093

# Load rules once and periodically evaluate them according to the global 'evaluation_interval'.
rule_files:
  # - "first_rules.yml"
  # - "second_rules.yml"

# A scrape configuration containing exactly one endpoint to scrape:
# Here it's Prometheus itself.
scrape_configs:
  # The job name is added as a label `job=<job_name>` to any timeseries scraped from this config.
  - job_name: 'prometheus'

    # metrics_path defaults to '/metrics'
    # scheme defaults to 'http'.

    static_configs:
    - targets: ['localhost:9090']

  - job_name: 'n9e'
    file_sd_configs:
    - files:
      - targets.json
Ibex
服务端配置
etc/server.conf服务端配置
# 运行方式选择
# debug, release
RunMode = "release"

# 日志配置
[Log]
# log write dir
Dir = "logs-server"
# log level: DEBUG INFO WARNING ERROR
Level = "DEBUG"
# stdout, stderr, file
Output = "stdout"
# # rotate by time
# KeepHours: 4
# # rotate by size
# RotateNum = 3
# # unit: MB
# RotateSize = 256

# http配置
[HTTP]
Enable = true
# http listening address
Host = "0.0.0.0"
# http listening port
Port = 10090
# https cert file path
CertFile = ""
# https key file path
KeyFile = ""
# whether print access log
PrintAccessLog = true
# whether enable pprof
PProf = false
# http graceful shutdown timeout, unit: s
ShutdownTimeout = 30
# max content length: 64M
MaxContentLength = 67108864
# http server read timeout, unit: s
ReadTimeout = 20
# http server write timeout, unit: s
WriteTimeout = 40
# http server idle timeout, unit: s
IdleTimeout = 120

# 基础认证,用于api调用,默认ibex,建议更改
[BasicAuth]
# using when call apis
ibex = "ibex"

# RPC协议监听
[RPC]
Listen = "0.0.0.0:20090"

# 心跳配置
[Heartbeat]
# auto detect if blank
IP = ""
# unit: ms
Interval = 1000

# 输出 默认databases
[Output]
# database | remote
ComeFrom = "database"
AgtdPort = 2090

# 对象关联映射配置,指定模式、数据库类型、最大连接数等
[Gorm]
# enable debug mode or not
Debug = false
# mysql postgres
DBType = "mysql"
# unit: s
MaxLifetime = 7200
# max open connections
MaxOpenConns = 150
# max idle connections
MaxIdleConns = 50
# table prefix
TablePrefix = ""

# mysql连接配置
[MySQL]
# mysql address host:port
Address = "mysql:3306"
# mysql username
User = "root"
# mysql password
Password = "数据库密码@tcp"
# database name
DBName = "ibex"
# connection params
Parameters = "charset=utf8mb4&parseTime=True&loc=Local&allowNativePasswords=true"

# 如果Gorm中dbtype=postgres,则配置postgres库连接信息
[Postgres]
## pg address host:port
#Address = "postgres:5432"
## pg user
#User = "root"
## pg password
#Password = "1234"
## database name
#DBName = "ibex"
## ssl mode
#SSLMode = "disable"
客户端配置
etc/agentd.conf客户端配置
# 运行方式选择
# debug, release
RunMode = "release"

# 存储目录
# task meta storage dir
MetaDir = "./meta"

# http配置
[HTTP]
Enable = true
# http listening address
Host = "0.0.0.0"
# http listening port
Port = 2090
# https cert file path
CertFile = ""
# https key file path
KeyFile = ""
# whether print access log
PrintAccessLog = true
# whether enable pprof
PProf = false
# http graceful shutdown timeout, unit: s
ShutdownTimeout = 30
# max content length: 64M
MaxContentLength = 67108864
# http server read timeout, unit: s
ReadTimeout = 20
# http server write timeout, unit: s
WriteTimeout = 40
# http server idle timeout, unit: s
IdleTimeout = 120

# 心跳配置
## Interval 是心跳频率,默认是 1000 毫秒,如果机器量比较小,比如小于 1000 台,维持 1000 毫秒没问题,如果机器量比较大,可以适当调大这个频率,比如 2000 或者 3000,可以减轻服务端的压力
## Servers 是个数组,配置的是 ibex-server 的地址,ibex-server 可以启动多个,多个地址都配置到这里即可,Host 这个字段,是本机的唯一标识,有三种配置方式,如果配置为 $ip,系统会自动探测本机的 IP,如果是 $hostname,系统会自动探测本机的 hostname,如果是其他字符串,那就直接把该字符串作为本机的唯一标识。每个机器上都要部署 ibex-agentd,不同的机器要保证 Host 字段获取的内容不能重复
[Heartbeat]
# unit: ms
Interval = 1000
# rpc servers
Servers = ["ibex:20090"]
# $ip or $hostname or specified string
#Host = "test"
Host = $ip
#Host = $hostname
监控对象
夜莺的监控对象及所监控的主机
监控看图
监控看图包含:夜莺监控大盘、pormql即时查询、自定义快捷视图
即时查询:用于快速定位排查,以及监控指标验等;快捷视图:用于自定义快速查询指定监控主机的所有监控项结果;监控大盘:自定义大盘,指定展示监控项结果。夜莺带有基本的内置大盘,可直接导入使用,也可自定义编辑,支持JSON、Grafana大盘JSON直接导入使用,也可图形化编辑。
mysql监控大盘
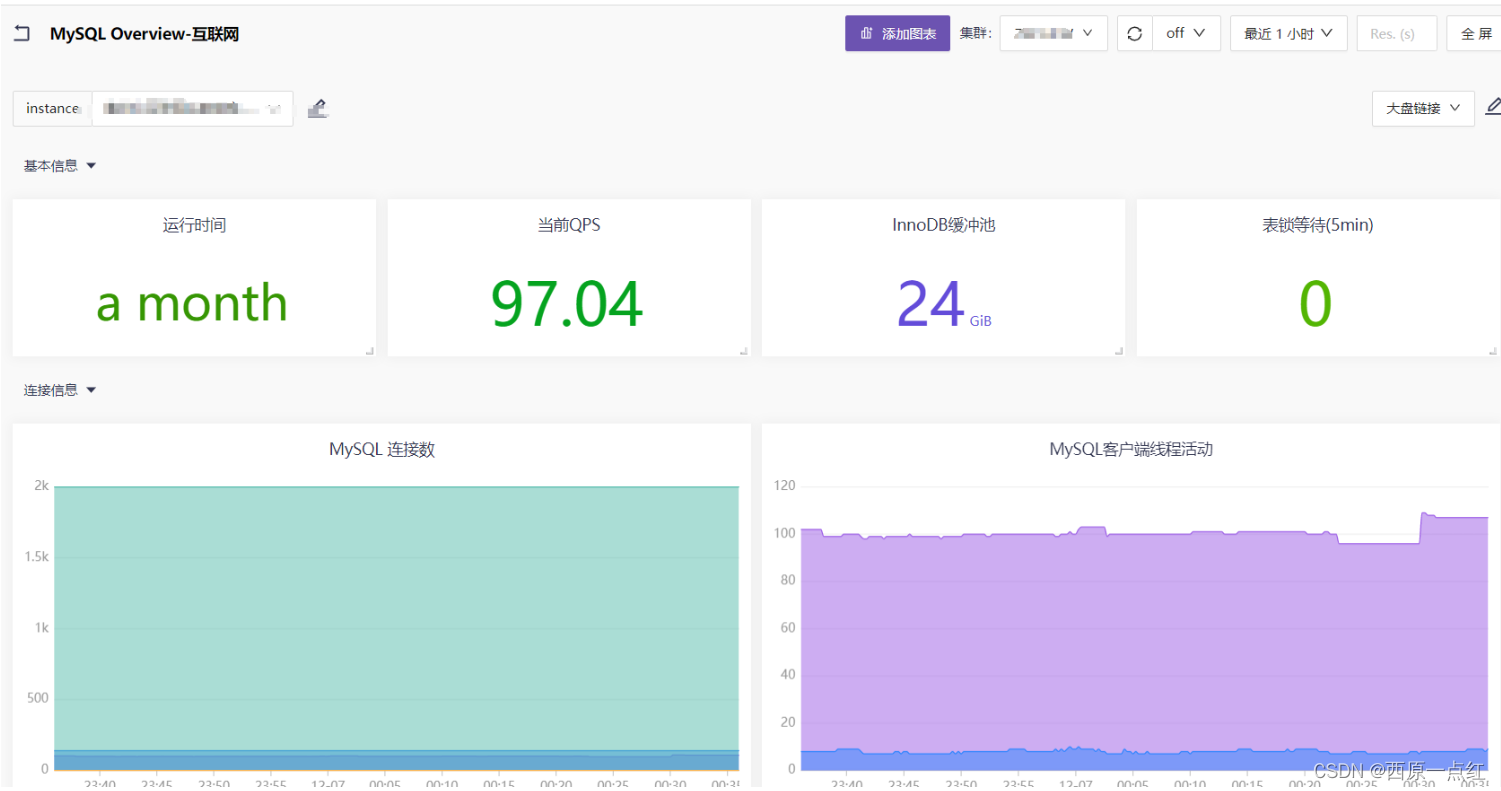
大盘json:
{
"name": "MySQL Overview-互联网",
"tags": "Prometheus MySQL",
"ident": "",
"configs": {
"var": [
{
"name": "instance",
"definition": "label_values(mysql_global_status_uptime, instance)"
}
],
"version": "2.0.0",
"panels": [
{
"id": "1f0a7808-3b6f-48a0-95bc-fc91eef560bc",
"type": "row",
"name": "基本信息",
"layout": {
"h": 1,
"w": 24,
"x": 0,
"y": 0,
"i": "1f0a7808-3b6f-48a0-95bc-fc91eef560bc",
"isResizable": false
},
"collapsed": true
},
{
"type": "stat",
"id": "724e2c33-3c91-48ff-a1f5-b8971eb824cb",
"layout": {
"h": 3,
"w": 6,
"x": 0,
"y": 1,
"i": "724e2c33-3c91-48ff-a1f5-b8971eb824cb",
"isResizable": true
},
"version": "2.0.0",
"datasourceCate": "prometheus",
"targets": [
{
"expr": "min(mysql_global_status_uptime{instance=~\"$instance\"})"
}
],
"name": "运行时间",
"description": "**uptime**\n\nmysql运行时间",
"custom": {
"textMode": "value",
"colorMode": "value",
"calc": "lastNotNull",
"valueField": "Value",
"colSpan": 1,
"textSize": {}
},
"options": {
"valueMappings": [
{
"type": "range",
"match": {
"to": 1800
},
"result": {
"color": "#ec7718"
}
},
{
"type": "range",
"match": {
"from": 1800
},
"result": {
"color": "#369603"
}
}
],
"standardOptions": {
"util": "humantimeSeconds"
},
"thresholds": {
"steps": [
{
"color": "#634CD9",
"value": null,
"type": "base"
}
]
}
}
},
{
"type": "stat",
"id": "5f488411-d117-4ed1-847d-69d700de8d98",
"layout": {
"h": 3,
"w": 6,
"x": 6,
"y": 1,
"i": "5f488411-d117-4ed1-847d-69d700de8d98",
"isResizable": true
},
"version": "2.0.0",
"datasourceCate": "prometheus",
"targets": [
{
"expr": "rate(mysql_global_status_queries{instance=~\"$instance\"}[5m])"
}
],
"name": "当前QPS",
"description": "**mysql_global_status_queries**\n\n五分钟内,每秒请求的数量,即QPS",
"custom": {
"textMode": "value",
"colorMode": "value",
"calc": "lastNotNull",
"valueField": "Value",
"colSpan": 1,
"textSize": {}
},
"options": {
"valueMappings": [
{
"type": "range",
"match": {
"to": 100
},
"result": {
"color": "#05a31f"
}
},
{
"type": "range",
"match": {
"from": 100
},
"result": {
"color": "#ea3939"
}
}
],
"standardOptions": {
"decimals": 2
},
"thresholds": {
"steps": [
{
"color": "#634CD9",
"value": null,
"type": "base"
}
]
}
}
},
{
"type": "stat",
"id": "371b9b9e-1279-4d6e-b2e1-b81bdb599b1f",
"layout": {
"h": 3,
"w": 6,
"x": 12,
"y": 1,
"i": "371b9b9e-1279-4d6e-b2e1-b81bdb599b1f",
"isResizable": true
},
"version": "2.0.0",
"datasourceCate": "prometheus",
"targets": [
{
"expr": "avg(mysql_global_variables_innodb_buffer_pool_size{instance=~\"$instance\"})"
}
],
"name": "InnoDB缓冲池",
"description": "**InnoDB Buffer Pool Size**\n\nInnoDB缓冲池的页数量,每页大小16K\n\n\nInnoDB维护一个称为缓冲池的存储区域,用于在内存中缓存数据和索引。了解InnoDB缓冲池的工作原理,并利用它将频繁访问的数据保存在内存中,是MySQL调优最重要的方面之一。目标是将工作集保存在内存中。在大多数情况下,这应该是专用数据库主机上可用内存的60%-90%,但这取决于许多因素。",
"custom": {
"textMode": "value",
"colorMode": "value",
"calc": "lastNotNull",
"valueField": "Value",
"colSpan": 1,
"textSize": {}
},
"options": {
"standardOptions": {
"util": "bytesIEC"
},
"thresholds": {
"steps": [
{
"color": "#634CD9",
"value": null,
"type": "base"
}
]
}
}
},
{
"type": "stat",
"id": "d46359dc-26c4-48e0-8c51-2fe3cdbe3ddb",
"layout": {
"h": 3,
"w": 6,
"x": 18,
"y": 1,
"i": "d46359dc-26c4-48e0-8c51-2fe3cdbe3ddb",
"isResizable": true
},
"version": "2.0.0",
"datasourceCate": "prometheus",
"targets": [
{
"expr": "sum(increase(mysql_global_status_table_locks_waited{instance=~\"$instance\"}[5m]))"
}
],
"name": "表锁等待(5min)",
"description": "**Table Locks**\n\n显示了有多少表被锁住了并且导致服务器级的锁等待(存储引擎级的锁,如InnoDB行级锁,不会使该变量增加).\n如果这个值比较高或者正在增加,那么表明存在严重的并发瓶颈.\n\nMySQL由于各种原因采用了许多不同的锁。在此图中,我们可以看到MySQL从存储引擎请求了多少个表级锁。在InnoDB的例子中,很多时候锁实际上可以是行锁,因为它只在少数特定情况下使用表级锁。\n\n比较立即锁定和等待锁定最有用。如果等待的锁正在增加,这意味着您有锁争用。否则,锁立即上升和下降是正常活动。",
"custom": {
"textMode": "value",
"colorMode": "value",
"calc": "lastNotNull",
"valueField": "Value",
"colSpan": 1,
"textSize": {}
},
"options": {
"valueMappings": [
{
"type": "range",
"match": {
"from": 1
},
"result": {
"color": "#e70d0d"
}
},
{
"type": "range",
"match": {
"to": 1
},
"result": {
"color": "#53b503"
}
}
],
"standardOptions": {},
"thresholds": {
"steps": [
{
"color": "#634CD9",
"value": null,
"type": "base"
}
]
}
}
},
{
"id": "5a13dc0e-7adf-4724-adef-f3a63abeb7db",
"type": "row",
"name": "连接信息",
"layout": {
"h": 1,
"w": 24,
"x": 0,
"y": 4,
"i": "5a13dc0e-7adf-4724-adef-f3a63abeb7db",
"isResizable": false
},
"collapsed": true
},
{
"type": "timeseries",
"id": "a59f9de6-e2b3-42d9-bae1-838ba103e0f9",
"layout": {
"h": 7,
"w": 12,
"x": 0,
"y": 5,
"i": "a59f9de6-e2b3-42d9-bae1-838ba103e0f9",
"isResizable": true
},
"version": "2.0.0",
"datasourceCate": "prometheus",
"targets": [
{
"expr": "sum(mysql_global_status_threads_connected{instance=~\"$instance\"})",
"legend": "Connections"
},
{
"expr": "sum(mysql_global_status_max_used_connections{instance=~\"$instance\"})",
"legend": "Max Used Connections"
},
{
"expr": "sum(mysql_global_variables_max_connections{instance=~\"$instance\"})",
"legend": "Max Connections"
},
{
"expr": "sum(rate(mysql_global_status_aborted_connects{instance=~\"$instance\"}[5m]))",
"legend": "Aborted Connections"
}
],
"name": "MySQL 连接数",
"description": "**Max Connections** \n\nMax Connections:允许同时保持在打开状态的客户连接的最大个数\n\nMax Used Connections:自服务器启动以来同时使用的最大连接数\n\nConnections:当前打开的连接数。\n\nAborted connections:连接MySQL服务器失败的次数",
"options": {
"tooltip": {
"mode": "all",
"sort": "desc"
},
"legend": {
"displayMode": "hidden"
},
"standardOptions": {},
"thresholds": {
"steps": [
{
"color": "#634CD9",
"value": null,
"type": "base"
}
]
}
},
"custom": {
"drawStyle": "lines",
"lineInterpolation": "smooth",
"spanNulls": false,
"lineWidth": 1,
"fillOpacity": 0.5,
"gradientMode": "none",
"stack": "off",
"scaleDistribution": {
"type": "linear"
}
}
},
{
"type": "timeseries",
"id": "5a8898a8-6762-4a7e-ba19-dd6c960cddb8",
"layout": {
"h": 7,
"w": 12,
"x": 12,
"y": 5,
"i": "5a8898a8-6762-4a7e-ba19-dd6c960cddb8",
"isResizable": true
},
"version": "2.0.0",
"datasourceCate": "prometheus",
"targets": [
{
"expr": "sum(mysql_global_status_threads_connected{instance=~\"$instance\"})",
"legend": "Threads Connected"
},
{
"expr": "sum(mysql_global_status_threads_running{instance=~\"$instance\"})",
"legend": "Threads Running"
}
],
"name": "MySQL客户端线程活动",
"description": "**MySQL client thread activity**\n\nThreads Connected :当前打开的连接数。\n\nThreads Running :未休眠的线程数",
"options": {
"tooltip": {
"mode": "all",
"sort": "desc"
},
"legend": {
"displayMode": "hidden"
},
"standardOptions": {},
"thresholds": {
"steps": [
{
"color": "#634CD9",
"value": null,
"type": "base"
}
]
}
},
"custom": {
"drawStyle": "lines",
"lineInterpolation": "smooth",
"spanNulls": false,
"lineWidth": 1,
"fillOpacity": 0.5,
"gradientMode": "none",
"stack": "off",
"scaleDistribution": {
"type": "linear"
}
}
},
{
"id": "2611b7d3-8ab2-4a8d-ae20-fae097a68cfc",
"type": "row",
"name": "查询性能",
"layout": {
"h": 1,
"w": 24,
"x": 0,
"y": 12,
"i": "2611b7d3-8ab2-4a8d-ae20-fae097a68cfc",
"isResizable": false
},
"collapsed": true
},
{
"type": "timeseries",
"id": "524e8a33-14c9-4575-b428-0e866f828d48",
"layout": {
"h": 7,
"w": 12,
"x": 0,
"y": 13,
"i": "524e8a33-14c9-4575-b428-0e866f828d48",
"isResizable": true
},
"version": "2.0.0",
"datasourceCate": "prometheus",
"targets": [
{
"expr": "sum(rate(mysql_global_status_created_tmp_tables{instance=~\"$instance\"}[5m]))",
"legend": "Created Tmp Tables"
},
{
"expr": "sum(rate(mysql_global_status_created_tmp_disk_tables{instance=~\"$instance\"}[5m]))",
"legend": "Created Tmp Disk Tables"
},
{
"expr": "sum(rate(mysql_global_status_created_tmp_files{instance=~\"$instance\"}[5m]))",
"legend": "Created Tmp Files"
}
],
"name": "MySQL临时对象",
"options": {
"tooltip": {
"mode": "all",
"sort": "desc"
},
"legend": {
"displayMode": "hidden"
},
"standardOptions": {},
"thresholds": {
"steps": [
{
"color": "#634CD9",
"value": null,
"type": "base"
}
]
}
},
"custom": {
"drawStyle": "lines",
"lineInterpolation": "smooth",
"spanNulls": false,
"lineWidth": 1,
"fillOpacity": 0.64,
"gradientMode": "none",
"stack": "off",
"scaleDistribution": {
"type": "linear"
}
}
},
{
"type": "timeseries",
"id": "f6aa6993-4915-4c3f-944a-604e7eba87b0",
"layout": {
"h": 7,
"w": 12,
"x": 12,
"y": 13,
"i": "f6aa6993-4915-4c3f-944a-604e7eba87b0",
"isResizable": true
},
"version": "2.0.0",
"datasourceCate": "prometheus",
"targets": [
{
"expr": "sum(rate(mysql_global_status_select_full_join{ instance=~\"$instance\"}[5m]))",
"legend": "Select Full Join"
},
{
"expr": "sum(rate(mysql_global_status_select_full_range_join{ instance=~\"$instance\"}[5m]))",
"legend": "Select Full Range Join"
},
{
"expr": "sum(rate(mysql_global_status_select_range{ instance=~\"$instance\"}[5m]))",
"legend": "Select Range"
},
{
"expr": "sum(rate(mysql_global_status_select_range_check{ instance=~\"$instance\"}[5m]))",
"legend": "Select Range Check"
},
{
"expr": "sum(rate(mysql_global_status_select_scan{ instance=~\"$instance\"}[5m]))",
"legend": "Select Scan"
}
],
"name": "MySQL Select 类型",
"description": "**MySQL Select Types**\n\nAs with most relational databases, selecting based on indexes is more efficient than scanning an entire table's data. Here we see the counters for selects not done with indexes.\n\n* ***Select Scan*** is how many queries caused full table scans, in which all the data in the table had to be read and either discarded or returned.\n* ***Select Range*** is how many queries used a range scan, which means MySQL scanned all rows in a given range.\n* ***Select Full Join*** is the number of joins that are not joined on an index, this is usually a huge performance hit.",
"options": {
"tooltip": {
"mode": "all",
"sort": "desc"
},
"legend": {
"displayMode": "hidden"
},
"standardOptions": {},
"thresholds": {
"steps": [
{
"color": "#634CD9",
"value": null,
"type": "base"
}
]
}
},
"custom": {
"drawStyle": "lines",
"lineInterpolation": "smooth",
"spanNulls": false,
"lineWidth": 1,
"fillOpacity": 0.41,
"gradientMode": "none",
"stack": "off",
"scaleDistribution": {
"type": "linear"
}
}
},
{
"type": "timeseries",
"id": "7fe165b8-b8fc-4d32-a2b6-8d70d835b698",
"layout": {
"h": 7,
"w": 12,
"x": 0,
"y": 20,
"i": "7fe165b8-b8fc-4d32-a2b6-8d70d835b698",
"isResizable": true
},
"version": "2.0.0",
"datasourceCate": "prometheus",
"targets": [
{
"expr": "sum(rate(mysql_global_status_sort_rows{instance=~\"$instance\"}[5m]))",
"legend": "Sort Rows"
},
{
"expr": "sum(rate(mysql_global_status_sort_range{instance=~\"$instance\"}[5m]))",
"legend": "Sort Range"
},
{
"expr": "sum(rate(mysql_global_status_sort_merge_passes{instance=~\"$instance\"}[5m]))",
"legend": "Sort Merge Passes"
},
{
"expr": "sum(rate(mysql_global_status_sort_scan{instance=~\"$instance\"}[5m]))",
"legend": "Sort Scan"
}
],
"name": "MySQL 排序操作",
"description": "**MySQL Sorts**\n\nDue to a query's structure, order, or other requirements, MySQL sorts the rows before returning them. For example, if a table is ordered 1 to 10 but you want the results reversed, MySQL then has to sort the rows to return 10 to 1.\n\nThis graph also shows when sorts had to scan a whole table or a given range of a table in order to return the results and which could not have been sorted via an index.\nSort Scan:利用一次全表扫作而完成的排序操作的次数\nSort Merge Passes:查询导致了文件排序的次数.可以优化sql或者适当增加sort_buffer_size变量\nSort Range:利用一个区间进行的排序操作的次数\nSort Rows:对多少行排序",
"options": {
"tooltip": {
"mode": "all",
"sort": "desc"
},
"legend": {
"displayMode": "hidden"
},
"standardOptions": {},
"thresholds": {
"steps": [
{
"color": "#634CD9",
"value": null,
"type": "base"
}
]
}
},
"custom": {
"drawStyle": "lines",
"lineInterpolation": "smooth",
"spanNulls": false,
"lineWidth": 1,
"fillOpacity": 0.5,
"gradientMode": "none",
"stack": "off",
"scaleDistribution": {
"type": "linear"
}
}
},
{
"type": "timeseries",
"id": "f59b7d48-e438-45b8-be8e-4da8b54db616",
"layout": {
"h": 7,
"w": 12,
"x": 12,
"y": 20,
"i": "f59b7d48-e438-45b8-be8e-4da8b54db616",
"isResizable": true
},
"version": "2.0.0",
"datasourceCate": "prometheus",
"targets": [
{
"expr": "sum(rate(mysql_global_status_slow_queries{instance=~\"$instance\"}[5m]))",
"legend": "Slow Queries"
}
],
"name": "慢sql数量[5分钟]",
"description": "**MySQL Slow Queries**\n\nSlow queries are defined as queries being slower than the long_query_time setting. For example, if you have long_query_time set to 3, all queries that take longer than 3 seconds to complete will show on this graph.",
"options": {
"tooltip": {
"mode": "all",
"sort": "none"
},
"legend": {
"displayMode": "hidden"
},
"standardOptions": {},
"thresholds": {
"steps": [
{
"color": "#634CD9",
"value": null,
"type": "base"
}
]
}
},
"custom": {
"drawStyle": "bars",
"spanNulls": false,
"lineWidth": 1,
"fillOpacity": 0.81,
"gradientMode": "none",
"stack": "off",
"scaleDistribution": {
"type": "linear"
}
}
},
{
"id": "92f9be10-0b5c-4212-a1d1-e54c9f37bf6f",
"type": "row",
"name": "网络",
"layout": {
"h": 1,
"w": 24,
"x": 0,
"y": 27,
"i": "92f9be10-0b5c-4212-a1d1-e54c9f37bf6f",
"isResizable": false
},
"collapsed": true
},
{
"type": "timeseries",
"id": "db0898c1-46e3-44b6-af9a-696546934871",
"layout": {
"h": 7,
"w": 24,
"x": 0,
"y": 28,
"i": "db0898c1-46e3-44b6-af9a-696546934871",
"isResizable": true
},
"version": "2.0.0",
"datasourceCate": "prometheus",
"targets": [
{
"expr": "sum(rate(mysql_global_status_bytes_received{instance=~\"$instance\"}[5m]))",
"legend": "Inbound"
},
{
"expr": "sum(rate(mysql_global_status_bytes_sent{instance=~\"$instance\"}[5m]))",
"legend": "Outbound"
}
],
"name": "MySQL 网络流量",
"description": "**MySQL Network Traffic**\n\nHere we can see how much network traffic is generated by MySQL. Outbound is network traffic sent from MySQL and Inbound is network traffic MySQL has received.",
"options": {
"tooltip": {
"mode": "all",
"sort": "desc"
},
"legend": {
"displayMode": "hidden"
},
"standardOptions": {
"util": "bytesSI",
"decimals": 2
},
"thresholds": {
"steps": [
{
"color": "#634CD9",
"value": null,
"type": "base"
}
]
}
},
"custom": {
"drawStyle": "lines",
"lineInterpolation": "smooth",
"spanNulls": false,
"lineWidth": 1,
"fillOpacity": 0.5,
"gradientMode": "none",
"stack": "off",
"scaleDistribution": {
"type": "linear"
}
}
},
{
"id": "027fe17a-b307-4e01-8e2d-5d7372410250",
"type": "row",
"name": "命令,处理程序",
"layout": {
"h": 1,
"w": 24,
"x": 0,
"y": 35,
"i": "027fe17a-b307-4e01-8e2d-5d7372410250",
"isResizable": false
},
"collapsed": true
},
{
"type": "timeseries",
"id": "60e69986-b79f-4d32-969e-dce5cb57e639",
"layout": {
"h": 7,
"w": 24,
"x": 0,
"y": 36,
"i": "60e69986-b79f-4d32-969e-dce5cb57e639",
"isResizable": true
},
"version": "2.0.0",
"datasourceCate": "prometheus",
"targets": [
{
"expr": "topk(10, rate(mysql_global_status_commands_total{instance=~\"$instance\"}[5m])>0)",
"legend": "Com_{{command}}"
}
],
"name": "Top 命令",
"description": "**Top Command Counters**\n\nThe Com_{{xxx}} statement counter variables indicate the number of times each xxx statement has been executed. There is one status variable for each type of statement. For example, Com_delete and Com_update count [``DELETE``](https://dev.mysql.com/doc/refman/5.7/en/delete.html) and [``UPDATE``](https://dev.mysql.com/doc/refman/5.7/en/update.html) statements, respectively. Com_delete_multi and Com_update_multi are similar but apply to [``DELETE``](https://dev.mysql.com/doc/refman/5.7/en/delete.html) and [``UPDATE``](https://dev.mysql.com/doc/refman/5.7/en/update.html) statements that use multiple-table syntax.",
"options": {
"tooltip": {
"mode": "all",
"sort": "desc"
},
"legend": {
"displayMode": "hidden"
},
"standardOptions": {
"decimals": 2
},
"thresholds": {
"steps": [
{
"color": "#634CD9",
"value": null,
"type": "base"
}
]
}
},
"custom": {
"drawStyle": "lines",
"lineInterpolation": "smooth",
"spanNulls": false,
"lineWidth": 1,
"fillOpacity": 0.2,
"gradientMode": "none",
"stack": "off",
"scaleDistribution": {
"type": "linear"
}
}
},
{
"type": "timeseries",
"id": "860dba51-0882-452a-8ea5-a10fd78d8156",
"layout": {
"h": 7,
"w": 12,
"x": 0,
"y": 43,
"i": "860dba51-0882-452a-8ea5-a10fd78d8156",
"isResizable": true
},
"version": "2.0.0",
"datasourceCate": "prometheus",
"targets": [
{
"expr": "rate(mysql_global_status_handlers_total{instance=~\"$instance\", handler!~\"commit|rollback|savepoint.*|prepare\"}[5m])",
"legend": "{{handler}}"
}
],
"name": "MySQL 处理程序",
"description": "**MySQL Handlers**\n\nHandler statistics are internal statistics on how MySQL is selecting, updating, inserting, and modifying rows, tables, and indexes.\n\nThis is in fact the layer between the Storage Engine and MySQL.\n\n* `read_rnd_next` is incremented when the server performs a full table scan and this is a counter you don't really want to see with a high value.\n* `read_key` is incremented when a read is done with an index.\n* `read_next` is incremented when the storage engine is asked to 'read the next index entry'. A high value means a lot of index scans are being done.",
"options": {
"tooltip": {
"mode": "all",
"sort": "desc"
},
"legend": {
"displayMode": "hidden"
},
"standardOptions": {
"decimals": 3
},
"thresholds": {
"steps": [
{
"color": "#634CD9",
"value": null,
"type": "base"
}
]
}
},
"custom": {
"drawStyle": "lines",
"lineInterpolation": "smooth",
"spanNulls": false,
"lineWidth": 1,
"fillOpacity": 0.5,
"gradientMode": "none",
"stack": "off",
"scaleDistribution": {
"type": "linear"
}
}
},
{
"type": "timeseries",
"id": "d957b465-1d26-4dc6-bd8b-8f04e8b4c243",
"layout": {
"h": 7,
"w": 12,
"x": 12,
"y": 43,
"i": "d957b465-1d26-4dc6-bd8b-8f04e8b4c243",
"isResizable": true
},
"version": "2.0.0",
"datasourceCate": "prometheus",
"targets": [
{
"expr": "rate(mysql_global_status_handlers_total{instance=~\"$instance\", handler=~\"commit|rollback|savepoint.*|prepare\"}[5m])",
"legend": "{{handler}}"
}
],
"name": "MySQL 事务处理程序",
"options": {
"tooltip": {
"mode": "all",
"sort": "desc"
},
"legend": {
"displayMode": "hidden"
},
"standardOptions": {},
"thresholds": {
"steps": [
{
"color": "#634CD9",
"value": null,
"type": "base"
}
]
}
},
"custom": {
"drawStyle": "lines",
"lineInterpolation": "smooth",
"spanNulls": false,
"lineWidth": 1,
"fillOpacity": 0.5,
"gradientMode": "none",
"stack": "off",
"scaleDistribution": {
"type": "linear"
}
}
},
{
"id": "a55b7af1-c345-4126-aabf-f916a055e23c",
"type": "row",
"name": "Open Files",
"layout": {
"h": 1,
"w": 24,
"x": 0,
"y": 50,
"i": "a55b7af1-c345-4126-aabf-f916a055e23c",
"isResizable": false
},
"collapsed": true
},
{
"type": "timeseries",
"id": "c9d14c70-0796-42d0-b994-76f31c2da832",
"layout": {
"h": 7,
"w": 24,
"x": 0,
"y": 51,
"i": "c9d14c70-0796-42d0-b994-76f31c2da832",
"isResizable": true
},
"version": "2.0.0",
"datasourceCate": "prometheus",
"targets": [
{
"expr": "mysql_global_variables_open_files_limit{instance=~\"$instance\"}",
"legend": "Open Files Limit"
},
{
"expr": "mysql_global_status_open_files{instance=~\"$instance\"}",
"legend": "Open Files"
}
],
"name": "MySQL Open Files",
"description": "**MySQL Open Files**\n\nOpen Files 打开的文件数\n\nOpen Files Limits 文件的上限",
"options": {
"tooltip": {
"mode": "all",
"sort": "desc"
},
"legend": {
"displayMode": "hidden"
},
"standardOptions": {},
"thresholds": {
"steps": [
{
"color": "#634CD9",
"value": null,
"type": "base"
}
]
}
},
"custom": {
"drawStyle": "lines",
"lineInterpolation": "smooth",
"spanNulls": false,
"lineWidth": 1,
"fillOpacity": 0.5,
"gradientMode": "none",
"stack": "off",
"scaleDistribution": {
"type": "linear"
}
}
},
{
"id": "ffa52002-11e7-44da-afd4-a5e8c9cb9a4e",
"type": "row",
"name": "Table Openings",
"layout": {
"h": 1,
"w": 24,
"x": 0,
"y": 58,
"i": "ffa52002-11e7-44da-afd4-a5e8c9cb9a4e",
"isResizable": false
},
"collapsed": true
},
{
"type": "timeseries",
"id": "31ab05be-0a0a-4df5-a3d1-0a04c135877b",
"layout": {
"h": 7,
"w": 12,
"x": 0,
"y": 59,
"i": "31ab05be-0a0a-4df5-a3d1-0a04c135877b",
"isResizable": true
},
"version": "2.0.0",
"datasourceCate": "prometheus",
"targets": [
{
"expr": "rate(mysql_global_status_table_open_cache_hits{instance=~\"$instance\"}[5m])\n/\n(\nrate(mysql_global_status_table_open_cache_hits{instance=~\"$instance\"}[5m])\n+\nrate(mysql_global_status_table_open_cache_misses{instance=~\"$instance\"}[5m])\n)",
"legend": "Table Open Cache Hit Ratio"
}
],
"name": "Table Open Cache Hit Ratio",
"description": "**MySQL Table Open Cache Status 表打开缓存状态**\n\nThe recommendation is to set the `table_open_cache_instances` to a loose correlation to virtual CPUs, keeping in mind that more instances means the cache is split more times. If you have a cache set to 500 but it has 10 instances, each cache will only have 50 cached.\n\nThe `table_definition_cache` and `table_open_cache` can be left as default as they are auto-sized MySQL 5.6 and above (ie: do not set them to any value).",
"options": {
"tooltip": {
"mode": "all",
"sort": "none"
},
"legend": {
"displayMode": "hidden"
},
"standardOptions": {
"util": "percentUnit"
},
"thresholds": {
"steps": [
{
"color": "#634CD9",
"value": null,
"type": "base"
}
]
}
},
"custom": {
"drawStyle": "lines",
"lineInterpolation": "smooth",
"spanNulls": false,
"lineWidth": 1,
"fillOpacity": 0.5,
"gradientMode": "none",
"stack": "off",
"scaleDistribution": {
"type": "linear"
}
}
},
{
"type": "timeseries",
"id": "39ba4015-8ac2-4101-83af-7aa4dd8c19b4",
"layout": {
"h": 7,
"w": 12,
"x": 12,
"y": 59,
"i": "39ba4015-8ac2-4101-83af-7aa4dd8c19b4",
"isResizable": true
},
"version": "2.0.0",
"datasourceCate": "prometheus",
"targets": [
{
"expr": "mysql_global_status_open_tables{instance=~\"$instance\"}",
"legend": "Open Tables"
},
{
"expr": "mysql_global_variables_table_open_cache{instance=~\"$instance\"}",
"legend": "Table Open Cache"
}
],
"name": "MySQL Open Tables",
"description": "**MySQL Open Tables **\n\n>Open Tables:数据表缓存\n\n>Open Tables :当前处于打开状态的数据表的个数.不包括TEMPORARY\n\n\nThe recommendation is to set the `table_open_cache_instances` to a loose correlation to virtual CPUs, keeping in mind that more instances means the cache is split more times. If you have a cache set to 500 but it has 10 instances, each cache will only have 50 cached.\n\nThe `table_definition_cache` and `table_open_cache` can be left as default as they are auto-sized MySQL 5.6 and above (ie: do not set them to any value).",
"options": {
"tooltip": {
"mode": "all",
"sort": "desc"
},
"legend": {
"displayMode": "hidden"
},
"standardOptions": {},
"thresholds": {
"steps": [
{
"color": "#634CD9",
"value": null,
"type": "base"
}
]
}
},
"custom": {
"drawStyle": "lines",
"lineInterpolation": "smooth",
"spanNulls": false,
"lineWidth": 1,
"fillOpacity": 0.5,
"gradientMode": "none",
"stack": "off",
"scaleDistribution": {
"type": "linear"
}
}
},
{
"type": "row",
"id": "837de9f1-6a7a-4d59-9e50-464a3b2a1ad6",
"name": "主从状态",
"collapsed": true,
"layout": {
"h": 1,
"w": 24,
"x": 0,
"y": 66,
"i": "837de9f1-6a7a-4d59-9e50-464a3b2a1ad6",
"isResizable": false
},
"panels": []
},
{
"type": "timeseries",
"id": "14a9e867-9ba7-4143-a078-f55a59c18af1",
"layout": {
"h": 5,
"w": 24,
"x": 0,
"y": 67,
"i": "14a9e867-9ba7-4143-a078-f55a59c18af1",
"isResizable": true
},
"version": "2.0.0",
"datasourceCate": "prometheus",
"targets": [
{
"refId": "A",
"expr": "mysql_slave_status_slave_io_running{instance=~\"$instance\"}",
"legend": "slave_io_running"
},
{
"expr": "mysql_slave_status_slave_sql_running{instance=~\"$instance\"}",
"refId": "B",
"legend": "slave_sql_running"
}
],
"name": "主从状态",
"description": "**mysql slave status**\n\n从库显示该图表\n\nslave_io_running=1且slave_sql_running=1 表示同步正常,其余值均为异常",
"options": {
"tooltip": {
"mode": "all",
"sort": "none"
},
"legend": {
"displayMode": "hidden"
},
"standardOptions": {
"min": 0,
"max": 1
},
"thresholds": {
"steps": [
{
"color": "#ce4f52",
"value": 0,
"type": ""
},
{
"color": "#634CD9",
"value": null,
"type": "base"
}
]
}
},
"custom": {
"drawStyle": "lines",
"lineInterpolation": "smooth",
"spanNulls": true,
"lineWidth": 1,
"fillOpacity": 0.5,
"gradientMode": "opacity",
"stack": "off",
"scaleDistribution": {
"type": "linear"
}
}
}
],
"datasourceValue": "ZW-HLW"
}
}
linux监控大盘
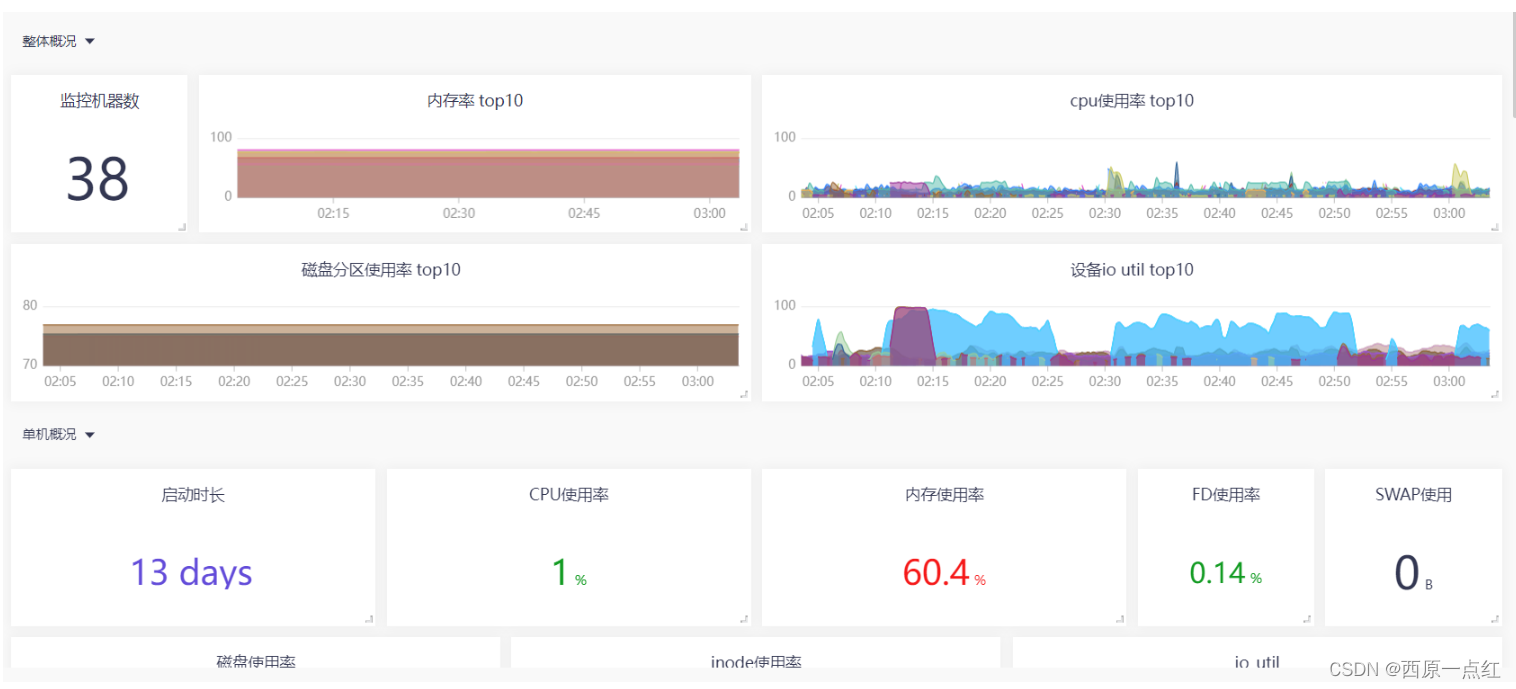
大盘json:
{
"name": "Linux Host",
"tags": "",
"ident": "",
"configs": {
"var": [
{
"name": "ident",
"definition": "label_values(system_load1,ident)",
"type": "query"
}
],
"links": [
{
"title": "n9e",
"url": "https://n9e.github.io/",
"targetBlank": true
},
{
"title": "author",
"url": "http://flashcat.cloud/",
"targetBlank": true
}
],
"version": "2.0.0",
"panels": [
{
"id": "e5d14dd7-4417-42bd-b7ba-560f34d299a2",
"type": "row",
"name": "整体概况",
"layout": {
"h": 1,
"w": 24,
"x": 0,
"y": 0,
"i": "e5d14dd7-4417-42bd-b7ba-560f34d299a2",
"isResizable": false
},
"collapsed": true,
"panels": []
},
{
"targets": [
{
"refId": "A",
"expr": "count(system_load1)"
}
],
"name": "监控机器数",
"custom": {
"textMode": "value",
"colorMode": "value",
"calc": "lastNotNull",
"colSpan": 1,
"textSize": {
"value": 50
}
},
"options": {
"standardOptions": {}
},
"version": "2.0.0",
"type": "stat",
"layout": {
"h": 3,
"w": 3,
"x": 0,
"y": 1,
"i": "41f37540-e695-492a-9d2f-24bfd2d36805",
"isResizable": true
},
"id": "41f37540-e695-492a-9d2f-24bfd2d36805"
},
{
"type": "timeseries",
"id": "585bfc50-7c92-42b1-88ee-5b725b640418",
"layout": {
"h": 3,
"w": 9,
"x": 3,
"y": 1,
"i": "585bfc50-7c92-42b1-88ee-5b725b640418",
"isResizable": true
},
"version": "2.0.0",
"datasourceCate": "prometheus",
"targets": [
{
"refId": "A",
"expr": "topk(10, (mem_used_percent))"
}
],
"name": "内存率 top10",
"options": {
"tooltip": {
"mode": "all",
"sort": "desc"
},
"legend": {
"displayMode": "hidden"
},
"standardOptions": {},
"thresholds": {
"steps": [
{
"color": "#634CD9",
"value": null,
"type": "base"
}
]
}
},
"custom": {
"drawStyle": "lines",
"lineInterpolation": "smooth",
"spanNulls": false,
"lineWidth": 1,
"fillOpacity": 0.5,
"gradientMode": "none",
"stack": "off",
"scaleDistribution": {
"type": "linear"
}
}
},
{
"targets": [
{
"refId": "A",
"expr": "topk(10, (100-cpu_usage_idle{cpu=\"cpu-total\"}))"
}
],
"name": "cpu使用率 top10",
"options": {
"tooltip": {
"mode": "all",
"sort": "none"
},
"legend": {
"displayMode": "hidden"
},
"standardOptions": {},
"thresholds": {}
},
"custom": {
"drawStyle": "lines",
"lineInterpolation": "smooth",
"fillOpacity": 0.5,
"stack": "off"
},
"version": "2.0.0",
"type": "timeseries",
"layout": {
"h": 3,
"w": 12,
"x": 12,
"y": 1,
"i": "60b1e833-3f03-45bb-9385-a3825904a0ac",
"isResizable": true
},
"id": "60b1e833-3f03-45bb-9385-a3825904a0ac"
},
{
"targets": [
{
"refId": "A",
"expr": "topk(10, (disk_used_percent{path!~\"/var.*\"}))",
"legend": "{{ident}}-{{path}}"
}
],
"name": "磁盘分区使用率 top10",
"options": {
"tooltip": {
"mode": "all",
"sort": "none"
},
"legend": {
"displayMode": "hidden"
},
"standardOptions": {},
"thresholds": {}
},
"custom": {
"drawStyle": "lines",
"lineInterpolation": "smooth",
"fillOpacity": 0.5,
"stack": "off"
},
"version": "2.0.0",
"type": "timeseries",
"layout": {
"h": 3,
"w": 12,
"x": 0,
"y": 4,
"i": "69351db9-e646-4e5d-925a-cba29823b00d",
"isResizable": true
},
"id": "69351db9-e646-4e5d-925a-cba29823b00d"
},
{
"targets": [
{
"refId": "A",
"expr": "topk(10, (rate(diskio_io_time[1m])/10))",
"legend": ""
}
],
"name": "设备io util top10",
"options": {
"tooltip": {
"mode": "all",
"sort": "desc"
},
"legend": {
"displayMode": "hidden"
},
"standardOptions": {},
"thresholds": {}
},
"custom": {
"drawStyle": "lines",
"lineInterpolation": "smooth",
"fillOpacity": 0.5,
"stack": "off"
},
"version": "2.0.0",
"type": "timeseries",
"layout": {
"h": 3,
"w": 12,
"x": 12,
"y": 4,
"i": "e3675ed9-6d3b-4a41-8d16-d6e82037dce3",
"isResizable": true
},
"id": "e3675ed9-6d3b-4a41-8d16-d6e82037dce3"
},
{
"id": "2b2de3d1-65c8-4c39-9bea-02b754e0d751",
"type": "row",
"name": "单机概况",
"layout": {
"h": 1,
"w": 24,
"x": 0,
"y": 7,
"i": "2b2de3d1-65c8-4c39-9bea-02b754e0d751",
"isResizable": false
},
"collapsed": true,
"panels": []
},
{
"type": "stat",
"id": "deec579b-3090-4344-a9a6-c1455c4a8e50",
"layout": {
"h": 3,
"w": 6,
"x": 0,
"y": 8,
"i": "deec579b-3090-4344-a9a6-c1455c4a8e50",
"isResizable": true
},
"version": "2.0.0",
"datasourceCate": "prometheus",
"targets": [
{
"refId": "A",
"expr": "system_uptime{ident=\"$ident\"}"
}
],
"name": "启动时长",
"custom": {
"textMode": "value",
"colorMode": "value",
"calc": "lastNotNull",
"valueField": "Value",
"colSpan": 1,
"textSize": {
"value": 30
}
},
"options": {
"valueMappings": [],
"standardOptions": {
"util": "humantimeSeconds",
"decimals": 1
},
"thresholds": {
"steps": [
{
"color": "#634CD9",
"value": null,
"type": "base"
}
]
}
}
},
{
"targets": [
{
"refId": "A",
"expr": "100-cpu_usage_idle{ident=\"$ident\",cpu=\"cpu-total\"}"
}
],
"name": "CPU使用率",
"custom": {
"textMode": "value",
"colorMode": "value",
"calc": "lastNotNull",
"colSpan": 1,
"textSize": {
"value": 30
}
},
"options": {
"valueMappings": [
{
"type": "range",
"match": {
"from": 0,
"to": 50
},
"result": {
"color": "#129b22"
}
},
{
"type": "range",
"match": {
"from": 50,
"to": 100
},
"result": {
"color": "#f51919"
}
}
],
"standardOptions": {
"util": "percent",
"decimals": 1
}
},
"version": "2.0.0",
"type": "stat",
"layout": {
"h": 3,
"w": 6,
"x": 6,
"y": 8,
"i": "7a7bd5db-d12e-49f0-92a8-15958e99ee54",
"isResizable": true
},
"id": "7a7bd5db-d12e-49f0-92a8-15958e99ee54"
},
{
"targets": [
{
"refId": "A",
"expr": "mem_used_percent{ident=\"$ident\"}"
}
],
"name": "内存使用率",
"custom": {
"textMode": "value",
"colorMode": "value",
"calc": "lastNotNull",
"colSpan": 1,
"textSize": {
"value": 30
}
},
"options": {
"valueMappings": [
{
"type": "range",
"match": {
"from": 0,
"to": 50
},
"result": {
"color": "#129b22"
}
},
{
"type": "range",
"match": {
"from": 50,
"to": 100
},
"result": {
"color": "#f51919"
}
}
],
"standardOptions": {
"util": "percent",
"decimals": 1
}
},
"version": "2.0.0",
"type": "stat",
"layout": {
"h": 3,
"w": 6,
"x": 12,
"y": 8,
"i": "8a814265-54ad-419c-8cb7-e1f84a242de0",
"isResizable": true
},
"id": "8a814265-54ad-419c-8cb7-e1f84a242de0"
},
{
"targets": [
{
"refId": "A",
"expr": "linux_sysctl_fs_file_nr{ident=\"$ident\"}/linux_sysctl_fs_file_max{ident=\"$ident\"}*100"
}
],
"name": "FD使用率",
"custom": {
"textMode": "value",
"colorMode": "value",
"calc": "lastNotNull",
"colSpan": 1,
"textSize": {
"value": 25
}
},
"options": {
"valueMappings": [
{
"type": "range",
"match": {
"from": 0,
"to": 50
},
"result": {
"color": "#129b22"
}
},
{
"type": "range",
"match": {
"from": 50,
"to": 100
},
"result": {
"color": "#f51919"
}
}
],
"standardOptions": {
"util": "percent",
"decimals": 2
}
},
"version": "2.0.0",
"type": "stat",
"layout": {
"h": 3,
"w": 3,
"x": 18,
"y": 8,
"i": "d7d11972-5c5b-4bc6-98f8-bbbe9f018896",
"isResizable": true
},
"id": "d7d11972-5c5b-4bc6-98f8-bbbe9f018896"
},
{
"targets": [
{
"refId": "A",
"expr": "mem_swap_total{ident=\"$ident\"}-mem_swap_free{ident=\"$ident\"}"
}
],
"name": "SWAP使用",
"custom": {
"textMode": "value",
"colorMode": "value",
"calc": "lastNotNull",
"colSpan": 1,
"textSize": {
"value": 40
}
},
"options": {
"valueMappings": [],
"standardOptions": {
"util": "bytesIEC",
"decimals": 1
}
},
"version": "2.0.0",
"type": "stat",
"layout": {
"h": 3,
"w": 3,
"x": 21,
"y": 8,
"i": "209d3aba-5e02-4b8f-a364-65f20ba92a2c",
"isResizable": true
},
"id": "209d3aba-5e02-4b8f-a364-65f20ba92a2c"
},
{
"targets": [
{
"refId": "A",
"expr": "disk_used_percent{ident=\"$ident\"}",
"legend": "{{path}}"
}
],
"name": "磁盘使用率",
"options": {
"tooltip": {
"mode": "all",
"sort": "none"
},
"legend": {
"displayMode": "hidden"
},
"standardOptions": {
"util": "percent",
"decimals": 1
},
"thresholds": {}
},
"custom": {
"drawStyle": "lines",
"lineInterpolation": "smooth",
"fillOpacity": 0.5,
"stack": "off"
},
"version": "2.0.0",
"type": "timeseries",
"layout": {
"h": 3,
"w": 8,
"x": 0,
"y": 11,
"i": "b3c5dd9d-e82a-4b15-8b23-c510e2bee152",
"isResizable": true
},
"id": "b3c5dd9d-e82a-4b15-8b23-c510e2bee152"
},
{
"targets": [
{
"refId": "A",
"expr": "disk_inodes_used{ident=\"$ident\"}/disk_inodes_total{ident=\"$ident\"}",
"legend": "{{path}}"
}
],
"name": "inode使用率",
"options": {
"tooltip": {
"mode": "all",
"sort": "desc"
},
"legend": {
"displayMode": "hidden"
},
"standardOptions": {
"util": "percent",
"decimals": 1
},
"thresholds": {}
},
"custom": {
"drawStyle": "lines",
"lineInterpolation": "smooth",
"fillOpacity": 0.5,
"stack": "off"
},
"version": "2.0.0",
"type": "timeseries",
"layout": {
"h": 3,
"w": 8,
"x": 8,
"y": 11,
"i": "0de74cd9-cc74-4a96-bcb2-05d3a8bde2ea",
"isResizable": true
},
"id": "0de74cd9-cc74-4a96-bcb2-05d3a8bde2ea"
},
{
"targets": [
{
"refId": "A",
"expr": "rate(diskio_io_time{ident=\"$ident\"}[1m])/10",
"legend": "{{name}}"
}
],
"name": "io_util",
"options": {
"tooltip": {
"mode": "all",
"sort": "desc"
},
"legend": {
"displayMode": "hidden"
},
"standardOptions": {
"util": "percent",
"decimals": 1
},
"thresholds": {}
},
"custom": {
"drawStyle": "lines",
"lineInterpolation": "smooth",
"fillOpacity": 0.5,
"stack": "off"
},
"version": "2.0.0",
"type": "timeseries",
"layout": {
"h": 3,
"w": 8,
"x": 16,
"y": 11,
"i": "59afa167-434d-496c-a3ef-ceff6db7c1f6",
"isResizable": true
},
"id": "59afa167-434d-496c-a3ef-ceff6db7c1f6"
},
{
"id": "aabb8263-1a9b-43fb-bee1-6c532f5012a3",
"type": "row",
"name": "系统指标",
"layout": {
"h": 1,
"w": 24,
"x": 0,
"y": 20,
"i": "aabb8263-1a9b-43fb-bee1-6c532f5012a3",
"isResizable": false
},
"collapsed": true
},
{
"targets": [
{
"refId": "A",
"expr": "processes_total{ident=\"$ident\"}"
}
],
"name": "进程总数",
"options": {
"tooltip": {
"mode": "all",
"sort": "none"
},
"legend": {
"displayMode": "hidden"
},
"standardOptions": {},
"thresholds": {
"steps": [
{
"value": 2000,
"color": "#fa2a05"
}
]
}
},
"custom": {
"drawStyle": "lines",
"lineInterpolation": "smooth",
"fillOpacity": 0.5,
"stack": "off"
},
"version": "2.0.0",
"type": "timeseries",
"layout": {
"h": 7,
"w": 8,
"x": 0,
"y": 21,
"i": "1b4da538-29d4-4c58-b3f4-773fabb8616c",
"isResizable": true
},
"id": "1b4da538-29d4-4c58-b3f4-773fabb8616c"
},
{
"targets": [
{
"refId": "A",
"expr": "rate(kernel_context_switches{ident=\"$ident\"}[1m])",
"legend": "context_switches"
},
{
"expr": "rate(kernel_interrupts{ident=\"$ident\"}[1m])",
"refId": "B",
"legend": "kernel_interrupts"
}
],
"name": "上下文切换/中断",
"options": {
"tooltip": {
"mode": "all",
"sort": "none"
},
"legend": {
"displayMode": "hidden"
},
"standardOptions": {},
"thresholds": {}
},
"custom": {
"drawStyle": "lines",
"lineInterpolation": "smooth",
"fillOpacity": 0.5,
"stack": "off"
},
"version": "2.0.0",
"type": "timeseries",
"layout": {
"h": 7,
"w": 8,
"x": 8,
"y": 21,
"i": "aa7adae0-ae3b-4e28-a8ce-801c65961552",
"isResizable": true
},
"id": "aa7adae0-ae3b-4e28-a8ce-801c65961552"
},
{
"targets": [
{
"refId": "A",
"expr": "kernel_entropy_avail{ident=\"$ident\"}",
"legend": "entropy_avail"
}
],
"name": "熵池大小",
"options": {
"tooltip": {
"mode": "all",
"sort": "none"
},
"legend": {
"displayMode": "hidden"
},
"standardOptions": {},
"thresholds": {
"steps": [
{
"value": 100,
"color": "#f50505"
}
]
}
},
"custom": {
"drawStyle": "lines",
"lineInterpolation": "smooth",
"fillOpacity": 0.5,
"stack": "off"
},
"version": "2.0.0",
"type": "timeseries",
"layout": {
"h": 7,
"w": 8,
"x": 16,
"y": 21,
"i": "71e22f58-5b9a-4604-bca8-55bcef59b5fe",
"isResizable": true
},
"id": "71e22f58-5b9a-4604-bca8-55bcef59b5fe"
},
{
"id": "10f34f8f-f94d-4a28-9551-16e6667e3833",
"type": "row",
"name": "CPU",
"layout": {
"h": 1,
"w": 24,
"x": 0,
"y": 28,
"i": "10f34f8f-f94d-4a28-9551-16e6667e3833",
"isResizable": false
},
"collapsed": true,
"panels": []
},
{
"targets": [
{
"refId": "A",
"expr": "cpu_usage_idle{ident=\"$ident\",cpu=\"cpu-total\"}",
"legend": "cpu_usage_idle"
}
],
"name": "CPU空闲率",
"options": {
"tooltip": {
"mode": "all",
"sort": "none"
},
"legend": {
"displayMode": "hidden"
},
"standardOptions": {},
"thresholds": {
"steps": [
{
"value": 10,
"color": "#f20202"
}
]
}
},
"custom": {
"drawStyle": "lines",
"lineInterpolation": "smooth",
"fillOpacity": 0.5,
"stack": "off"
},
"version": "2.0.0",
"type": "timeseries",
"layout": {
"h": 7,
"w": 8,
"x": 0,
"y": 29,
"i": "1559d880-7e26-4e42-9427-4e55fb6f67be",
"isResizable": true
},
"id": "1559d880-7e26-4e42-9427-4e55fb6f67be"
},
{
"targets": [
{
"refId": "A",
"expr": "cpu_usage_guest{ident=\"$ident\",cpu=\"cpu-total\"}",
"legend": ""
},
{
"expr": "cpu_usage_iowait{ident=\"$ident\",cpu=\"cpu-total\"}",
"refId": "B",
"legend": ""
},
{
"expr": "cpu_usage_user{ident=\"$ident\",cpu=\"cpu-total\"}",
"refId": "C"
},
{
"expr": "cpu_usage_system{ident=\"$ident\",cpu=\"cpu-total\"}",
"refId": "D"
},
{
"expr": "cpu_usage_irq{ident=\"$ident\",cpu=\"cpu-total\"}",
"refId": "E"
},
{
"expr": "cpu_usage_softirq{ident=\"$ident\",cpu=\"cpu-total\"}",
"refId": "F"
},
{
"expr": "cpu_usage_nice{ident=\"$ident\",cpu=\"cpu-total\"}",
"refId": "G"
},
{
"expr": "cpu_usage_steal{ident=\"$ident\",cpu=\"cpu-total\"}",
"refId": "H"
}
],
"name": "CPU使用率详情",
"options": {
"tooltip": {
"mode": "all",
"sort": "desc"
},
"legend": {
"displayMode": "hidden"
},
"standardOptions": {},
"thresholds": {}
},
"custom": {
"drawStyle": "lines",
"lineInterpolation": "smooth",
"fillOpacity": 0.5,
"stack": "off"
},
"version": "2.0.0",
"type": "timeseries",
"layout": {
"h": 7,
"w": 8,
"x": 8,
"y": 29,
"i": "043c26de-d19f-4fe8-a615-2b7c10ceb828",
"isResizable": true
},
"id": "043c26de-d19f-4fe8-a615-2b7c10ceb828"
},
{
"targets": [
{
"refId": "A",
"expr": "system_load15{ident=\"$ident\"}"
},
{
"expr": "system_load1{ident=\"$ident\"}",
"refId": "B"
},
{
"expr": "system_load5{ident=\"$ident\"}",
"refId": "C"
}
],
"name": "CPU负载",
"options": {
"tooltip": {
"mode": "all",
"sort": "none"
},
"legend": {
"displayMode": "hidden"
},
"standardOptions": {},
"thresholds": {}
},
"custom": {
"drawStyle": "lines",
"lineInterpolation": "smooth",
"fillOpacity": 0.5,
"stack": "off"
},
"version": "2.0.0",
"type": "timeseries",
"layout": {
"h": 7,
"w": 8,
"x": 16,
"y": 29,
"i": "a420ce25-6968-47f8-8335-60cde70fd062",
"isResizable": true
},
"id": "a420ce25-6968-47f8-8335-60cde70fd062"
},
{
"id": "b7a3c99f-a796-4b76-89b5-cbddd566f91c",
"type": "row",
"name": "内存详情",
"layout": {
"h": 1,
"w": 24,
"x": 0,
"y": 36,
"i": "b7a3c99f-a796-4b76-89b5-cbddd566f91c",
"isResizable": false
},
"collapsed": true
},
{
"targets": [
{
"refId": "A",
"expr": "mem_active{ident=\"$ident\"}"
},
{
"expr": "mem_cached{ident=\"$ident\"}",
"refId": "B"
},
{
"expr": "mem_buffered{ident=\"$ident\"}",
"refId": "C"
},
{
"expr": "mem_inactive{ident=\"$ident\"}",
"refId": "D"
},
{
"expr": "mem_mapped{ident=\"$ident\"}",
"refId": "E"
},
{
"expr": "mem_shared{ident=\"$ident\"}",
"refId": "F"
},
{
"expr": "mem_swap_cached{ident=\"$ident\"}",
"refId": "G"
}
],
"name": "用户态内存使用",
"description": "内存指标可参考链接 [/PROC/MEMINFO之谜](http://linuxperf.com/?p=142) ",
"options": {
"tooltip": {
"mode": "all",
"sort": "none"
},
"legend": {
"displayMode": "hidden"
},
"standardOptions": {},
"thresholds": {}
},
"custom": {
"drawStyle": "lines",
"lineInterpolation": "smooth",
"fillOpacity": 0.5,
"stack": "off"
},
"version": "2.0.0",
"type": "timeseries",
"layout": {
"h": 7,
"w": 12,
"x": 0,
"y": 37,
"i": "239aacdf-1982-428b-b240-57f4ce7f946d",
"isResizable": true
},
"id": "239aacdf-1982-428b-b240-57f4ce7f946d"
},
{
"targets": [
{
"refId": "A",
"expr": "mem_slab{ident=\"$ident\"}"
},
{
"expr": "mem_sreclaimable{ident=\"$ident\"}",
"refId": "B"
},
{
"expr": "mem_sunreclaim{ident=\"$ident\"}",
"refId": "C"
},
{
"expr": "mem_vmalloc_used{ident=\"$ident\"}",
"refId": "D"
},
{
"expr": "mem_vmalloc_chunk{ident=\"$ident\"}",
"refId": "E"
}
],
"name": "内核态内存使用",
"options": {
"tooltip": {
"mode": "all",
"sort": "none"
},
"legend": {
"displayMode": "hidden"
},
"standardOptions": {},
"thresholds": {}
},
"custom": {
"drawStyle": "lines",
"lineInterpolation": "smooth",
"fillOpacity": 0.5,
"stack": "off"
},
"version": "2.0.0",
"type": "timeseries",
"layout": {
"h": 7,
"w": 12,
"x": 12,
"y": 37,
"i": "00ed6e4d-c979-4938-a20e-56d42ca452cf",
"isResizable": true
},
"id": "00ed6e4d-c979-4938-a20e-56d42ca452cf"
},
{
"id": "842a8c48-0e93-40bf-8f28-1b2f837e5c19",
"type": "row",
"name": "磁盘详情",
"layout": {
"h": 1,
"w": 24,
"x": 0,
"y": 44,
"i": "842a8c48-0e93-40bf-8f28-1b2f837e5c19",
"isResizable": false
},
"collapsed": true
},
{
"targets": [
{
"refId": "A",
"expr": "disk_free{ident=\"$ident\"}"
},
{
"expr": "disk_total{ident=\"$ident\"}",
"refId": "B"
},
{
"expr": "disk_used{ident=\"$ident\"}",
"refId": "C"
}
],
"name": "磁盘空间",
"options": {
"tooltip": {
"mode": "all",
"sort": "desc"
},
"legend": {
"displayMode": "hidden"
},
"standardOptions": {
"util": "bytesIEC",
"decimals": null
},
"thresholds": {}
},
"custom": {
"drawStyle": "lines",
"lineInterpolation": "smooth",
"fillOpacity": 0.5,
"stack": "off"
},
"version": "2.0.0",
"type": "timeseries",
"layout": {
"h": 7,
"w": 8,
"x": 0,
"y": 45,
"i": "bc894871-1c03-4d12-91be-6867f394a8a6",
"isResizable": true
},
"id": "bc894871-1c03-4d12-91be-6867f394a8a6"
},
{
"targets": [
{
"refId": "A",
"expr": "linux_sysctl_fs_file_max{ident=\"$ident\"}"
},
{
"expr": "linux_sysctl_fs_file_nr{ident=\"$ident\"}",
"refId": "B"
}
],
"name": "fd使用",
"options": {
"tooltip": {
"mode": "all",
"sort": "desc"
},
"legend": {
"displayMode": "hidden"
},
"standardOptions": {},
"thresholds": {}
},
"custom": {
"drawStyle": "lines",
"lineInterpolation": "smooth",
"fillOpacity": 0.5,
"stack": "off"
},
"version": "2.0.0",
"type": "timeseries",
"layout": {
"h": 7,
"w": 8,
"x": 8,
"y": 45,
"i": "d825671f-7dc5-46a2-89dc-4fff084a3ae0",
"isResizable": true
},
"id": "d825671f-7dc5-46a2-89dc-4fff084a3ae0"
},
{
"targets": [
{
"refId": "A",
"expr": "disk_inodes_total{ident=\"$ident\",path!~\"/var.*\"}",
"legend": "{{path}}-total"
},
{
"expr": "disk_inodes_used{ident=\"$ident\",path!~\"/var.*\"}",
"refId": "B",
"legend": "{{path}}-used"
}
],
"name": "inode",
"options": {
"tooltip": {
"mode": "all",
"sort": "desc"
},
"legend": {
"displayMode": "hidden"
},
"standardOptions": {},
"thresholds": {}
},
"custom": {
"drawStyle": "lines",
"lineInterpolation": "smooth",
"fillOpacity": 0.5,
"stack": "off"
},
"version": "2.0.0",
"type": "timeseries",
"layout": {
"h": 7,
"w": 8,
"x": 16,
"y": 45,
"i": "d27b522f-9c70-42f2-9e31-fed3816fd675",
"isResizable": true
},
"id": "d27b522f-9c70-42f2-9e31-fed3816fd675"
},
{
"targets": [
{
"refId": "A",
"expr": "rate(diskio_reads{ident=\"$ident\"}[1m])",
"legend": "{{name}}-read"
},
{
"expr": "rate(diskio_writes{ident=\"$ident\"}[1m])",
"refId": "B",
"legend": "{{name}}-writes"
}
],
"name": "IOPS",
"options": {
"tooltip": {
"mode": "all",
"sort": "none"
},
"legend": {
"displayMode": "hidden"
},
"standardOptions": {},
"thresholds": {}
},
"custom": {
"drawStyle": "lines",
"lineInterpolation": "smooth",
"fillOpacity": 0.5,
"stack": "off"
},
"version": "2.0.0",
"type": "timeseries",
"layout": {
"h": 7,
"w": 8,
"x": 0,
"y": 52,
"i": "f645741e-c632-4685-b267-c7ad26b5c10e",
"isResizable": true
},
"id": "f645741e-c632-4685-b267-c7ad26b5c10e"
},
{
"targets": [
{
"refId": "A",
"expr": "rate(diskio_read_bytes{ident=\"$ident\"}[1m])",
"legend": "{{name}}-read"
},
{
"expr": "rate(diskio_write_bytes{ident=\"$ident\"}[1m])",
"refId": "B",
"legend": "{{name}}-writes"
}
],
"name": "IO吞吐量",
"options": {
"tooltip": {
"mode": "all",
"sort": "desc"
},
"legend": {
"displayMode": "hidden"
},
"standardOptions": {
"util": "bytesIEC",
"decimals": 0
},
"thresholds": {}
},
"custom": {
"drawStyle": "lines",
"lineInterpolation": "smooth",
"fillOpacity": 0.5,
"stack": "off"
},
"version": "2.0.0",
"type": "timeseries",
"layout": {
"h": 7,
"w": 8,
"x": 8,
"y": 52,
"i": "bbd1ebda-99f6-419c-90a5-5f84973976dd",
"isResizable": true
},
"id": "bbd1ebda-99f6-419c-90a5-5f84973976dd"
},
{
"type": "timeseries",
"id": "d6b45598-54c6-4b36-a896-0a7529ac21f8",
"layout": {
"h": 7,
"w": 8,
"x": 16,
"y": 52,
"i": "d6b45598-54c6-4b36-a896-0a7529ac21f8",
"isResizable": true
},
"version": "2.0.0",
"datasourceCate": "prometheus",
"targets": [
{
"refId": "A",
"expr": "rate(diskio_write_time{ident=\"$ident\"}[1m])/rate(diskio_writes{ident=\"$ident\"}[1m])",
"legend": "{{ident}}"
}
],
"name": "iowait",
"options": {
"tooltip": {
"mode": "all",
"sort": "none"
},
"legend": {
"displayMode": "table"
},
"standardOptions": {},
"thresholds": {
"steps": [
{
"color": "#634CD9",
"value": null,
"type": "base"
}
]
}
},
"custom": {
"drawStyle": "lines",
"lineInterpolation": "smooth",
"spanNulls": false,
"lineWidth": 1,
"fillOpacity": 0.5,
"gradientMode": "opacity",
"stack": "off",
"scaleDistribution": {
"type": "linear"
}
}
},
{
"id": "307152d2-708c-4736-98cf-08b886cbf7f2",
"type": "row",
"name": "网络详情",
"layout": {
"h": 1,
"w": 24,
"x": 0,
"y": 59,
"i": "307152d2-708c-4736-98cf-08b886cbf7f2",
"isResizable": false
},
"collapsed": true
},
{
"targets": [
{
"refId": "A",
"expr": "rate(net_bytes_recv{ident=\"$ident\"}[1m])*8",
"legend": "{{interface}}-recv"
},
{
"expr": "rate(net_bytes_sent{ident=\"$ident\"}[1m])*8",
"refId": "B",
"legend": "{{interface}}-sent"
}
],
"name": "网络流量",
"options": {
"tooltip": {
"mode": "all",
"sort": "desc"
},
"legend": {
"displayMode": "hidden"
},
"standardOptions": {
"util": "bytesIEC",
"decimals": 0
},
"thresholds": {}
},
"custom": {
"drawStyle": "lines",
"lineInterpolation": "smooth",
"fillOpacity": 0.5,
"stack": "off"
},
"version": "2.0.0",
"type": "timeseries",
"layout": {
"h": 7,
"w": 6,
"x": 0,
"y": 60,
"i": "f2ee5d32-737c-4095-b6b7-b15b778ffdb9",
"isResizable": true
},
"id": "f2ee5d32-737c-4095-b6b7-b15b778ffdb9"
},
{
"targets": [
{
"refId": "A",
"expr": "rate(net_packets_recv{ident=\"$ident\"}[1m])",
"legend": "{{interface}}-recv"
},
{
"expr": "rate(net_packets_sent{ident=\"$ident\"}[1m])",
"refId": "B",
"legend": "{{interface}}-sent"
}
],
"name": "packets",
"options": {
"tooltip": {
"mode": "all",
"sort": "desc"
},
"legend": {
"displayMode": "hidden"
},
"standardOptions": {
"decimals": 0
},
"thresholds": {}
},
"custom": {
"drawStyle": "lines",
"lineInterpolation": "smooth",
"fillOpacity": 0.5,
"stack": "off"
},
"version": "2.0.0",
"type": "timeseries",
"layout": {
"h": 7,
"w": 6,
"x": 6,
"y": 60,
"i": "9113323a-98f5-4bff-a8ce-3b459e7e2190",
"isResizable": true
},
"id": "9113323a-98f5-4bff-a8ce-3b459e7e2190"
},
{
"targets": [
{
"refId": "A",
"expr": "rate(net_err_in{ident=\"$ident\"}[1m])",
"legend": "{{interface}}-in"
},
{
"expr": "rate(net_err_out{ident=\"$ident\"}[1m])",
"refId": "B",
"legend": "{{interface}}-out"
}
],
"name": "error",
"options": {
"tooltip": {
"mode": "all",
"sort": "desc"
},
"legend": {
"displayMode": "hidden"
},
"standardOptions": {
"decimals": 0
},
"thresholds": {}
},
"custom": {
"drawStyle": "lines",
"lineInterpolation": "smooth",
"fillOpacity": 0.5,
"stack": "off"
},
"version": "2.0.0",
"type": "timeseries",
"layout": {
"h": 7,
"w": 6,
"x": 12,
"y": 60,
"i": "9634c41c-e124-4d7f-9406-0f86753e8d70",
"isResizable": true
},
"id": "9634c41c-e124-4d7f-9406-0f86753e8d70"
},
{
"targets": [
{
"refId": "A",
"expr": "rate(net_drop_in{ident=\"$ident\"}[1m])",
"legend": "{{interface}}-in"
},
{
"expr": "rate(net_drop_out{ident=\"$ident\"}[1m])",
"refId": "B",
"legend": "{{interface}}-out"
}
],
"name": "drop",
"options": {
"tooltip": {
"mode": "all",
"sort": "desc"
},
"legend": {
"displayMode": "hidden"
},
"standardOptions": {
"decimals": 0
},
"thresholds": {}
},
"custom": {
"drawStyle": "lines",
"lineInterpolation": "smooth",
"fillOpacity": 0.5,
"stack": "off"
},
"version": "2.0.0",
"type": "timeseries",
"layout": {
"h": 7,
"w": 6,
"x": 18,
"y": 60,
"i": "4123f4c1-bf8e-400e-b267-8d7f6a92691a",
"isResizable": true
},
"id": "4123f4c1-bf8e-400e-b267-8d7f6a92691a"
},
{
"targets": [
{
"refId": "A",
"expr": "netstat_tcp_established{ident=\"$ident\"}"
},
{
"expr": "netstat_tcp_listen{ident=\"$ident\"}",
"refId": "B"
},
{
"expr": "netstat_tcp_time_wait{ident=\"$ident\"}",
"refId": "C"
}
],
"name": "tcp",
"options": {
"tooltip": {
"mode": "all",
"sort": "none"
},
"legend": {
"displayMode": "hidden"
},
"standardOptions": {},
"thresholds": {}
},
"custom": {
"drawStyle": "lines",
"lineInterpolation": "smooth",
"fillOpacity": 0.5,
"stack": "off"
},
"version": "2.0.0",
"type": "timeseries",
"layout": {
"h": 7,
"w": 24,
"x": 0,
"y": 67,
"i": "cfb80689-de7b-47fb-9155-052b796dd7f5",
"isResizable": true
},
"id": "cfb80689-de7b-47fb-9155-052b796dd7f5"
},
{
"type": "row",
"id": "b424af28-627f-4f36-8449-51f44c359675",
"name": "分组",
"collapsed": false,
"layout": {
"h": 1,
"w": 24,
"x": 0,
"y": 74,
"i": "b424af28-627f-4f36-8449-51f44c359675",
"isResizable": false
}
},
{
"type": "row",
"id": "d62256e7-e9ce-4bf6-9285-45a1c6545acb",
"name": "分组",
"collapsed": false,
"layout": {
"h": 1,
"w": 24,
"x": 0,
"y": 75,
"i": "d62256e7-e9ce-4bf6-9285-45a1c6545acb",
"isResizable": false
}
}
],
"datasourceValue": "ZW-HLW"
}
}
监控项
相关配置
监控项为categraf插件配置控制,categraf采集插件说明:
采集插件的代码,在代码的inputs目录,每个插件一个独立的目录,目录下是采集代码,以及相关的监控大盘JSON(如有)和告警规则JSON(如有),Linux相关的大盘和告警规则没有散在 cpu、mem、disk等采集器目录,而是一并放到了 system 目录下,方便使用。
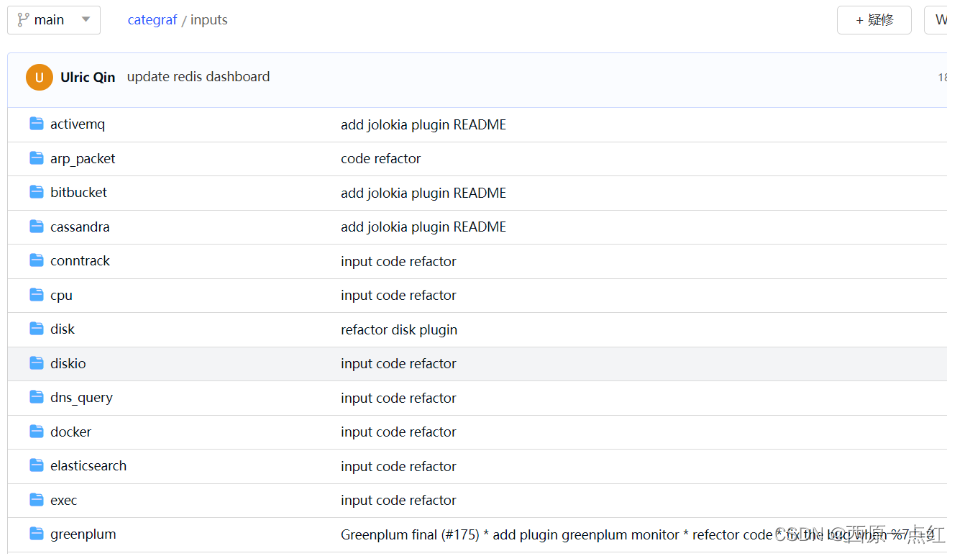
插件的配置文件,放在categraf/conf目录,以input.打头,每个配置文件都有详尽的注释,如果整不明白,就直接去看inputs目录下的对应采集器的代码,Go的代码非常易读,比如某个配置不知道是做什么的,去采集器代码里搜索相关配置项,很容易就可以找到答案。
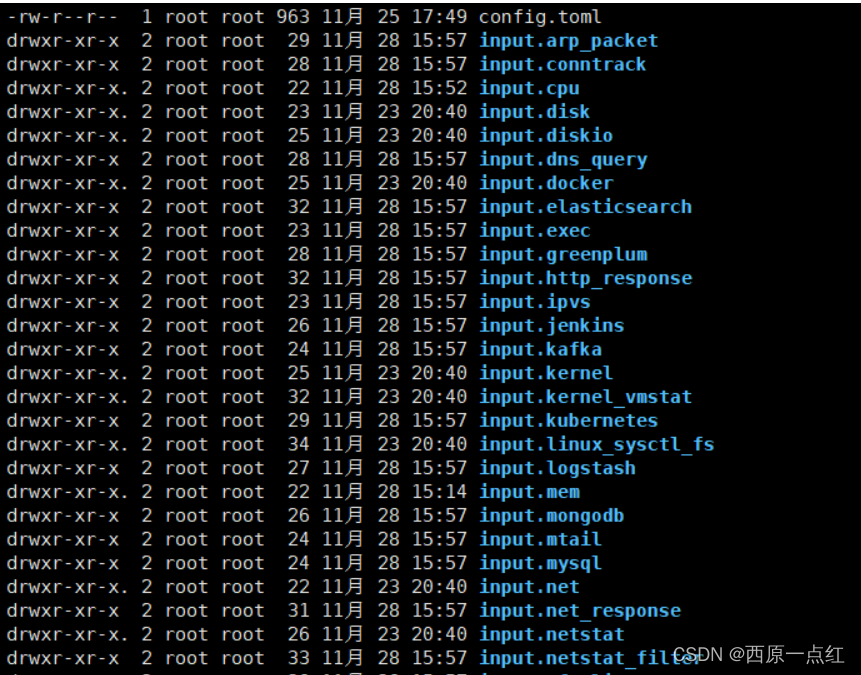
对于每个采集器的配置,不在这里一一赘述,只讲一些相对通用的配置项。
interval:每个插件的配置中,一开始通常都是 interval 配置,表示采集频率,如果这个配置注释掉了,就会复用 config.toml 中的采集频率,这个配置如果配置成数字,单位就是秒,如果配置成字符串,就要给出单位,比如:
interval = 60
interval = "60s"
interval = "1m"
上面三种写法,都表示采集频率是1分钟,如果是使用字符串,可以使用的单位有:
-
秒:s
-
分钟:m
-
小时:h
-
instances:很多采集插件的配置中,都有 instances 配置段,用 [[]] 包住,说明是数组,即,可以出现多个 [[instances]] 配置段,比如 ping 监控的采集插件,想对4个IP做PING探测,可以按照下面的方式来配置:
[[instances]]
targets = [
    "www.baidu.com",
    "127.0.0.1",
    "10.4.5.6",
    "10.4.5.7"
]
也可以下面这样子配置:
[[instances]]
targets = [
    "www.baidu.com",
    "127.0.0.1"
]

[[instances]]
targets = [
    "10.4.5.6",
    "10.4.5.7"
]
-
interval_times:instances 下面如果有 interval_times 配置,表示 interval 的倍数,比如ping监控,有些地址采集频率是15秒,有些可能想采集的别太频繁,比如30秒,那就可以把interval配置成15,把不需要频繁采集的那些instances的interval_times配置成2;或者:把interval配置成5,需要15秒采集一次的那些instances的interval_times配置成3,需要30秒采集一次的那些instances的interval_times配置成6 -
labels:instances 下面的 labels 和 config.toml 中的 global.labels 的作用类似,只是生效范围不同,都是为时序数据附加标签,instances 下面的 labels 是附到对应的实例上,global.labels 是附到所有时序数据上。
页面展示
配置项在夜莺webapi的快捷视图里面可以直观查看:
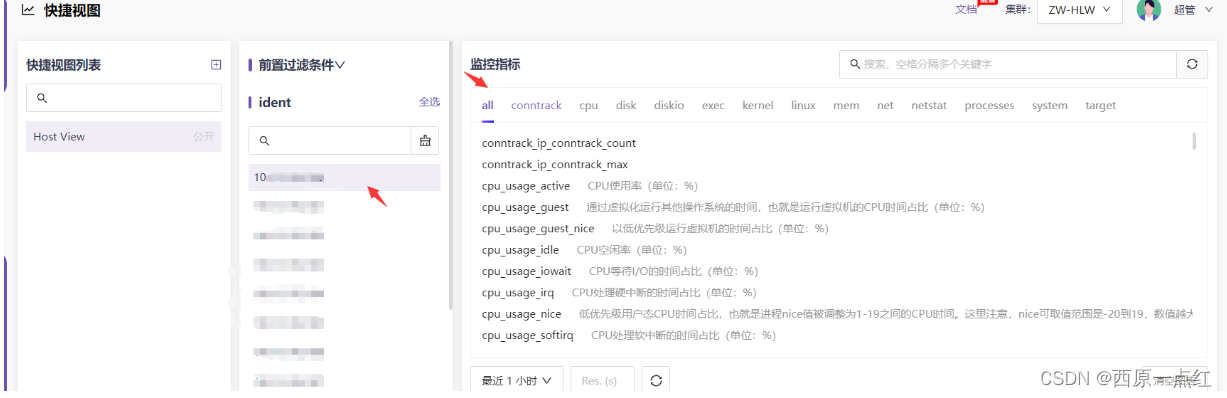
监控指标对应的注释,在夜莺服务端etc/conf/metrics.yaml文件中配置
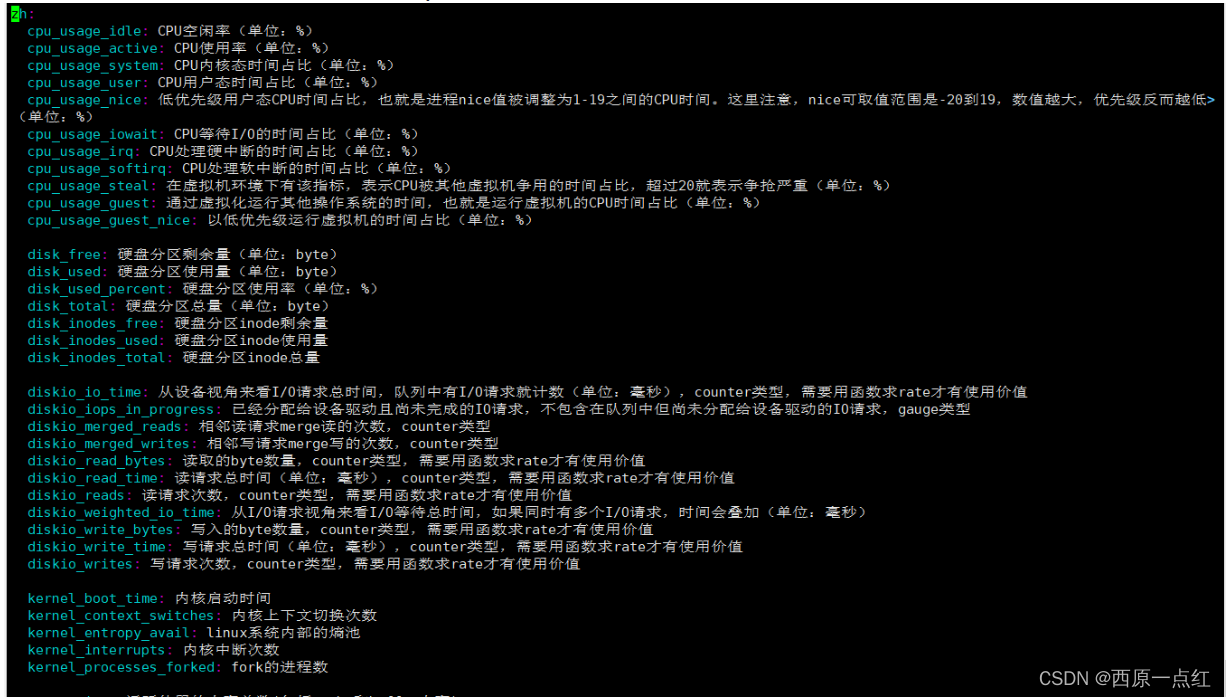
非默认常用监控项
mysql
mysql监控采集插件,核心原理就是连到 mysql实例,执行一些 sql,解析输出内容,整理为监控数据上报。配置文件如下:
路径:/conf/input.mysql/mysql.toml
- mysql.go 采集插件及配置介绍
# mysql
## Configuration
# # collect interval
# interval = 15
# 要监控 MySQL,首先要给出要监控的MySQL的连接地址、用户名、密码
[[instances]]
address = "127.0.0.1:3306"
username = "root"
password = "1234"

# 为mysql实例附一个instance的标签,因为通过address=127.0.0.1:3306不好区分
# important! use global unique string to specify instance
labels = { instance="n9e-10.2.3.4:3306" }

# # set tls=custom to enable tls
# parameters = "tls=false"

# 通过 show global status监控mysql,默认抓取一些基础指标,
# 如果想抓取更多global status的指标,把下面的配置设置为true
extra_status_metrics = true

# 通过show global variables监控mysql的全局变量,默认抓取一些常规的
# 常规的基本够用了,扩展的部分,默认不采集,下面的配置设置为false
extra_innodb_metrics = false

# 监控processlist,关注较少,默认不采集
gather_processlist_processes_by_state = false
gather_processlist_processes_by_user = false

# 监控各个数据库的磁盘占用大小
gather_schema_size = false

# 监控所有的table的磁盘占用大小
gather_table_size = false

# 是否采集系统表的大小,通过不用,所以默认设置为false
gather_system_table_size = false

# 通过 show slave status监控slave的情况,比较关键,所以默认采集
gather_slave_status = true

# # timeout
# timeout_seconds = 3

# # interval = global.interval * interval_times
# interval_times = 1

# TLS配置
## Optional TLS Config
# use_tls = false
# tls_min_version = "1.2"
# tls_ca = "/etc/categraf/ca.pem"
# tls_cert = "/etc/categraf/cert.pem"
# tls_key = "/etc/categraf/key.pem"
## Use TLS but skip chain & host verification
# insecure_skip_verify = true

# 自定义SQL,指定SQL、返回的各个列那些是作为metric,哪些是作为label
# [[instances.queries]]
# mesurement = "users"
# metric_fields = [ "total" ]
# label_fields = [ "service" ]
# # field_to_append = ""
# timeout = "3s"
# request = '''
# select 'n9e' as service, count(*) as total from n9e_v5.users

## 监控多个实例
`[[instances]]`部分表示数组,是可以出现多个的,所以,举例:

[[instances]]
address = "10.2.3.6:3306"
username = "root"
password = "1234"
labels = { instance="n9e-10.2.3.6:3306" }

[[instances]]
address = "10.2.6.9:3306"
username = "root"
password = "1234"
labels = { instance="zbx-10.2.6.9:3306" }
- categraf/conf/input.mysql/mysql.toml配置
[[instances]]
address = "127.0.0.1:3306"
username = "root"
password = "数据库密码"
labels = { instance="xxx数据库" }

# # set tls=custom to enable tls
# # parameters = "tls=false"

extra_status_metrics = true
extra_innodb_metrics = true
gather_processlist_processes_by_state = false
gather_processlist_processes_by_user = false
gather_schema_size = false
gather_table_size = false
gather_system_table_size = false
gather_slave_status = true


#[[instances.queries]]
# mesurement = "lock_wait"
# metric_fields = [ "total" ]
# timeout = "3s"
# request = '''
#SELECT count(*) as total FROM information_schema.innodb_trx WHERE trx_state='LOCK WAIT'
#'''

# [[instances.queries]]
# mesurement = "users"
# metric_fields = [ "total" ]
# label_fields = [ "service" ]
# # field_to_append = ""
# timeout = "3s"
# request = '''
# select 'n9e' as service, count(*) as total from n9e_v5.users
# '''
自定义脚本
- exec.go 采集插件及配置介绍
采集插件exec.go
该插件用于给用户自定义监控脚本,监控脚本采集到监控数据之后通过相应的格式输出到stdout,categraf截获stdout内容,解析之后传给服务端,脚本的输出格式支持3种:influx、falcon、prometheus。
# exec
## influx

influx 格式的内容规范:

mesurement,labelkey1=labelval1,labelkey2=labelval2 field1=1.2,field2=2.3

- 首先mesurement,表示一个类别的监控指标,比如 connections;
- mesurement后面是逗号,逗号后面是标签,如果没有标签,则mesurement后面不需要逗号
- 标签是k=v的格式,多个标签用逗号分隔,比如region=beijing,env=test
- 标签后面是空格
- 空格后面是属性字段,多个属性字段用逗号分隔
- 属性字段是字段名=值的格式,在categraf里值只能是数字

最终,mesurement和各个属性字段名称拼接成metric名字

## falcon

Open-Falcon的格式如下,举例:
[
    {
        "endpoint": "test-endpoint",
        "metric": "test-metric",
        "timestamp": 1658490609,
        "step": 60,
        "value": 1,
        "counterType": "GAUGE",
        "tags": "idc=lg,loc=beijing",
    },
    {
        "endpoint": "test-endpoint",
        "metric": "test-metric2",
        "timestamp": 1658490609,
        "step": 60,
        "value": 2,
        "counterType": "GAUGE",
        "tags": "idc=lg,loc=beijing",
    }
]
timestamp、step、counterType,这三个字段在categraf处理的时候会直接忽略掉,endpoint会放到labels里上报。

## prometheus

prometheus 格式大家不陌生了,比如我这里准备一个监控脚本,输出 prometheus 的格式数据:

#!/bin/sh

echo '# HELP demo_http_requests_total Total number of http api requests'
echo '# TYPE demo_http_requests_total counter'
echo 'demo_http_requests_total{api="add_product"} 4633433'

其中 `#` 注释的部分,其实会被 categraf 忽略,不要也罢,prometheus 协议的数据具体的格式,请大家参考 prometheus 官方文档
- categraf/conf/input.exec/exec.toml配置
## 收集间隔时间s
# # collect interval
# interval = 15

[[instances]]
# # commands, support glob
commands = [
# 指定脚本位置
#     "/opt/categraf/scripts/*.sh"
"/categraf/categraf-v0.2.22-linux-amd64/sh/*.sh"
]

## 每个命令完成的超时时间
# # timeout for each command to complete
 timeout = 5

## 间隔时间s
# # interval = global.interval * interval_times
 interval_times = 1

## influx 输出格式
# # mesurement,labelkey1=labelval1,labelkey2=labelval2 field1=1.2,field2=2.3
 data_format = "influx"
3、influx 输出格式脚本示列
监控指标名生成方式为:mesurement_field
该脚本为查看centos服务器当前登录用户数,监控指标名为exec_who_whosum:
#!/bin/sh

whosum=`who |wc -l`
echo "exec_who,remark=当前登录用户总数 whosum=$whosum"
图示:
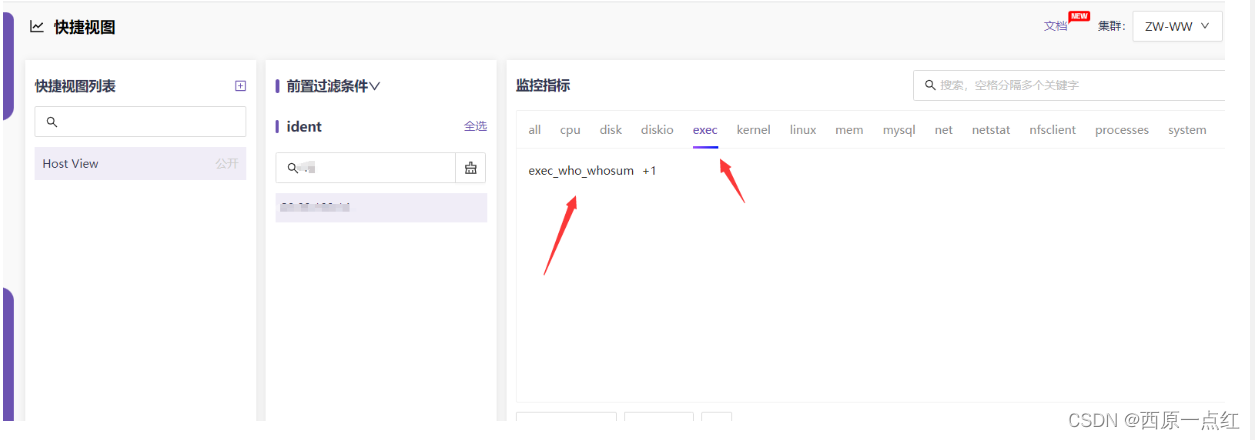
关于采集kubectl top命令中相关值(获取pod所占用的资源)
目前查阅到的信息来看,想获取当前pod运行的所消耗的资源,官方推荐采集器 kube-state-metrics(截止2.9.2)中没有该监控项。而可以获取值的 metrics-server没找到有采集器可以去采集其中的资源。
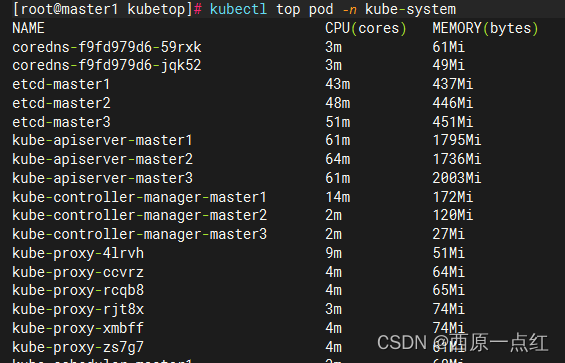
基于所有监控即是调用底层命令采集数据。
使用该脚本在服categraf上做自定义采集。以pod为例.
#bin/sh
> /categraf/categraf-v0.2.22-linux-amd64/kubetop/result.txt
#######################
#     POD采集
#######################

#获取所有namespace
kubens=$(kubectl get namespace | awk 'NR>2{print line}{line=$1} END{print $1}')
#将namespace定义为一个数组
kubennslist=($kubens)
#循环遍历通过namespace获取pod运行时的数据
for ns in "${kubennslist[@]}"
do
#获取container名称
   con=$(kubectl top pod -n $ns  | awk 'NR>2{print line}{line=$1} END{print $1}')
#获取cpu使用量(m)
  cpu=$(kubectl top pod -n $ns  | awk 'NR>2{print line}{line=$2} END{print $2}')
#获取内存使用量(Mi)
  memo=$(kubectl top pod -n $ns  | awk 'NR>2{print line}{line=$3} END{print $3}')
#将取到的值加入数组循环
   listcon=($con)
   listcpu=($cpu)
   listmemo=($memo)
#循环输出每一条记录
    for ((i=0; i<${#listcon[@]}; i++)); do
#取消值后1位,使其变成一个值
      cpuvalue=${listcpu[$i]::-1}
#取消值后2位,使其变成一个值
      memovalue=${listmemo[$i]::-2}
#将结果输出到一个文件中,直接执行在没有pod的命名空间下,会强制输出:No resources found in xxxxx namespace
      echo "kubectl_top_pod,namespace=$ns,container=${listcon[$i]} cpu=$cpuvalue,memory=$memovalue" >> /categraf/categraf-v0.2.22-linux-amd64/kubetop/result.txt
    done
done
#在categraf采集器脚本中直接每一段去读取一行,输出到Prometheus

#######################
#     NODE采集
#######################
#获取node名称
  node=$(kubectl top node | awk 'NR>2{print line}{line=$1} END{print $1}')
#获取cpu使用量
 cpu=$(kubectl top node  | awk 'NR>2{print line}{line=$2} END{print $2}')
#获取cpu使用率
  cpubfb=$(kubectl top node  | awk 'NR>2{print line}{line=$3} END{print $3}')
#获取内存使用量
  memo=$(kubectl top node  | awk 'NR>2{print line}{line=$4} END{print $4}')
#获取内存使用率
  memobfb=$(kubectl top node  | awk 'NR>2{print line}{line=$5} END{print $5}')
#加入数组
   listnode=($node)
   listcpu=($cpu)
   listcpubfb=($cpubfb)
   listmemo=($memo)
   listmemobfb=($memobfb)
    for ((i=0; i<${#listnode[@]}; i++)); do
#取消输出的单位
      cpuvalue=${listcpu[$i]::-1}
      cpubfbvalus=${listcpubfb[$i]::-1}
      memovalue=${listmemo[$i]::-2}
      memobfbvalue=${listmemobfb[$i]::-1}
      echo "kubectl_top_node,node=${listnode[$i]} cpu=$cpuvalue,cpubfb=$cpubfbvalus,memory=$memovalue,memobfb=$memobfbvalue" >> /categraf/categraf-v0.2.22-linux-amd64/kubetop/result.txt
    done
#!/bin/sh

while read line
do
    echo $line
done < /categraf/categraf-v0.2.22-linux-amd64/kubetop/result.txt
效果图:
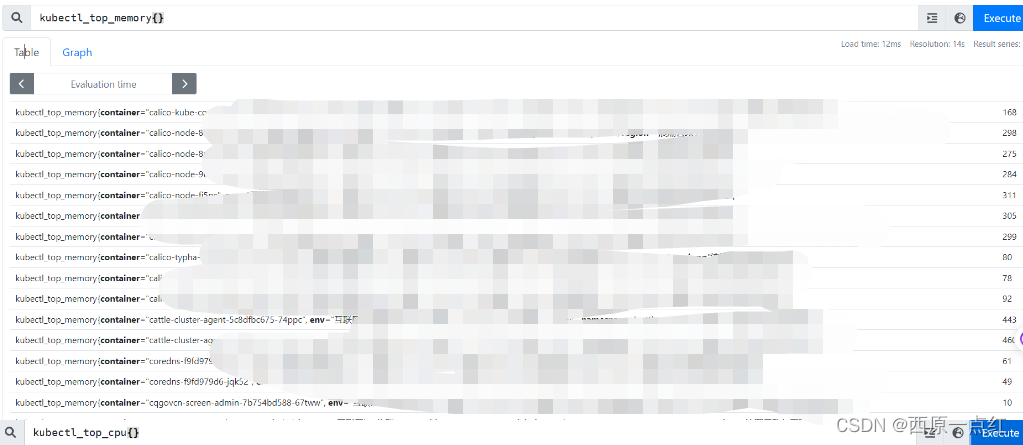
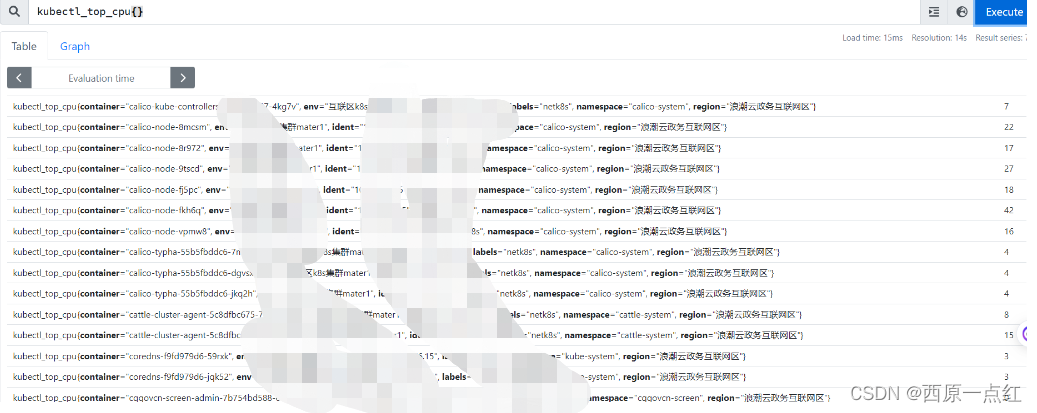
端口监控
通过端口号判断服务是否存活
- net_response.go 采集插件及配置介绍
# net_response

网络探测插件,通常用于监控本机某个端口是否在监听,或远端某个端口是否能连通

## code meanings

- 0: Success
- 1: Timeout
- 2: ConnectionFailed
- 3: ReadFailed
- 4: StringMismatch

## Configuration

最核心的配置就是 targets 部分,指定探测的目标,下面的例子:


[[instances]]
targets = [
    "10.2.3.4:22",
    "localhost:6379",
    ":9090"
]


- `10.2.3.4:22` 表示探测 10.2.3.4 这个机器的 22 端口是否可以连通
- `localhost:6379` 表示探测本机的 6379 端口是否可以连通
- `:9090` 表示探测本机的 9090 端口是否可以连通

监控数据或告警事件中只是一个 IP 和端口,接收告警的人看到了,可能不清楚只是哪个业务的模块告警了,可以附加一些更有价值的信息放到标签里,比如例子中:

labels = { region="cloud", product="n9e" }

标识了这是 cloud 这个 region,n9e 这个产品,这俩标签会附到时序数据上,告警的时候自然也会报出来。
- 配置
路径:conf/input.net_response/net_response.toml
[[instances]]
targets = [
          ":8080"
]
labels = { region="政务外网", product="IIP-node6-server:8080" }


[[instances]]
targets = [
          ":8100"
]
labels = { region="政务外网", product="IIP-node6-openoffice:8100" }

[[instances]]
targets = [
          ":9600"
]
labels = { region="政务外网", product="IIP-node6-logstash:9600" }
- 监控大盘
{
    "name": "TCP探测",
    "tags": "",
    "ident": "",
    "configs": {
        "version": "2.0.0",
        "panels": [
            {
                "id": "356e3fee-56ef-4107-8d1e-0d4d1433cf1f",
                "type": "row",
                "name": "端口状态",
                "layout": {
                    "h": 1,
                    "w": 24,
                    "x": 0,
                    "y": 0,
                    "i": "356e3fee-56ef-4107-8d1e-0d4d1433cf1f",
                    "isResizable": false
                },
                "collapsed": true,
                "panels": []
            },
            {
                "type": "table",
                "id": "b74522ef-dd49-4bf8-b595-3e12b63bc6a3",
                "layout": {
                    "h": 15,
                    "w": 24,
                    "x": 0,
                    "y": 1,
                    "i": "b74522ef-dd49-4bf8-b595-3e12b63bc6a3",
                    "isResizable": true
                },
                "version": "2.0.0",
                "datasourceCate": "prometheus",
                "targets": [
                    {
                        "refId": "A",
                        "expr": "max(net_response_result_code{ident=~\"$ident\"}) by (product)",
                        "legend": "端口状态",
                        "time": {
                            "start": "now-1m",
                            "end": "now"
                        }
                    },
                    {
                        "expr": "max(net_response_response_time{ident=~\"$ident\"}) by (product)",
                        "refId": "C",
                        "legend": "延迟(s)",
                        "time": {
                            "start": "now-1m",
                            "end": "now"
                        }
                    }
                ],
                "name": "端口状态详情",
                "custom": {
                    "showHeader": true,
                    "colorMode": "background",
                    "calc": "lastNotNull",
                    "displayMode": "labelValuesToRows",
                    "aggrDimension": "product"
                },
                "options": {
                    "valueMappings": [],
                    "standardOptions": {}
                },
                "overrides": [
                    {
                        "properties": {
                            "valueMappings": [
                                {
                                    "type": "special",
                                    "match": {
                                        "special": 0
                                    },
                                    "result": {
                                        "text": "UP",
                                        "color": "#417505"
                                    }
                                },
                                {
                                    "type": "range",
                                    "match": {
                                        "special": 1,
                                        "from": 1
                                    },
                                    "result": {
                                        "text": "DOWN",
                                        "color": "#e90f0f"
                                    }
                                }
                            ],
                            "standardOptions": {}
                        },
                        "matcher": {
                            "value": "A"
                        }
                    }
                ]
            },
            {
                "type": "row",
                "id": "fd35068d-d65b-4f16-a8be-5a075f592e87",
                "name": "总览",
                "collapsed": false,
                "layout": {
                    "x": 0,
                    "y": 46,
                    "w": 24,
                    "h": 1,
                    "i": "fd35068d-d65b-4f16-a8be-5a075f592e87"
                }
            }
        ],
        "var": [
            {
                "name": "ident",
                "type": "query",
                "definition": "label_values(net_response_result_code, ident)"
            }
        ],
        "datasourceValue": "ZW-WW"
    }
}
- 告警规则
[
    {
      "name": "网络地址探活失败",
      "note": "",
      "severity": 2,
      "disabled": 0,
      "prom_for_duration": 60,
      "prom_ql": "net_response_result_code != 0",
      "prom_eval_interval": 15,
      "enable_stime": "00:00",
      "enable_etime": "23:59",
      "enable_days_of_week": [
        "1",
        "2",
        "3",
        "4",
        "5",
        "6",
        "0"
      ],
      "enable_in_bg": 0,
      "notify_recovered": 1,
      "notify_channels": [],
      "notify_repeat_step": 60,
      "recover_duration": 0,
      "callbacks": [],
      "runbook_url": "",
      "append_tags": []
    }
  ]
redis监控
- redis.go 采集插件及配置说明
# redis

redis 的监控原理,就是连上 redis,执行 info 命令,解析结果,整理成监控数据上报。

## Configuration

redis 插件的配置在 `conf/input.redis/redis.toml` 最简单的配置如下:

[[instances]]
address = "127.0.0.1:6379"
username = ""
password = ""
labels = { instance="n9e-10.23.25.2:6379" }


如果要监控多个 redis 实例,就增加 instances 即可:


[[instances]]
address = "10.23.25.2:6379"
username = ""
password = ""
labels = { instance="n9e-10.23.25.2:6379" }

[[instances]]
address = "10.23.25.3:6379"
username = ""
password = ""
labels = { instance="n9e-10.23.25.3:6379" }


建议通过 labels 配置附加一个 instance 标签,便于后面复用监控大盘。
-
配置文件
路径:conf/input.redis/redis.toml
配置参考1. -
监控大盘
{
"name": "Redis监控",
"tags": "Redis Prometheus",
"ident": "",
"configs": {
"var": [
{
"name": "instance",
"definition": "label_values(redis_uptime_in_seconds,instance)",
"selected": "10.206.0.16:6379"
}
],
"version": "2.0.0",
"panels": [
{
"id": "5d545d1c-e73a-44c8-9584-0afac51f33a3",
"type": "row",
"name": "基本信息",
"layout": {
"h": 1,
"w": 24,
"x": 0,
"y": 0,
"i": "5d545d1c-e73a-44c8-9584-0afac51f33a3"
},
"collapsed": true,
"panels": []
},
{
"type": "stat",
"id": "5bd9eb77-582b-4d3e-bf26-fca0995afded",
"layout": {
"h": 3,
"w": 6,
"x": 0,
"y": 1,
"i": "5bd9eb77-582b-4d3e-bf26-fca0995afded"
},
"version": "2.0.0",
"datasourceCate": "prometheus",
"targets": [
{
"expr": "min(redis_uptime_in_seconds{instance=~\"$instance\"})"
}
],
"name": "Redis 启动时间",
"custom": {
"textMode": "value",
"colorMode": "value",
"calc": "lastNotNull",
"valueField": "Value",
"colSpan": 1,
"textSize": {}
},
"options": {
"standardOptions": {
"util": "humantimeSeconds"
},
"thresholds": {
"steps": [
{
"color": "#634CD9",
"value": null,
"type": "base"
}
]
}
}
},
{
"type": "stat",
"id": "1e196359-28c0-4f48-9f42-7e5474714b76",
"layout": {
"h": 3,
"w": 6,
"x": 6,
"y": 1,
"i": "1e196359-28c0-4f48-9f42-7e5474714b76"
},
"version": "2.0.0",
"datasourceCate": "prometheus",
"targets": [
{
"expr": "sum(redis_connected_clients{instance=~\"$instance\"})"
}
],
"name": "客户端连接数",
"custom": {
"textMode": "value",
"colorMode": "value",
"calc": "lastNotNull",
"valueField": "Value",
"colSpan": 1,
"textSize": {}
},
"options": {
"standardOptions": {},
"thresholds": {
"steps": [
{
"color": "#634CD9",
"value": null,
"type": "base"
}
]
}
}
},
{
"type": "stat",
"id": "6ca62853-1e0a-4a6d-acce-885ada82b311",
"layout": {
"h": 3,
"w": 6,
"x": 12,
"y": 1,
"i": "6ca62853-1e0a-4a6d-acce-885ada82b311"
},
"version": "2.0.0",
"datasourceCate": "prometheus",
"targets": [
{
"expr": "redis_used_memory{instance=~\"$instance\"}"
}
],
"name": "使用的内存",
"custom": {
"textMode": "value",
"colorMode": "value",
"calc": "lastNotNull",
"valueField": "Value",
"colSpan": 1,
"textSize": {}
},
"options": {
"valueMappings": [
{
"type": "range",
"match": {
"to": 128000000
},
"result": {
"color": "#079e05"
}
},
{
"type": "range",
"match": {
"from": 128000000
},
"result": {
"color": "#f10909"
}
}
],
"standardOptions": {
"util": "bytesIEC",
"decimals": 0
},
"thresholds": {
"steps": [
{
"color": "#634CD9",
"value": null,
"type": "base"
}
]
}
}
},
{
"type": "stat",
"id": "4865ea67-ff6f-41cb-ab77-7ad2581eda17",
"layout": {
"h": 3,
"w": 6,
"x": 18,
"y": 1,
"i": "4865ea67-ff6f-41cb-ab77-7ad2581eda17"
},
"version": "2.0.0",
"datasourceCate": "prometheus",
"targets": [
{
"expr": "redis_maxmemory{instance=~\"$instance\"}"
}
],
"name": "最大内存限制",
"custom": {
"textMode": "value",
"colorMode": "value",
"calc": "lastNotNull",
"valueField": "Value",
"colSpan": 1,
"textSize": {}
},
"options": {
"standardOptions": {
"util": "bytesIEC"
},
"thresholds": {
"steps": [
{
"color": "#634CD9",
"value": null,
"type": "base"
}
]
}
}
},
{
"id": "a5ecae6a-6475-487d-9c0e-bbd3abf66be1",
"type": "row",
"name": "Commands",
"layout": {
"h": 1,
"w": 24,
"x": 0,
"y": 7,
"i": "a5ecae6a-6475-487d-9c0e-bbd3abf66be1"
},
"collapsed": true
},
{
"type": "timeseries",
"id": "cdd1d4ea-d98c-4c04-9cea-46664723ad70",
"layout": {
"h": 7,
"w": 8,
"x": 0,
"y": 8,
"i": "cdd1d4ea-d98c-4c04-9cea-46664723ad70"
},
"version": "2.0.0",
"datasourceCate": "prometheus",
"targets": [
{
"expr": "rate(redis_total_commands_processed{instance=~\"$instance\"}[5m])"
}
],
"name": "每秒执行的命令数",
"options": {
"tooltip": {
"mode": "all",
"sort": "none"
},
"legend": {
"displayMode": "hidden"
},
"standardOptions": {},
"thresholds": {
"steps": [
{
"color": "#634CD9",
"value": null,
"type": "base"
}
]
}
},
"custom": {
"drawStyle": "lines",
"lineInterpolation": "smooth",
"spanNulls": false,
"lineWidth": 1,
"fillOpacity": 0.5,
"gradientMode": "none",
"stack": "off",
"scaleDistribution": {
"type": "linear"
}
}
},
{
"type": "timeseries",
"id": "47f3a0b5-2ae7-4635-89f2-c0aafcd0cd86",
"layout": {
"h": 7,
"w": 8,
"x": 8,
"y": 8,
"i": "47f3a0b5-2ae7-4635-89f2-c0aafcd0cd86"
},
"version": "2.0.0",
"datasourceCate": "prometheus",
"targets": [
{
"expr": "irate(redis_keyspace_hits{instance=~\"$instance\"}[5m])",
"legend": "hits"
},
{
"expr": "irate(redis_keyspace_misses{instance=~\"$instance\"}[5m])",
"legend": "misses"
}
],
"name": "每秒命中/未命中次数",
"options": {
"tooltip": {
"mode": "all",
"sort": "none"
},
"legend": {
"displayMode": "hidden"
},
"standardOptions": {},
"thresholds": {
"steps": [
{
"color": "#634CD9",
"value": null,
"type": "base"
}
]
}
},
"custom": {
"drawStyle": "lines",
"lineInterpolation": "smooth",
"spanNulls": false,
"lineWidth": 1,
"fillOpacity": 0.5,
"gradientMode": "none",
"stack": "noraml",
"scaleDistribution": {
"type": "linear"
}
}
},
{
"type": "timeseries",
"id": "0864729d-a8f2-4f06-9efc-21f1d46b8034",
"layout": {
"h": 7,
"w": 8,
"x": 16,
"y": 8,
"i": "0864729d-a8f2-4f06-9efc-21f1d46b8034"
},
"version": "2.0.0",
"datasourceCate": "prometheus",
"targets": [
{
"expr": "topk(5, irate(redis_cmdstat_calls{instance=~\"$instance\"} [1m]))",
"legend": "{{command}}"
}
],
"name": "命令排行",
"options": {
"tooltip": {
"mode": "all",
"sort": "desc"
},
"legend": {
"displayMode": "hidden"
},
"standardOptions": {},
"thresholds": {
"steps": [
{
"color": "#634CD9",
"value": null,
"type": "base"
}
]
}
},
"custom": {
"drawStyle": "lines",
"lineInterpolation": "smooth",
"spanNulls": false,
"lineWidth": 1,
"fillOpacity": 0.5,
"gradientMode": "none",
"stack": "off",
"scaleDistribution": {
"type": "linear"
}
}
},
{
"id": "34bd3205-f568-4ea6-b324-bfa4890f4f71",
"type": "row",
"name": "Keys",
"layout": {
"h": 1,
"w": 24,
"x": 0,
"y": 15,
"i": "34bd3205-f568-4ea6-b324-bfa4890f4f71"
},
"collapsed": true
},
{
"type": "timeseries",
"id": "ab629094-3425-4894-b6df-6fc7f680e9b1",
"layout": {
"h": 7,
"w": 8,
"x": 0,
"y": 16,
"i": "ab629094-3425-4894-b6df-6fc7f680e9b1"
},
"version": "2.0.0",
"datasourceCate": "prometheus",
"targets": [
{
"expr": "sum (redis_keyspace_keys{instance=~\"$instance\"}) by (db)",
"legend": "{{db}}"
}
],
"name": "每个数据库的项目总数",
"options": {
"tooltip": {
"mode": "all",
"sort": "desc"
},
"legend": {
"displayMode": "hidden"
},
"standardOptions": {},
"thresholds": {
"steps": [
{
"color": "#634CD9",
"value": null,
"type": "base"
}
]
}
},
"custom": {
"drawStyle": "lines",
"lineInterpolation": "smooth",
"spanNulls": false,
"lineWidth": 1,
"fillOpacity": 0.5,
"gradientMode": "none",
"stack": "off",
"scaleDistribution": {
"type": "linear"
}
}
},
{
"type": "timeseries",
"id": "27151bcf-0d33-4b13-8daa-d359cbf97a42",
"layout": {
"h": 7,
"w": 8,
"x": 8,
"y": 16,
"i": "27151bcf-0d33-4b13-8daa-d359cbf97a42"
},
"version": "2.0.0",
"datasourceCate": "prometheus",
"targets": [
{
"expr": "sum(rate(redis_expired_keys{instance=~\"$instance\"}[5m])) by (instance)",
"legend": "expired"
},
{
"expr": "sum(rate(redis_evicted_keys{instance=~\"$instance\"}[5m])) by (instance)",
"legend": "evicted"
}
],
"name": "过期数/驱逐数",
"options": {
"tooltip": {
"mode": "all",
"sort": "desc"
},
"legend": {
"displayMode": "hidden"
},
"standardOptions": {},
"thresholds": {
"steps": [
{
"color": "#634CD9",
"value": null,
"type": "base"
}
]
}
},
"custom": {
"drawStyle": "lines",
"lineInterpolation": "smooth",
"spanNulls": false,
"lineWidth": 1,
"fillOpacity": 0.5,
"gradientMode": "none",
"stack": "off",
"scaleDistribution": {
"type": "linear"
}
}
},
{
"type": "timeseries",
"id": "67feb9dd-14f4-440d-9560-1f6bbeee1ca6",
"layout": {
"h": 7,
"w": 8,
"x": 16,
"y": 16,
"i": "67feb9dd-14f4-440d-9560-1f6bbeee1ca6"
},
"version": "2.0.0",
"datasourceCate": "prometheus",
"targets": [
{
"expr": "sum(redis_keyspace_keys{instance=~\"$instance\"}) - sum(redis_keyspace_expires{instance=~\"$instance\"}) ",
"legend": "not expiring"
},
{
"expr": "sum(redis_keyspace_expires{instance=~\"$instance\"}) ",
"legend": "expiring"
}
],
"name": "过期与未过期密钥",
"options": {
"tooltip": {
"mode": "all",
"sort": "none"
},
"legend": {
"displayMode": "hidden"
},
"standardOptions": {},
"thresholds": {
"steps": [
{
"color": "#634CD9",
"value": null,
"type": "base"
}
]
}
},
"custom": {
"drawStyle": "lines",
"lineInterpolation": "smooth",
"spanNulls": false,
"lineWidth": 1,
"fillOpacity": 0.5,
"gradientMode": "none",
"stack": "noraml",
"scaleDistribution": {
"type": "linear"
}
}
},
{
"id": "3a8fe6fb-a78d-452d-bda4-aad492e17665",
"type": "row",
"name": "Network",
"layout": {
"h": 1,
"w": 24,
"x": 0,
"y": 23,
"i": "3a8fe6fb-a78d-452d-bda4-aad492e17665"
},
"collapsed": true
},
{
"targets": [
{
"expr": "sum(rate(redis_total_net_input_bytes{instance=~\"$instance\"}[5m]))",
"legend": "input"
},
{
"expr": "sum(rate(redis_total_net_output_bytes{instance=~\"$instance\"}[5m]))",
"legend": "output"
}
],
"name": "Network I/O",
"options": {
"tooltip": {
"mode": "all",
"sort": "desc"
},
"legend": {
"displayMode": "hidden"
},
"standardOptions": {
"util": "bytesIEC",
"decimals": 2
},
"thresholds": {}
},
"custom": {
"drawStyle": "lines",
"lineInterpolation": "smooth",
"fillOpacity": 0.5,
"stack": "off"
},
"version": "2.0.0",
"type": "timeseries",
"layout": {
"h": 7,
"w": 24,
"x": 0,
"y": 24,
"i": "efd4ff53-bad3-47e3-a19b-4f1ae1d49c24"
},
"id": "efd4ff53-bad3-47e3-a19b-4f1ae1d49c24"
}
]
}
}
- 告警规则
[
    {
      "name": "Redis 节点故障",
      "note": "",
      "prod": "",
      "algorithm": "",
      "algo_params": null,
      "delay": 0,
      "severity": 2,
      "disabled": 0,
      "prom_for_duration": 30,
      "prom_ql": "redis_up{} == 0",
      "prom_eval_interval": 15,
      "enable_stime": "00:00",
      "enable_etime": "23:59",
      "enable_days_of_week": [
        "1",
        "2",
        "3",
        "4",
        "5",
        "6",
        "0"
      ],
      "enable_in_bg": 0,
      "notify_recovered": 1,
      "notify_channels": [],
      "notify_repeat_step": 60,
      "notify_max_number": 0,
      "recover_duration": 0,
      "callbacks": [],
      "runbook_url": "",
      "append_tags": []
    },
    {
      "name": "Redis Ping 延迟高(大于100毫秒)",
      "note": "",
      "severity": 2,
      "disabled": 0,
      "prom_for_duration": 60,
      "prom_ql": "redis_ping_use_seconds > 0.1",
      "prom_eval_interval": 15,
      "enable_stime": "00:00",
      "enable_etime": "23:59",
      "enable_days_of_week": [
        "1",
        "2",
        "3",
        "4",
        "5",
        "6",
        "0"
      ],
      "enable_in_bg": 0,
      "notify_recovered": 1,
      "notify_channels": [],
      "notify_repeat_step": 60,
      "recover_duration": 0,
      "callbacks": [],
      "runbook_url": "",
      "append_tags": [
        "alertname=HighPingLatency"
      ]
    },
    {
      "name": "Redis内存使用率较高",
      "note": "",
      "severity": 2,
      "disabled": 0,
      "prom_for_duration": 60,
      "prom_ql": "redis_maxmemory > 0 and (redis_used_memory / redis_maxmemory) > 0.85",
      "prom_eval_interval": 15,
      "enable_stime": "00:00",
      "enable_etime": "23:59",
      "enable_days_of_week": [
        "1",
        "2",
        "3",
        "4",
        "5",
        "6",
        "0"
      ],
      "enable_in_bg": 0,
      "notify_recovered": 1,
      "notify_channels": [],
      "notify_repeat_step": 60,
      "recover_duration": 0,
      "callbacks": [],
      "runbook_url": "",
      "append_tags": [
        "alertname=RedisHighMemoryUsage"
      ]
    },
    {
      "name": "Redis出现拒绝连接",
      "note": "",
      "severity": 2,
      "disabled": 0,
      "prom_for_duration": 0,
      "prom_ql": "(rate(redis_rejected_connections[5m])) > 0",
      "prom_eval_interval": 15,
      "enable_stime": "00:00",
      "enable_etime": "23:59",
      "enable_days_of_week": [
        "1",
        "2",
        "3",
        "4",
        "5",
        "6",
        "0"
      ],
      "enable_in_bg": 0,
      "notify_recovered": 1,
      "notify_channels": [],
      "notify_repeat_step": 60,
      "recover_duration": 0,
      "callbacks": [],
      "runbook_url": "",
      "append_tags": [
        "alertname=RedisRejectedConnHigh"
      ]
    },
    {
      "name": "Redis刚刚有重启,请注意",
      "note": "",
      "severity": 3,
      "disabled": 0,
      "prom_for_duration": 0,
      "prom_ql": "redis_uptime_in_seconds < 600",
      "prom_eval_interval": 15,
      "enable_stime": "00:00",
      "enable_etime": "23:59",
      "enable_days_of_week": [
        "1",
        "2",
        "3",
        "4",
        "5",
        "6",
        "0"
      ],
      "enable_in_bg": 0,
      "notify_recovered": 1,
      "notify_channels": [],
      "notify_repeat_step": 60,
      "recover_duration": 0,
      "callbacks": [],
      "runbook_url": "",
      "append_tags": [
        "alertname=RedisLowUptime"
      ]
    },
    {
      "name": "Redis较低的命中率",
      "note": "",
      "severity": 2,
      "disabled": 0,
      "prom_for_duration": 60,
      "prom_ql": "rate(redis_keyspace_hits[5m])\n/\n(rate(redis_keyspace_misses[5m]) + rate(redis_keyspace_hits[5m]))\n< 0.9",
      "prom_eval_interval": 15,
      "enable_stime": "00:00",
      "enable_etime": "23:59",
      "enable_days_of_week": [
        "1",
        "2",
        "3",
        "4",
        "5",
        "6",
        "0"
      ],
      "enable_in_bg": 0,
      "notify_recovered": 1,
      "notify_channels": [],
      "notify_repeat_step": 60,
      "recover_duration": 0,
      "callbacks": [],
      "runbook_url": "",
      "append_tags": [
        "alertname=RedisLowHitRatio"
      ]
    },
    {
      "name": "Redis驱逐率较高",
      "note": "",
      "severity": 2,
      "disabled": 0,
      "prom_for_duration": 60,
      "prom_ql": "(sum(rate(redis_evicted_keys[5m])) / sum(redis_keyspace_keys)) > 0.1",
      "prom_eval_interval": 15,
      "enable_stime": "00:00",
      "enable_etime": "23:59",
      "enable_days_of_week": [
        "1",
        "2",
        "3",
        "4",
        "5",
        "6",
        "0"
      ],
      "enable_in_bg": 0,
      "notify_recovered": 1,
      "notify_channels": [],
      "notify_repeat_step": 60,
      "recover_duration": 0,
      "callbacks": [],
      "runbook_url": "",
      "append_tags": [
        "alertname=RedisHighKeysEvictionRatio"
      ]
    }
  ]
监控大盘和告警规则
该 README 的同级目录下,提供了 dashboard.json 就是监控大盘的配置,alerts.json 是告警规则,可以导入夜莺使用。
告警
告警规则
告警规则支持可视化配置,菜单如下:
[告警管理]→[告警规则]
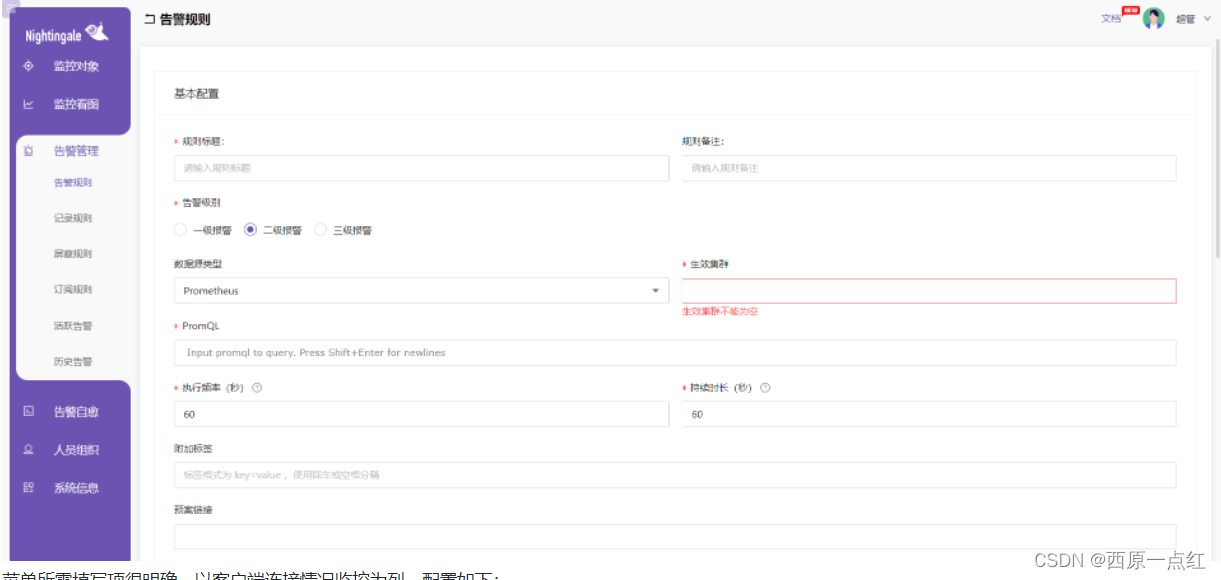
菜单所需填写项很明确,以客户端连接情况监控为列,配置如下:
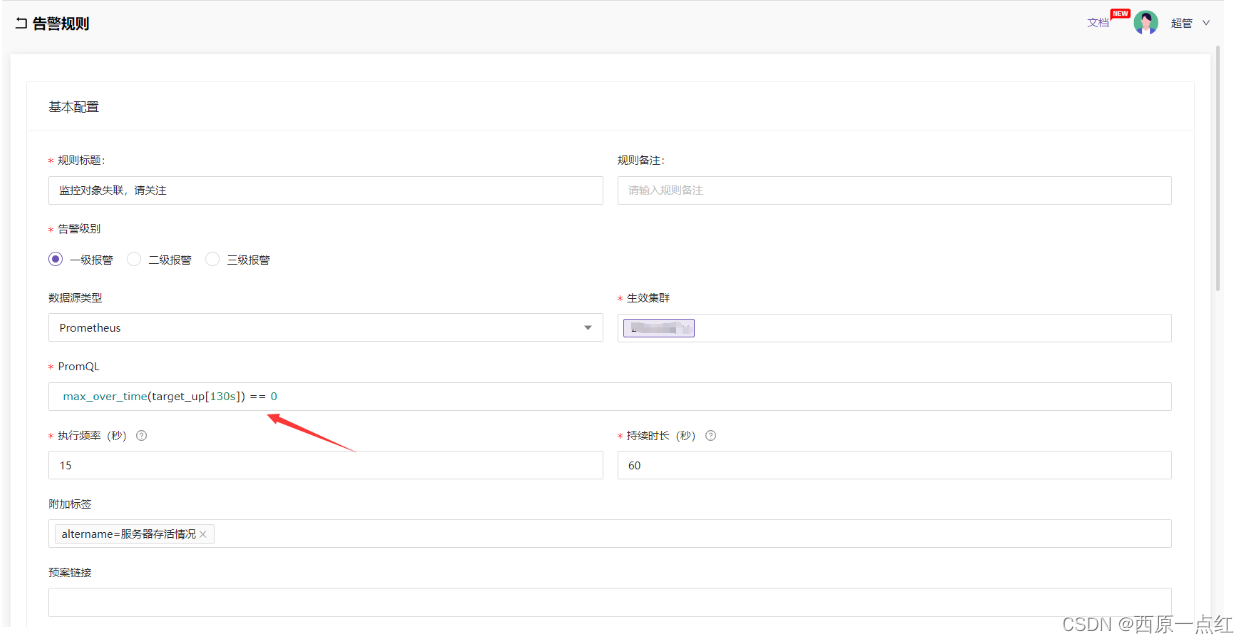
屏蔽规则
在实际应用中,对于一些监控项,并不适用所有监控主机告警,所以应根据实际情况配置屏蔽规则
屏蔽规则:根据告警事件的标签匹配屏蔽
在[历史告警]菜单中,可以直观的看到监控项通过告警规则后生成告警所带的标签(该标签自主可配,主机lable、告警规则lable等)

示列:屏蔽ident=xxxx.xxx.xxx.xxx且告警规则名为"硬盘-IO有点繁忙,请关注"的相关告警。

接入钉钉告警通知
-
钉钉告警流程图
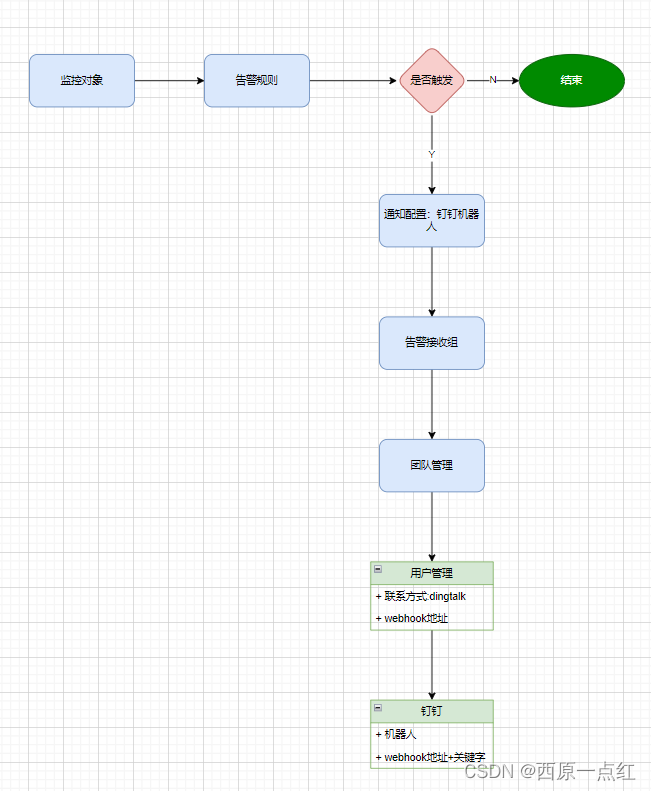
-
接入钉钉告警配置
2.1 钉钉添加机器人,获取机器人webhook地址(不赘述);
2.2 夜莺webapi([人员组织]→[用户管理]→[创建用户])新建告警用户,添加用户联系方式,如图:
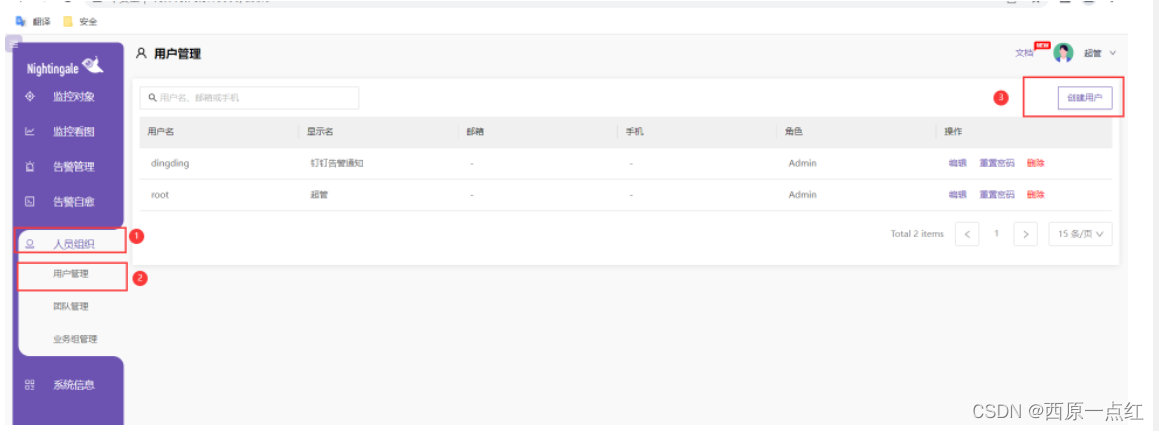
添加用户联系方式为dingtalk,并填入2.1获取到的webhook地址
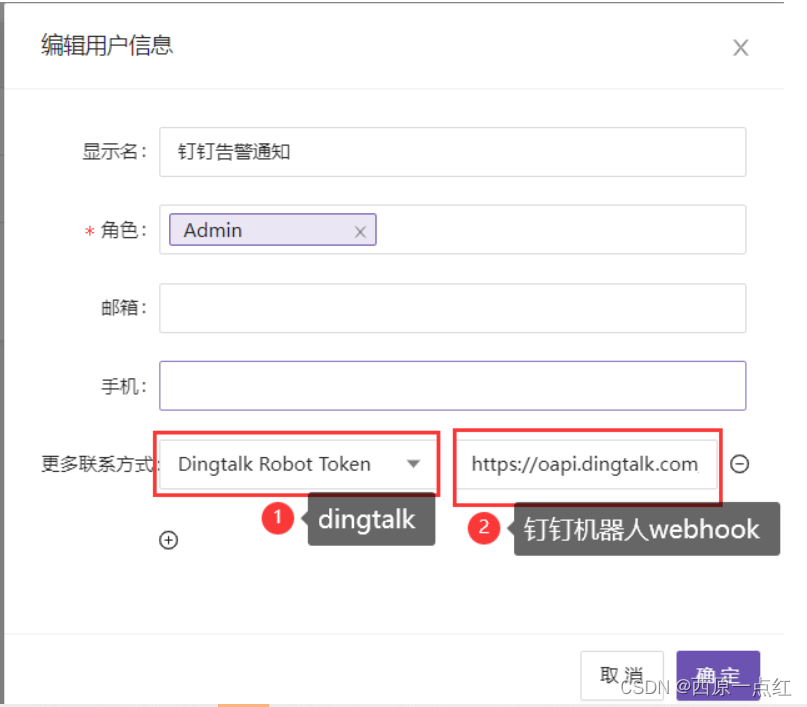
2.3 新建告警团队,并将告警用户加入团队
[人员组织]→[团队管理]→[新建团队]
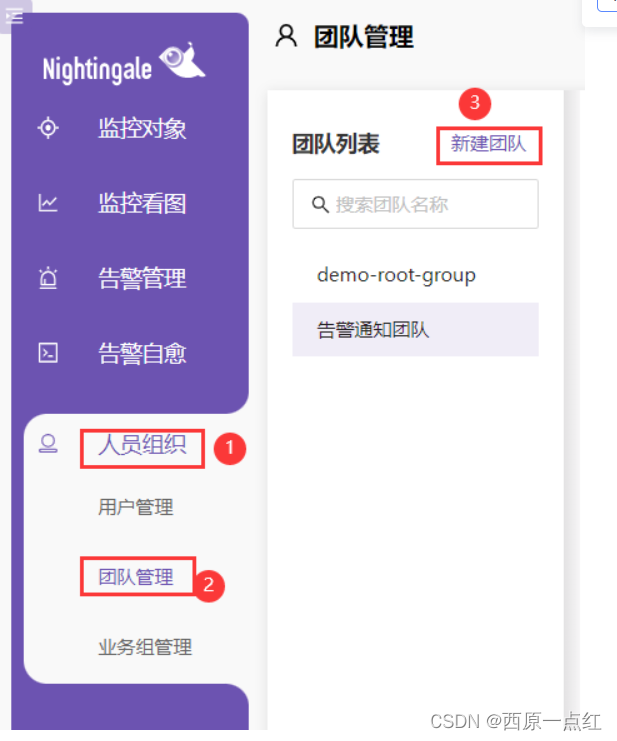
将告警用户加入告警团队
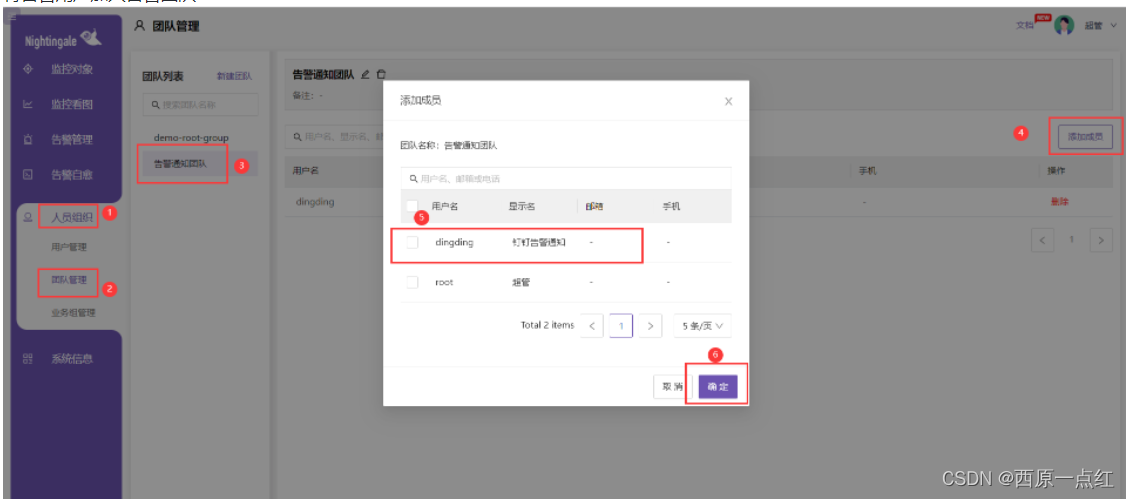
2.4 告警规则添加告警团队
[告警管理]→[告警规则]→[编辑]
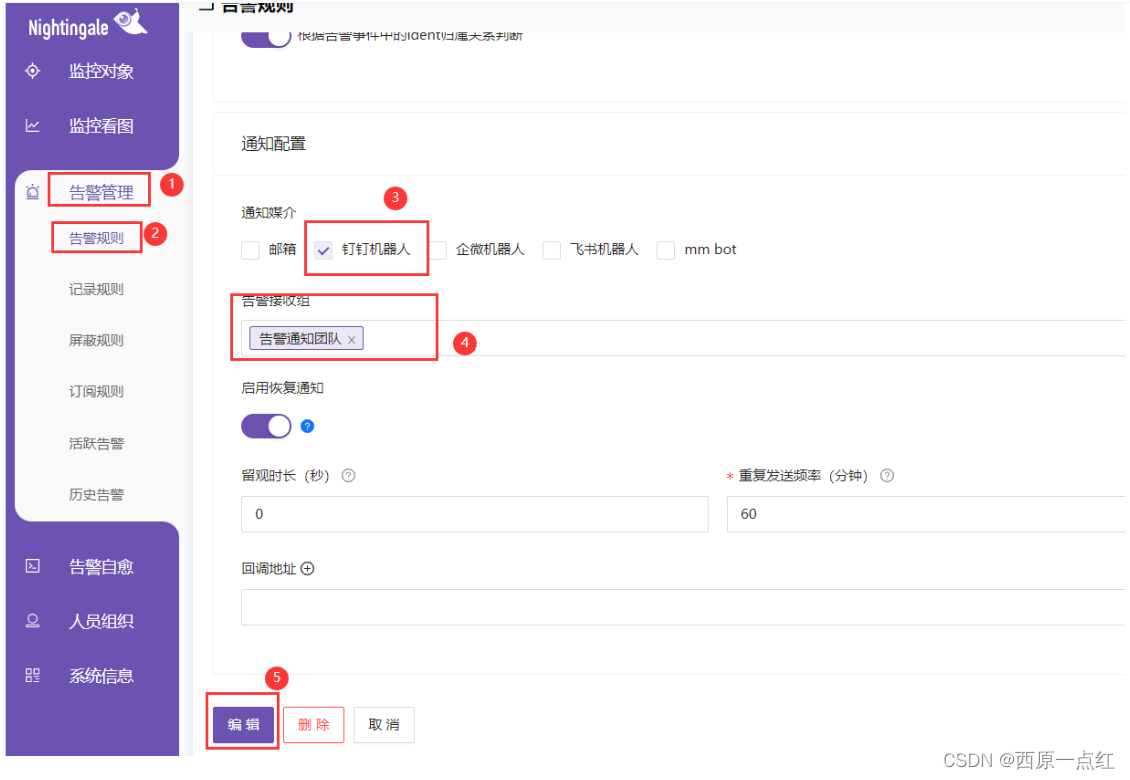
2.5 通知模板自定义
夜莺配了默认的钉钉消息模板,模板路径:etc/template/dingtalk.tpl
基本上能够明确告警信息,模板为markdown语法编写,内容如下:
#### {{if .IsRecovered}}<font color="#008800">S{{.Severity}} - Recovered - {{.RuleName}}</font>{{else}}<font color="#FF0000">S{{.Severity}} - Triggered - {{.RuleName}}</font>{{end}}

---

- **规则标题**: {{.RuleName}}{{if .RuleNote}}
- **规则备注**: {{.RuleNote}}{{end}}
- **监控指标**: {{.TagsJSON}}
- {{if .IsRecovered}}**恢复时间**:{{timeformat .LastEvalTime}}{{else}}**触发时间**: {{timeformat .TriggerTime}}
- **触发时值**: {{.TriggerValue}}{{end}}
- **发送时间**: {{timestamp}}
如需根据业务自定义模板,建议仔细阅读本文档【安装配置】-
【服务端】-【配置】-【alert_cur_event.go】,添加所需要告警的字段到dingtalk.tpl。
ps:了解告警配置,掌握基本markdown语法,该模板随意编写
这里我自定义了一个模板,如下:
## {{if .IsRecovered}}<font color="#008800">【恢复】:👉{{.RuleName}}👈 已恢复正常!</font>{{else}}<font color="#FF0000">【故障】:{{.RuleName}}</font>{{end}}
---
>- **告警标题**: {{.RuleName}}{{if .RuleNote}}
>- **告警备注**: {{.RuleNote}}{{end}}
>- **告警级别**: {{.Severity}}
---
>- **告警设备**: {{.TargetIdent}}
>- **设备所属**: {{.GroupName}}
---
>- **监控指标**: {{.PromQl}}
>- **告警说明**: {{.TagsJSON}}
---
>- {{if .IsRecovered}}**恢复时间**:{{timeformat .LastEvalTime}}
>- **恢复时值**: {{.TriggerValue}}{{else}}**触发时间**: {{timeformat .TriggerTime}}
>- **触发时值**: {{.TriggerValue}}
>- **持续时间**: {{.PromForDuration}}{{end}}
---
>- **发送时间**: {{timestamp}}
---
- **详情请戳**👉:[**告警规则**](http://IP:18000/alert-rules/edit/{{.RuleId}}) [**告警详情**](http://IP:18000/alert-his-events/{{.Id}})
效果如下:
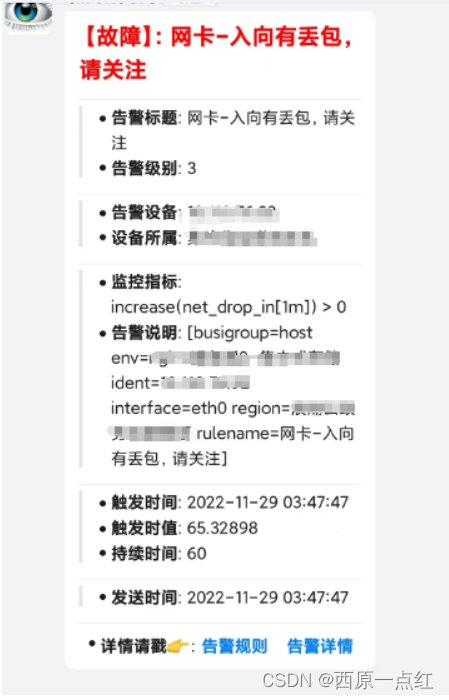
附录
接入多个Prometheus集群
由于Prometheus没有集群版本,受限于容量问题,很多公司会搭建多套Prometheus,比如按照业务拆分,不同的业务使用不同的Prometheus集群,或者按照地域拆分,不同的地域使用不同的Prometheus集群。这里是以Prometheus来举例,VictoriaMetrics、M3DB都有集群版本,不过有时为了不相互干扰和地域网络问题,也会拆成多个集群。对于多集群的协同,需要在夜莺里做一些配置,回顾一下夜莺的架构图:
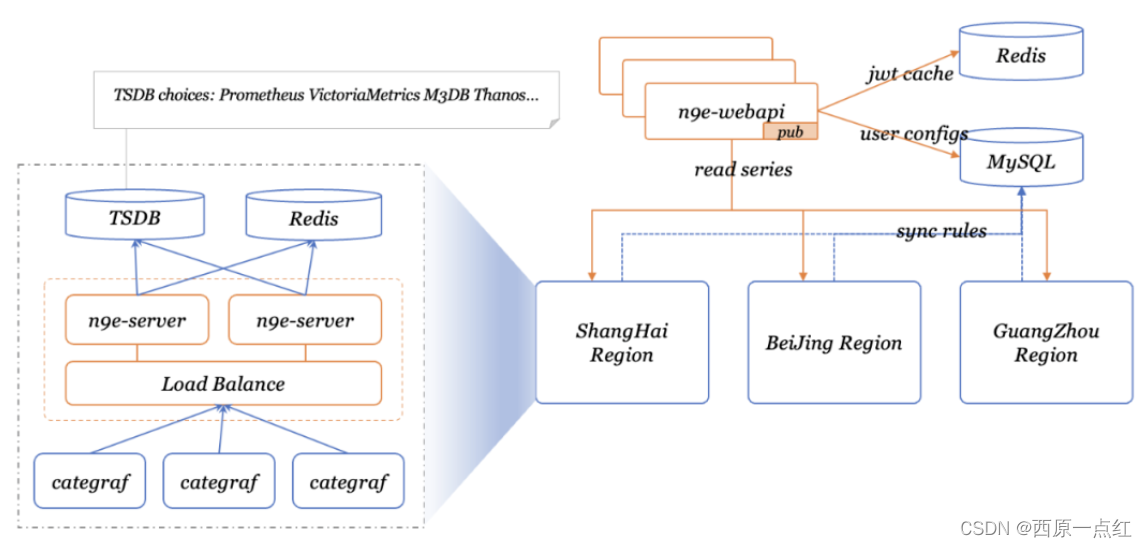
-
❗ 图上分了3个地区每个地区一套时序库,每个地区一套 n9e-server,n9e-server 依赖 redis,所以每个地区一个 redis,n9e-webapi和mysql放到中心,n9e-webapi也依赖一个 redis,所以中心端放置的是n9e-webapi、redis、mysql,如果想图省事,redis也是可以复用的,各个地区的n9e-server 都连接中心的redis也是可以的。
-
❗ 为了高可用,各个地区的n9e-server 可以多部署几个实例组成一个集群,集群中的所有n9e-server 的配置文件server.conf中的ClusterName要设置成一样的字符串。
-
❗ 假设,我们有两个时序库,在重庆搭建了一个 Prometheus,在阿里云搭建了一个Prometheus,n9e-webapi 会把这两个时序库作为数据源,所以在服务端n9e-webapi 的配置文件中,要配置上这俩存储的地址,举例:
# 重庆Prometheus集群数据源配置
[[Clusters]]
# cluster name
Name = "Prom-chongqing"
# Prometheus APIs base url
Prom = "http://重庆Prometheus-api-ip:9090"
# Basic auth username
BasicAuthUser = ""
# Basic auth password
BasicAuthPass = ""
# timeout settings, unit: ms
Timeout = 30000
DialTimeout = 10000
TLSHandshakeTimeout = 30000
ExpectContinueTimeout = 1000
IdleConnTimeout = 90000
# time duration, unit: ms
KeepAlive = 30000
MaxConnsPerHost = 0
MaxIdleConns = 100
MaxIdleConnsPerHost = 100

# 阿里云Prometheus集群数据源配置
[[Clusters]]
# cluster name
Name = "Prom-chongqing"
# Prometheus APIs base url
Prom = "http://阿里云Prometheus-api-ip:9090"
# Basic auth username
BasicAuthUser = ""
# Basic auth password
BasicAuthPass = ""
# timeout settings, unit: ms
Timeout = 30000
DialTimeout = 10000
TLSHandshakeTimeout = 30000
ExpectContinueTimeout = 1000
IdleConnTimeout = 90000
# time duration, unit: ms
KeepAlive = 30000
MaxConnsPerHost = 0
MaxIdleConns = 100
MaxIdleConnsPerHost = 100
- ❗ 另外从架构图上也可以看出,一个n9e-server对应一个时序库,所以在n9e-server的配置文件中,也需要配置对应的时序库的地址,比如重庆的server,配置如下,Writers 下面的 Url 配置的是远程写入的地址,而 Reader 下面配置的 Url 是实现Prometheus 原生查询接口的 BaseUrl。
配置详情可查看本文档【安装配置】-【配置】-【Nightingale】-【server.conf】【webapi.conf】
[Reader]
# prometheus base url
Url = "http://重庆-prometheus-base-ip:9090"
# Basic auth username
BasicAuthUser = ""
# Basic auth password
BasicAuthPass = ""
# timeout settings, unit: ms
Timeout = 30000
DialTimeout = 3000
MaxIdleConnsPerHost = 100

[WriterOpt]
# queue channel count
QueueCount = 1000
# queue max size
QueueMaxSize = 1000000
# once pop samples number from queue
QueuePopSize = 1000
# metric or ident
ShardingKey = "ident"

[[Writers]]
Url = "http://重庆-prometheus-api-ip:9090/api/v1/write"
# Basic auth username
BasicAuthUser = ""
# Basic auth password
BasicAuthPass = ""
# timeout settings, unit: ms
Timeout = 10000
DialTimeout = 3000
TLSHandshakeTimeout = 30000
ExpectContinueTimeout = 1000
IdleConnTimeout = 90000
# time duration, unit: ms
KeepAlive = 30000
MaxConnsPerHost = 0
MaxIdleConns = 100
MaxIdleConnsPerHost = 100
注意事项:
n9e-webapi 是要响应前端 ajax 请求的,前端会从 n9e-webapi 查询监控数据,n9e-webapi自身不存储监控数据,而是仅仅做了一个代理,把请求代理给后端的时序库,前端读取数据时会调用 Prometheus 的那些原生接口,即:/api/v1/query /api/v1/query_range /api/v1/labels 这种接口,所以注意,n9e-webapi 中配置的 Clusters 下面的Url,都是要支持Prometheus 原生接口的 BaseUrl。
对于 n9e-server,有两个重要作用,一个是接收监控数据,然后转发给后端多个Writer,所以Writer可以配置多个,配置文件是toml格式
,[[Writers]]双中括号这种就表示数组,数据写给后端存储,走的协议是 Prometheus 的 Remote Write,所以,所有支持 Remote Write的存储,都可以使用。n9e-server 的另一个重要作用,是做告警判断,会周期性从 mysql 同步告警规则,然后根据用户配置的 PromQL 调用时序库的 query 接口,所以 n9e-server 的 Reader 下面的 Url,也是要配置支持 Prometheus 原生接口的 BaseUrl。
另外注意,Writer 可以配置多个,但是 Reader 只能配置一个。
比如监控数据可以写一份到Prometheus存储近期数据用于告警判断,再写一份到OpenTSDB存储长期数据,Writer就可以配置为Prometheus和OpenTSDB这两个,而Reader只配置Prometheus 即可。
分布式部署方案
一、中心集群部署方案
基础环境 redis、mysql、prometheus(M3DB或VictoriaMetrics)高可用部署
假设我们有3台机器,部署方案就是在每台机器上分别部署server和webapi模块,然后在server和webapi前面分别配置负载均衡
server的负载均衡地址暴露给agent,agent用来推送监控数据,webapi的负载均衡地址可以配置一个域名,让终端用户通过域名访问夜莺的UI。此时,前端静态资源文件是由n9e-webapi来serve,也可以搭配一个小的nginx集群,把webapi作为nginx的upstream,前端静态资源文件由nginx来serve。
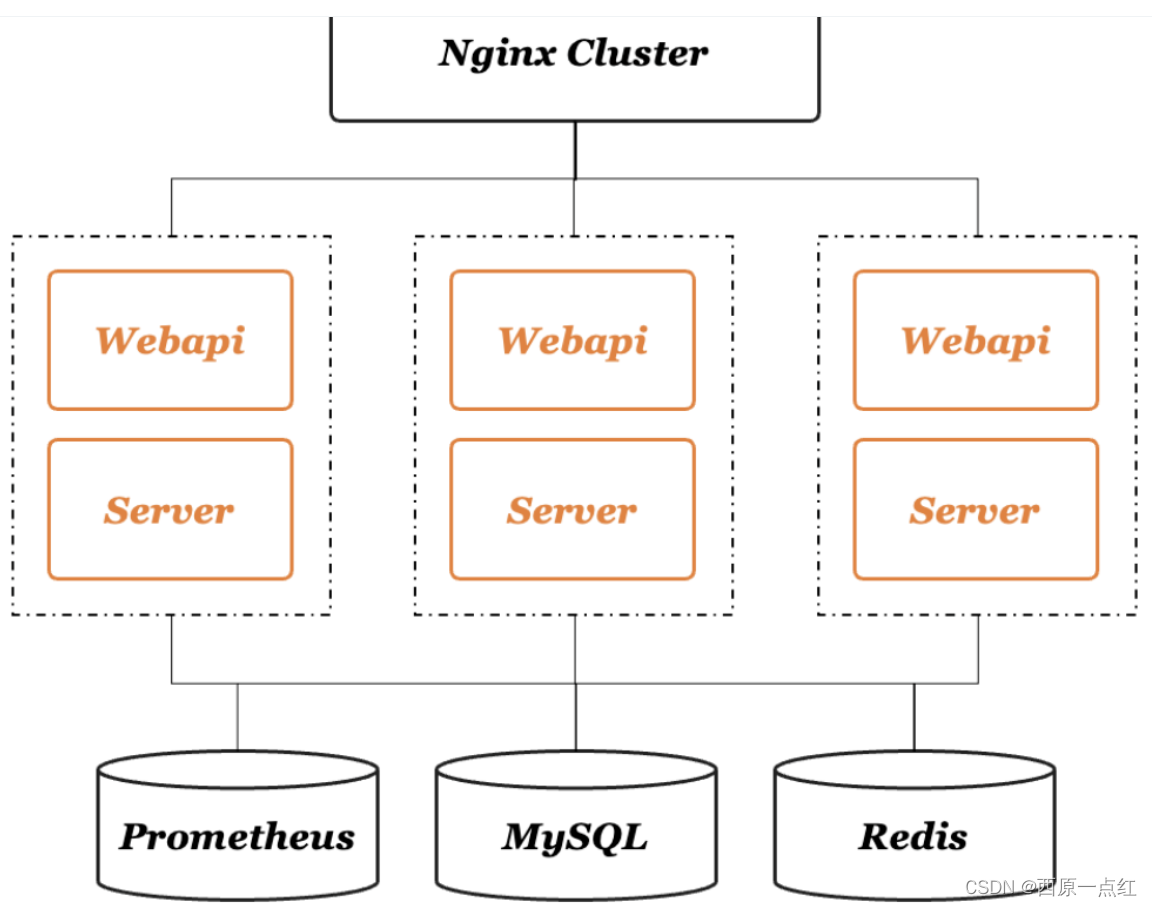
二、多地域拆分方案
实际工作环境下,很多公司会把 Prometheus 拆成多个集群,按照业务线或者按照地域来拆分,此时就相当于夜莺接入多个 Prometheus 数据源。中心端部署 webapi 模块,而 server 模块是随着时序库走的,所以,时序库在哪个机器上,server 模块就部署在哪个机器上就好,架构图如下:
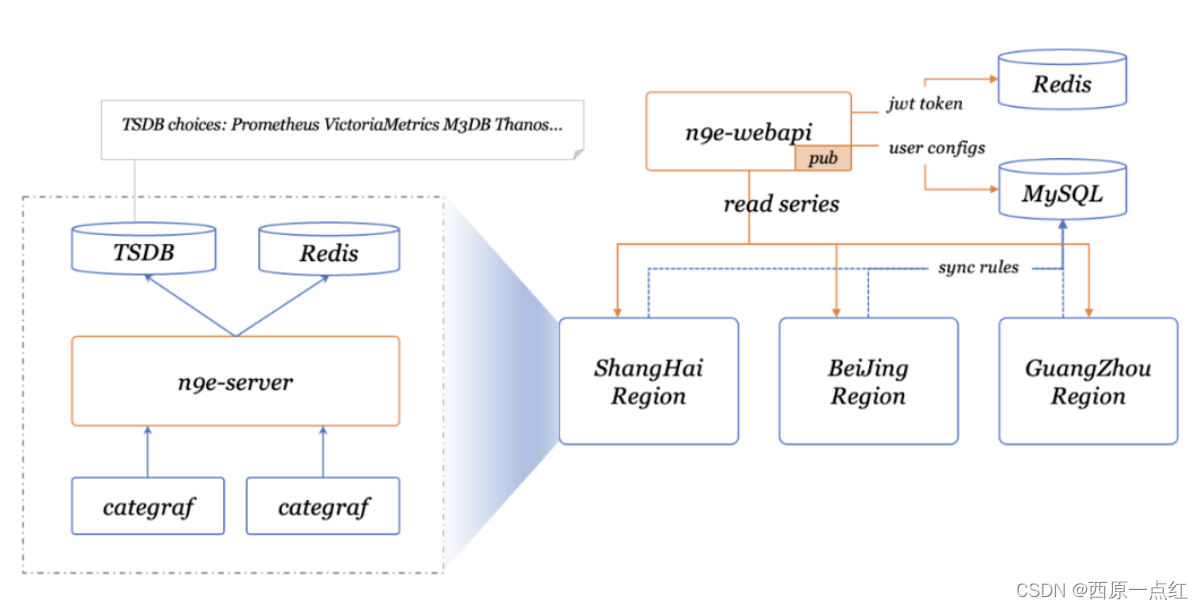
三、多地域拆分集群方案
把 server 和 webapi 模块都做集群高可用,及官方架构图:
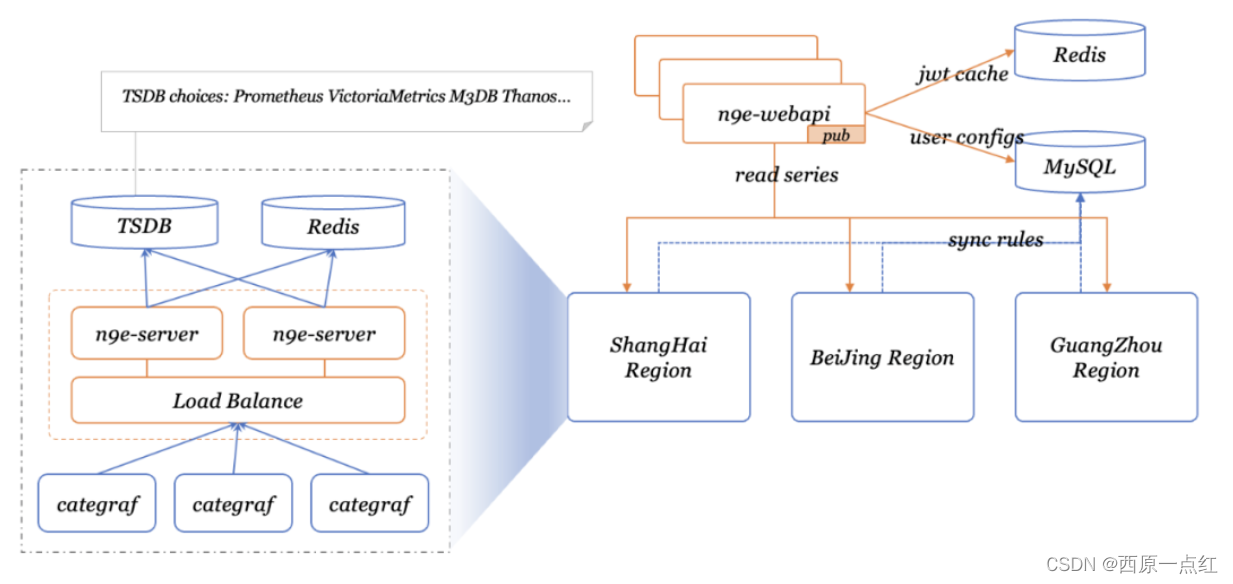
中心端是 webapi 集群、redis、mysql,每个地域是时序库、redis、server集群,redis实际可以复用中心的那个,但是不推荐,担心网络链路可能不好影响通信,最好是和 server 集群放到一个地域。
客户端(Categraf采集器)
安装配置
1. 安装
项目地址:https://github.com/flashcatcloud/categraf安装包下载地址:https://github.com/flashcatcloud/categraf/releases/
mkdir -p /categraf && cd /categraf
wget -c https://github.com/flashcatcloud/categraf/releases/download/v0.2.22/categraf-v0.2.22-linux-amd64.tar.gz
tar -zxvf categraf-v0.2.22-linux-amd64.tar.gz  && rm -f categraf-v0.2.22-linux-amd64.tar.gz
mv   categraf-v0.2.22-linux-amd64/*   . && rm -rf categraf-v0.2.22-linux-amd64
cat <<EOF >/etc/systemd/system/categraf.service
[Unit]
Description="Categraf"
After=network.target

[Service]
User=zwyuser
Type=simple

ExecStart=/categraf/categraf
WorkingDirectory=/categraf

Restart=on-failure
SuccessExitStatus=0
LimitNOFILE=65536
StandardOutput=syslog
StandardError=syslog
SyslogIdentifier=categraf


[Install]
WantedBy=multi-user.target

EOF

systemctl daemon-reload
systemctl enable categraf.service
systemctl restart categraf.service
systemctl status categraf.service
2. 配置说明
配置文件路径:/categraf/conf/config.toml
[global]
# 启动的时候是否在stdout中打印配置内容
print_configs = false

# 机器名,作为本机的唯一标识,会为时序数据自动附加一个 agent_hostname=$hostname 的标签
# hostname 配置如果为空,自动取本机的机器名
# hostname 配置如果不为空,就使用用户配置的内容作为hostname
# 用户配置的hostname字符串中,可以包含变量,目前支持两个变量,
# $hostname 和 $ip,如果字符串中出现这两个变量,就会自动替换
# $hostname 自动替换为本机机器名,$ip 自动替换为本机IP
# 建议大家使用 --test 做一下测试,看看输出的内容是否符合预期
hostname = ""

# 是否忽略主机名的标签,如果设置为true,时序数据中就不会自动附加agent_hostname=$hostname 的标签
omit_hostname = false

# 时序数据的时间戳使用ms还是s,默认是ms,是因为remote write协议使用ms作为时间戳的单位
precision = "ms"

# 全局采集频率,15秒采集一次
interval = 15

# 全局附加标签,一行一个,这些写的标签会自动附到时序数据上
[global.labels]
region = "重庆"
env = "监控服务器"

# 发给后端的时序数据,会先被扔到 categraf 内存队列里,每个采集插件一个队列
# chan_size 定义了队列最大长度
# batch 是每次从队列中取多少条,发送给后端backend
[writer_opt]
# default: 2000
batch = 2000
# channel(as queue) size
chan_size = 10000

# 后端backend配置,在toml中 [[]] 表示数组,所以可以配置多个writer
# 每个writer可以有不同的url,不同的basic auth信息
[[writers]]
url = "http://127.0.0.1:19000/prometheus/v1/write"

# Basic auth username
basic_auth_user = ""

# Basic auth password
basic_auth_pass = ""

# timeout settings, unit: ms
timeout = 5000
dial_timeout = 2500
max_idle_conns_per_host = 100


 3952
3952

 被折叠的 条评论
为什么被折叠?
被折叠的 条评论
为什么被折叠?
 到【灌水乐园】发言


