


 本文详细介绍了OpenCV中的图像二值化技术,包括全局阈值和自适应阈值函数cv2.threshold()与cv2.adaptiveThreshold()的应用。通过实例展示了不同阈值类型的图像效果,并提供了批量图像二值化的代码实现。自适应阈值适用于图像亮度不均匀的情况,能提供更好的分割效果。
二值化含义:一幅图像包括目标物体、背景还有噪声,要想从多值的数字图像中直接提取出目标物体,常用的方法就是设定一个阈值T,用T将图像的数据分成两部分:大于T的像素群和小于T的像素群。这是研究灰度变换的最特殊的方法,称为图像的二值化(Binarization)。
常用的阈值函数有两个:全局阈值 和 自适应阈值
- cv2.threshold(src, thresh, maxval, type)
- cv2.adaptiveThreshold(src, maxValue, adaptiveMethod, thresholdType, blockSize, C, dst=None)
1. cv2.threshold()函数
cv2.threshold(src, thresh, maxval, type)函数讲解
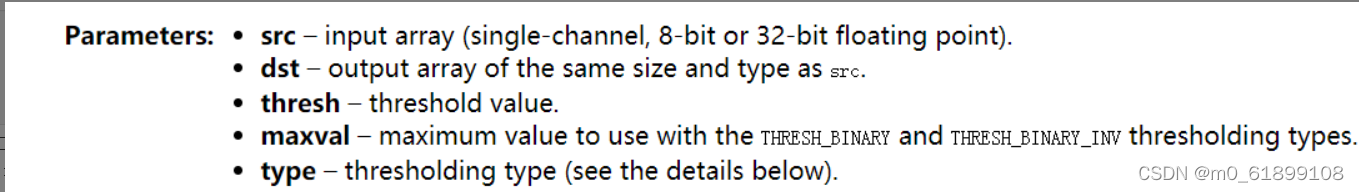
参数含义:
| 参数 | 描述 | 返回 |
|---|---|---|
| src | 源图片,必须是单通道,即灰度图 | 返回两个值:阈值、二值图 |
| thresh | 用于对像素值进行分类的阈值,取值范围0~255 | |
| maxval | 填充色,如果像素值大于(有时小于)阈值则要给出的值,取值范围0~255 | |
| type | 阈值类型 |
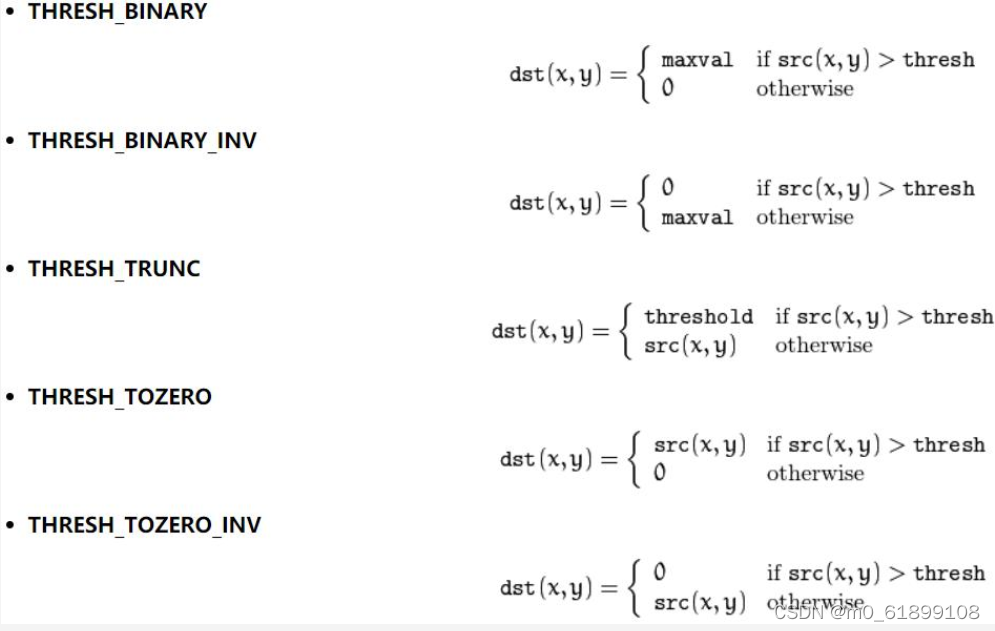
阈值类型表:
| 阈值 | 用数字表示 | 小于阈值的像素点 | 大于阈值的像素点 |
|---|---|---|---|
| cv2.THRESH_BINARY | 0 | 置0 | 置填充色maxval |
| cv2.THRESH_BINARY_INV | 1 | 置填充色maxval | 置0 |
| cv2.THRESH_TRUNC | 2 | 保持原色 | 置灰色 |
| cv2.THRESH_TOZERO | 3 | 置0 | 保持原色 |
| cv2.THRESH_TOZERO_INV | 4 | 保持原色 | 置0 |
函数式:
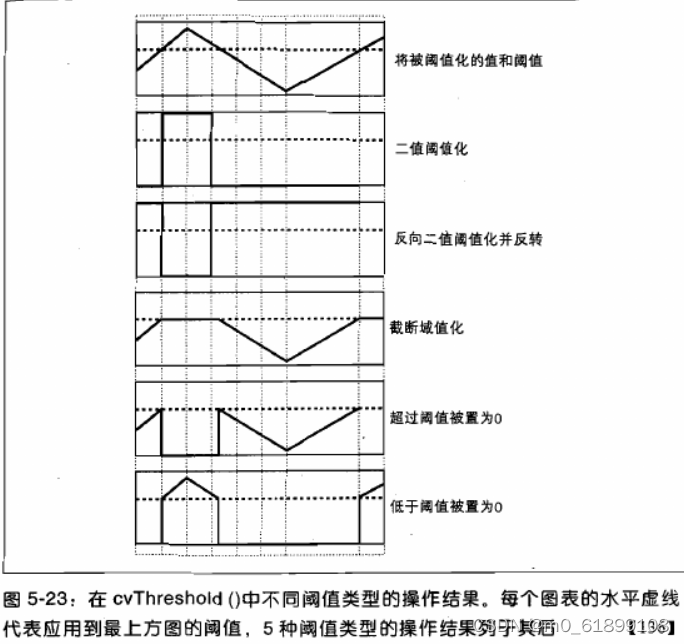
形象化:
python代码&效果图
import cv2
import numpy as np
from matplotlib import pyplot as plt
img=cv2.imread('123.jpg')
GrayImage=cv2.cvtColor(img,cv2.COLOR_BGR2GRAY)
ret,thresh1=cv2.threshold(GrayImage,127,255,cv2.THRESH_BINARY)
ret,thresh2=cv2.threshold(GrayImage,127,255,cv2.THRESH_BINARY_INV)
ret,thresh3=cv2.threshold(GrayImage,127,255,cv2.THRESH_TRUNC)
ret,thresh4=cv2.threshold(GrayImage,127,255,cv2.THRESH_TOZERO)
ret,thresh5=cv2.threshold(GrayImage,127,255,cv2.THRESH_TOZERO_INV)
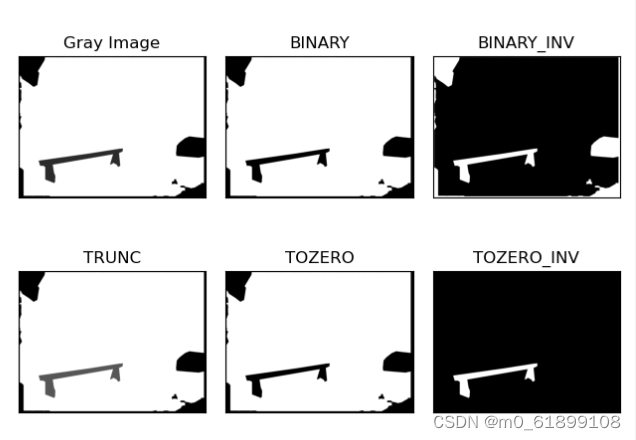
titles = ['Gray Image','BINARY','BINARY_INV','TRUNC','TOZERO','TOZERO_INV']
images = [GrayImage, thresh1, thresh2, thresh3, thresh4, thresh5]
for i in xrange(6):
plt.subplot(2,3,i+1),plt.imshow(images[i],'gray')
plt.title(titles[i])
plt.xticks([]),plt.yticks([])
plt.show()效果:
2. 单张图像二值化
代码:
import cv2
img = cv2.imread("001.png")
print(img)
# 先进行灰度化处理,再进行二值化
Grayimg = cv2.cvtColor(img, cv2.COLOR_BGR2GRAY)
# 127是二值化阈值,大于255的像素值都置为0
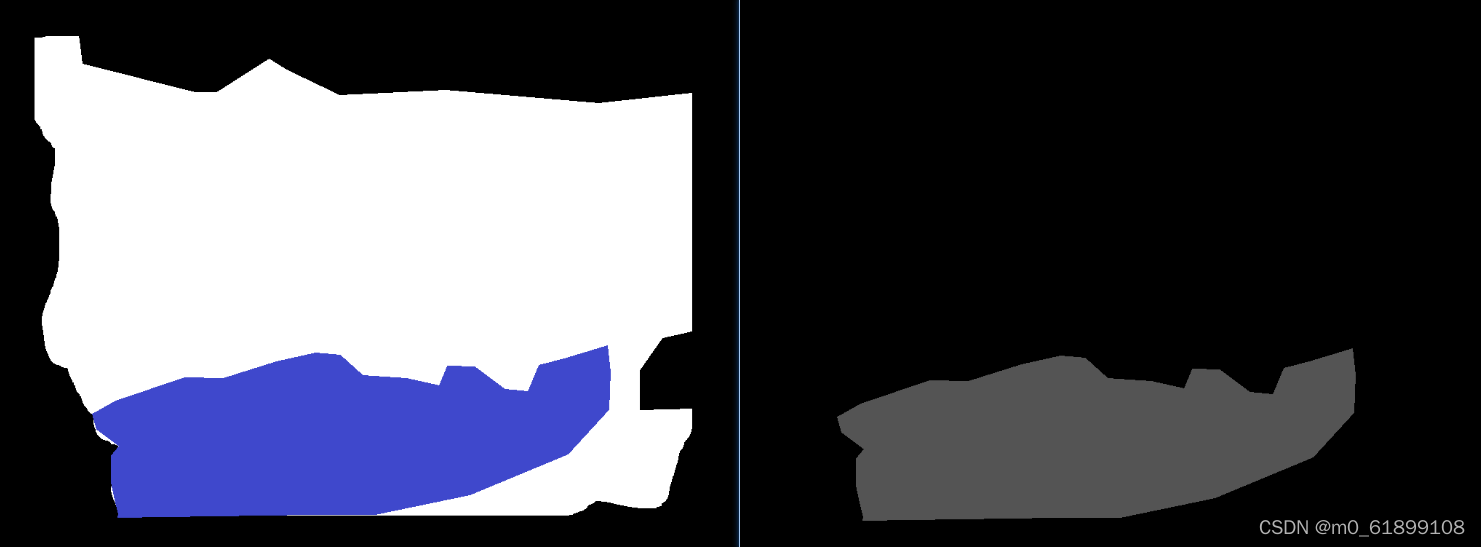
ret, thresh = cv2.threshold(Grayimg, 127, 255, cv2.THRESH_TOZERO_INV)
cv2.imwrite('0001.png', thresh)效果(左图为原图,右图为二值化图) :
3. 批量图像二值化
代码:
def binarization():
# 获取目录下所有图片名
filename = os.listdir(r"F:\python_Demo\DeepLearning\tools3\shapes\cmutestGT")
print(filename)
# os.listdir() 方法用于返回指定的文件夹包含的文件或文件夹的名字的列表。
base_dir = r"F:\python_Demo\DeepLearning\tools3\shapes\CmutestGT" # input
new_dir = r"F:\python_Demo\DeepLearning\tools3\shapes\GT1" #output
for img in filename:
name = img
path1= os.path.join(base_dir,img)
img = cv2.imread(path1)
# print(img)
Grayimg = cv2.cvtColor(img, cv2.COLOR_BGR2GRAY)
ret, thresh = cv2.threshold(Grayimg, 250, 255,cv2.THRESH_TOZERO_INV)
cv2.imwrite('img.png', thresh)
image = Image.open('img.png')
# 有需要可对图像进行大小调整
#image = image.resize((350, 350),Image.ANTIALIAS)
path= os.path.join(new_dir,name)
image.save(path)
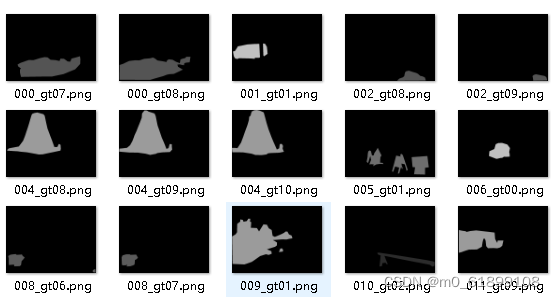
binarization()效果:
4. cv2.adaptiveThreshold()函数
全局阈值只需要规定一个阈值值,整个图像都和这个阈值比较。
自适应阈值可以看成一种局部性的阈值,通过规定一个区域大小,比较这个点与区域大小里面像素点的平均值(或者其他特征)的大小关系确定这个像素点是属于黑或者白(如果是二值情况)。
当同一幅图像上的不同部分的具有不同亮度时,采用自适应阈值。此时的阈值是根据图像上的每一个小区域计算与其对应的阈值。从而可以在亮度不同的情况下得到更好的结果。
cv2.adaptiveThreshold(src, maxValue, adaptiveMethod, thresholdType, blockSize, C, dst=None)函数讲解
参数含义:
| 参数 | 描述 | 返回 |
|---|---|---|
| src | 源图像,灰度图 | 返回两个值:阈值、二值图 |
| maxValue | 填充色,0-255 | |
| adaptiveMethod | 自适应阈值方法 | |
| thresholdType | 阈值类型 | |
| blockSize | 领域大小,取奇数 | |
| C | 阈值计算的常数项 | |
| dst | 输出图,可忽略 |
adaptiveMethod:
| 自适应方法 | 解释 | 计算 |
|---|---|---|
| cv2.ADPTIVE_THRESH_MEAN_C | 为局部邻域块的平均值。阈值取自相邻区域的平均值 | 先求块的均值,再减去常数项C |
| cv2.ADPTIVE_THRESH_GAUSSIAN_C | 为局部邻域块的高斯加权和。阈值取值相邻区域的加权和,权重为一个高斯窗口 | 先求块的加权和,再减去常数项C |
thresholdType:
| 阈值 | 用数字表示 | 小于阈值的像素点 | 大于阈值的像素点 |
|---|---|---|---|
| cv2.THRESH_BINARY | 0 | 置0 | 置填充色maxval |
| cv2.THRESH_BINARY_INV | 1 | 置填充色maxval | 置0 |
python代码&效果图
import cv2
import numpy as np
from matplotlib import pyplot as plt
img = cv2.imread('test.jpg', 0)
#中值滤波
img = cv2.medianBlur(img, 5)
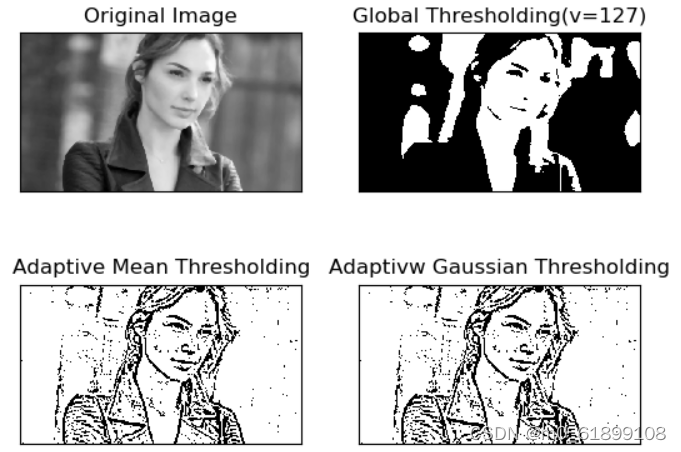
ret, th1 = cv2.threshold(img, 127, 255, cv2.THRESH_BINARY)
th2 = cv2.adaptiveThreshold(img, 255, cv2.ADAPTIVE_THRESH_GAUSSIAN_C, cv2.THRESH_BINARY, 11, 2)
th3 = cv2.adaptiveThreshold(img, 255, cv2.ADAPTIVE_THRESH_GAUSSIAN_C, cv2.THRESH_BINARY, 11, 2)
titles = ['Original Image', 'Global Thresholding(v=127)', 'Adaptive Mean Thresholding', 'Adaptivw Gaussian Thresholding']
images = [img, th1, th2, th3]
for i in range(4):
plt.subplot(2, 2, i+1), plt.imshow(images[i], 'gray')
plt.title(titles[i])
plt.xticks([]),plt.yticks([])
plt.show()效果:
参考博客
Opencv:图像二值化 cv2.threshold()_宁静致远*的博客-CSDN博客_cv2 二值化
OpenCV-Python: 用于图像二值化/去噪的cv2.threshold()函数详解 - 灰信网(软件开发博客聚合)


 被折叠的 条评论
为什么被折叠?
被折叠的 条评论
为什么被折叠?
 到【灌水乐园】发言


