


一、选题背景介绍
中国古代文化中的唐诗是一颗璀璨的明珠,代表了中华民族的文化底蕴和艺术成就。唐诗以其深邃的意境、优美的语言和丰富的情感打动了世人。然而,要阅读和欣赏大量的唐诗作品并非易事。为了让更多人能够了解、感受和研究唐诗,利用爬虫技术和数据可视化手段对唐诗进行数字化处理是一种创新而有意义的尝试。本项目旨在通过Python爬虫技术,从互联网上收集唐诗的原始数据,并利用数据可视化工具将这些数据以直观、富有艺术感的方式呈现出来。
二、主题式网络爬虫设计方案
1.主题式网络爬虫名称:唐僧三百首数据爬虫与可视化
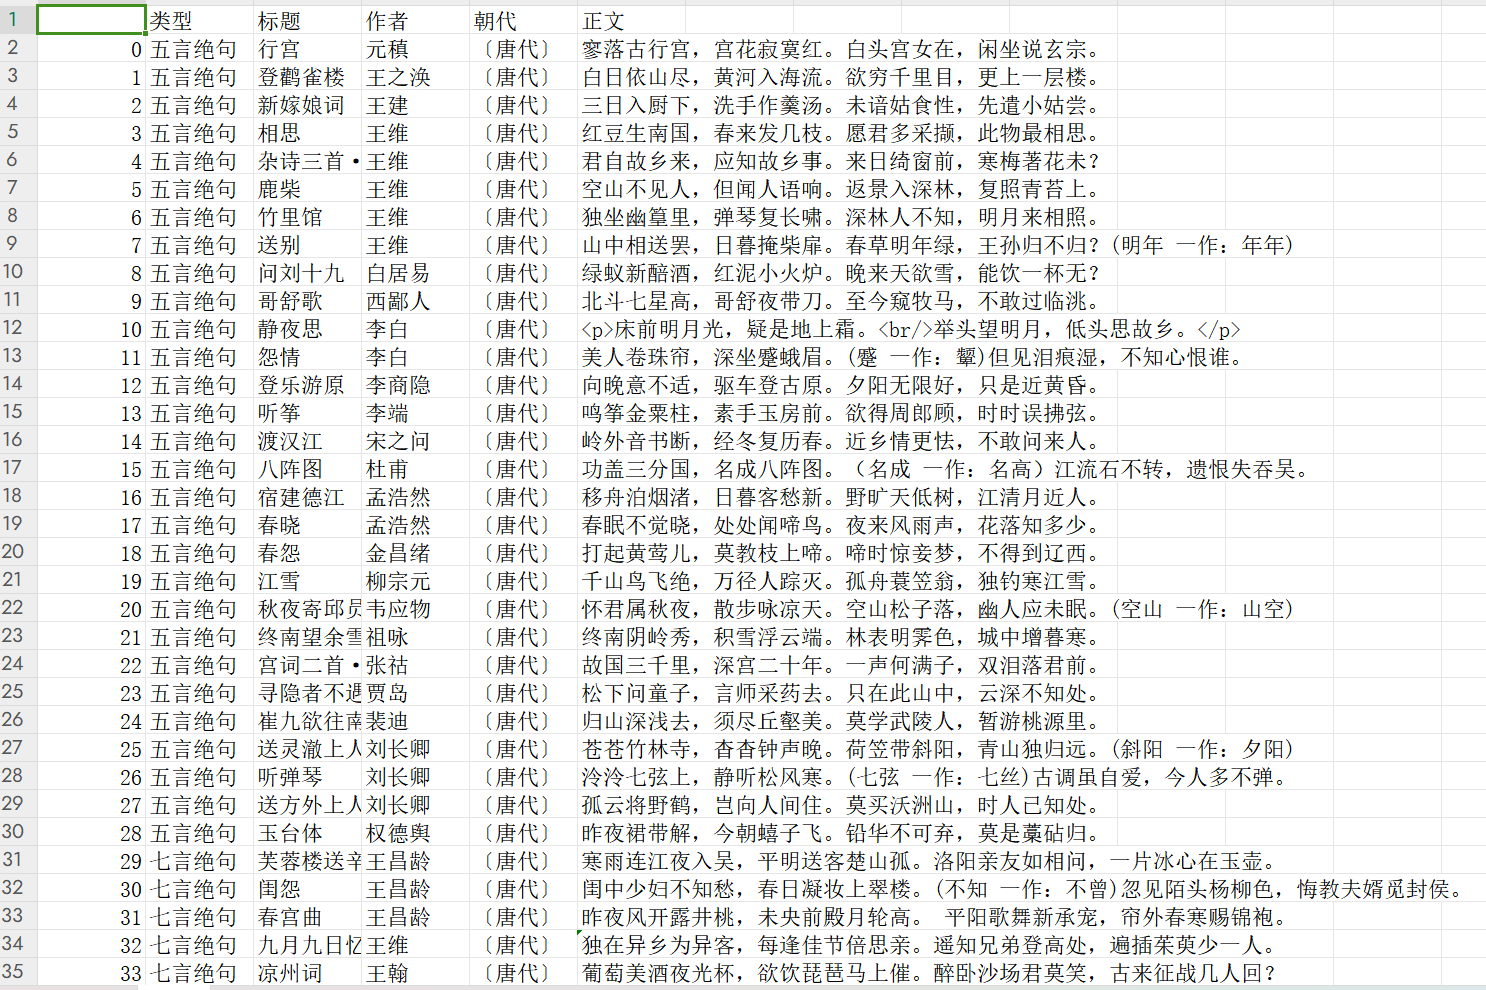
2.主题式网络爬虫爬取的内容:作者,朝代,标题,古诗类型,正文
3.主题是网络爬虫设计方案概述:从目标网址(https://so.gushiwen.cn/gushi/tangshi.aspx)上爬取唐诗三百首各个古诗的页面链接,同时存储好每一首古诗的类型,循规进入到每一首古诗的页面,爬取页面信息。分标题、作者、朝代、正文四个部分进行抓取,把抓取到的数据存储到csv文件中,读取csv文件,读取每首古诗的正文,采用jieba库进行分词,进行数据清洗(去除一些<br\>换行标签),去除停用词等,用分词后的数据绘制词云图,采用自定义词云图形状(中国地图)绘制词云图,按作者、类型等进行数据统计,并绘图进行可视化。
三、主题页面的结构特征分析
1.主题页面的结构与特征分析
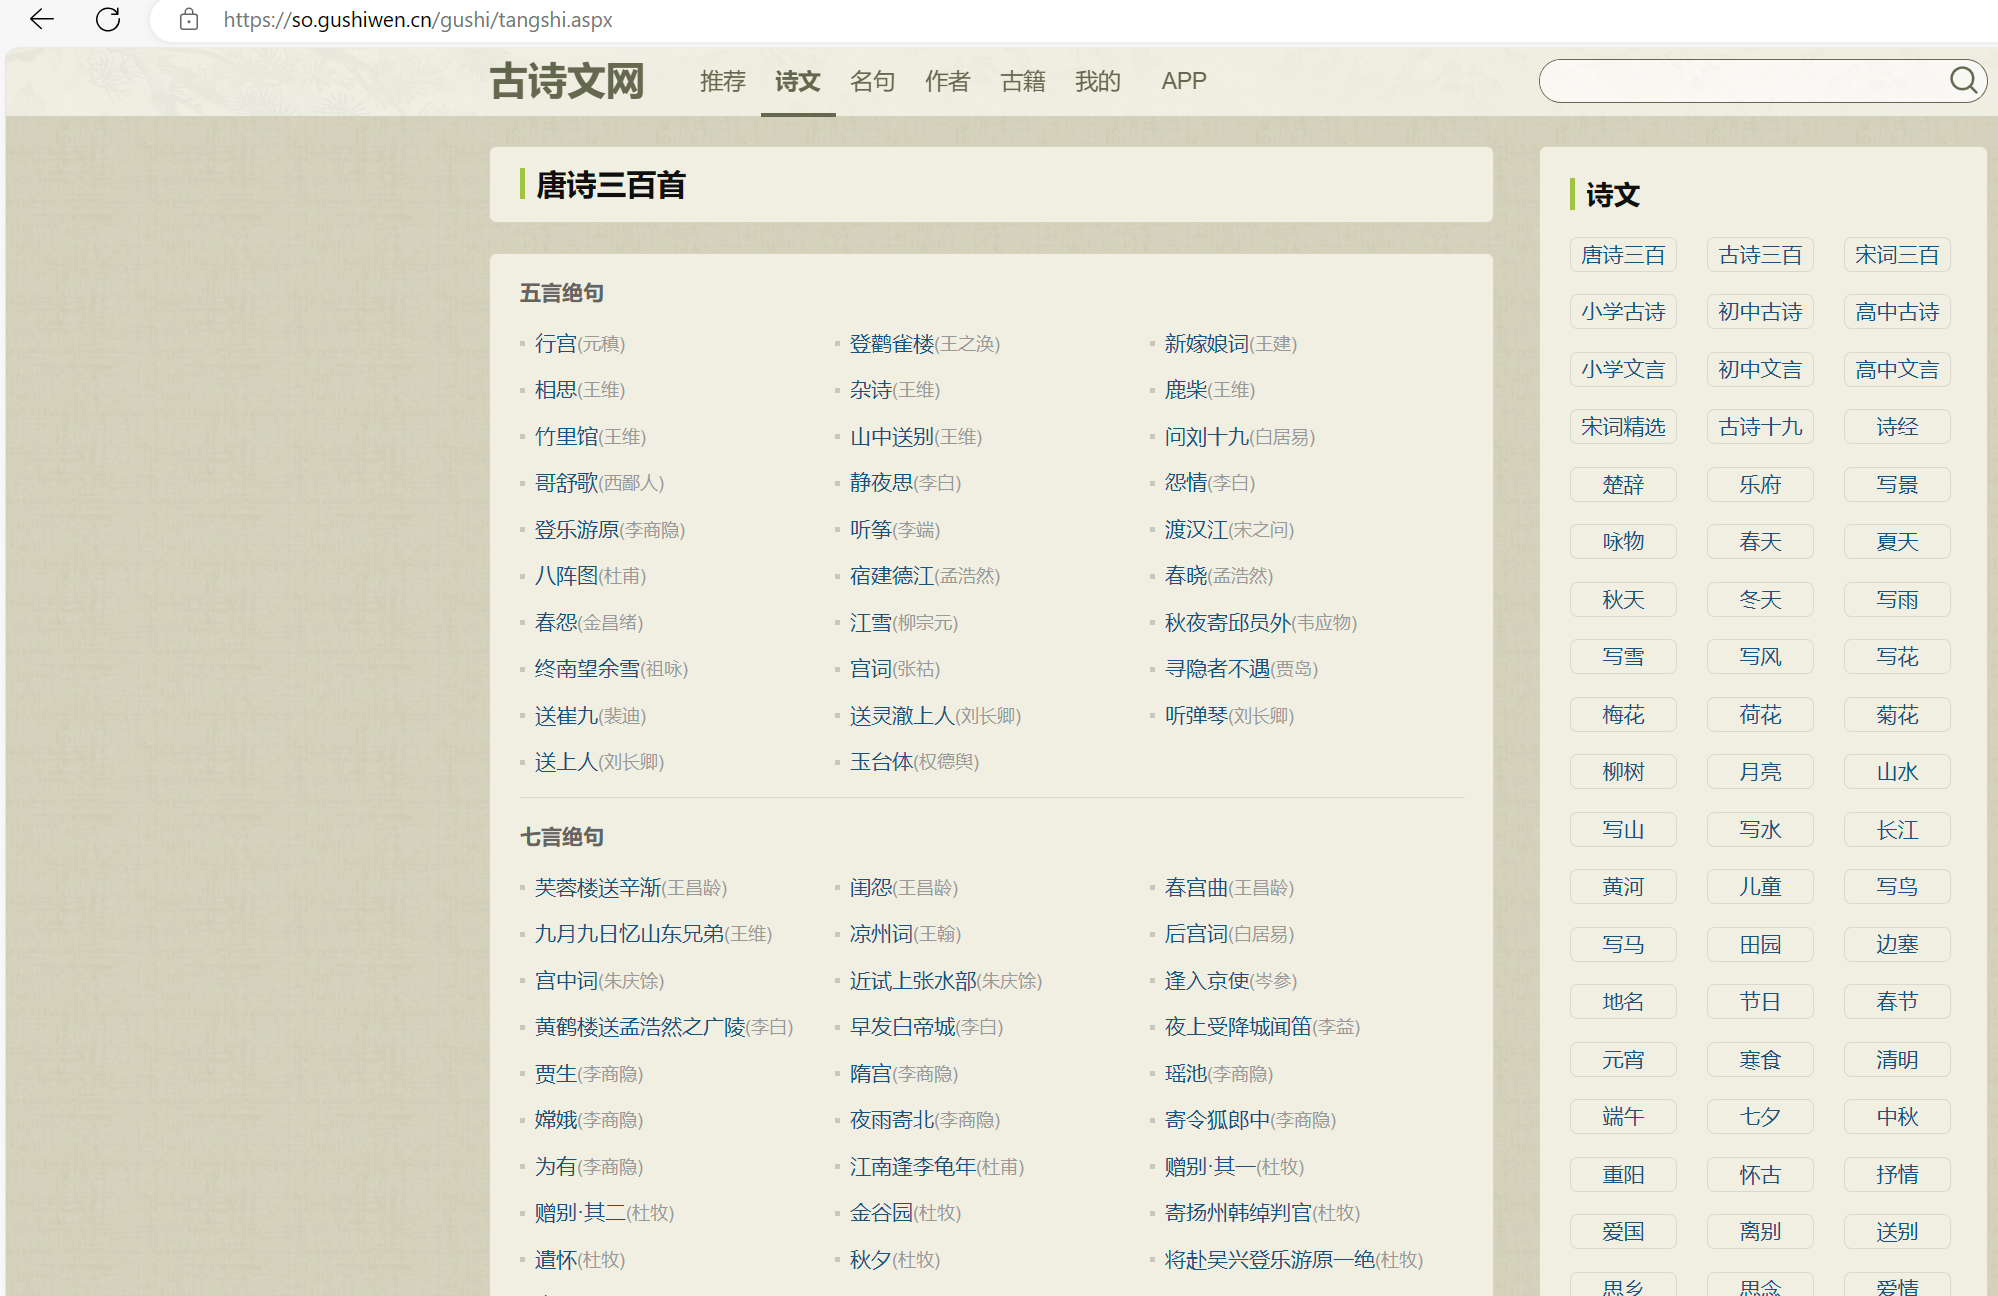
主题页面包含了各种故事的详细类型以及详细信息,详细信息包括古诗名称,古诗类型,作者,故事标题等。
四、网络爬虫程序设计
1.数据爬取与采集
'''
1. 导入所需的模块和库:
'''
import requests # 用来爬虫
from bs4 import BeautifulSoup
import numpy
from PIL import Image
import re
import pandas as pd
import jieba #分词库
from wordcloud import WordCloud #词云库
import numpy as np
from PIL import Image
import matplotlib.pyplot as plt
'''
2. 定义 get_data函数,用于爬取数据。
'''
def get_data():
# 伪请求头,伪装成浏览器
cookie = ''
fake_headers = {
'User-Agent': 'Mozilla/5.0 (Windows NT 10.0; Win64; x64) AppleWebKit/537.36 (KHTML, like Gecko) Chrome/112.0.0.0 Safari/537.36', #浏览器名称
'Referer': 'https://so.gushiwen.cn/', #来源页面的地址
'Cookie': cookie #cookie
}
#目标网址
url = "https://so.gushiwen.cn/gushi/tangshi.aspx"
# 各首唐诗的链接列表
url_list = []
#请求数据:发送请求获取目标网页内容
response = requests.get(url,headers = fake_headers) #添加headers参数
html = response.content.decode("utf-8")
# print(html.txt)
# 解析HTML
soup = BeautifulSoup(html, 'lxml')
# 解析HTML获取各个类型的诗歌,并将链接和类型分别存储在两个列表中
div_ = soup.find_all('div',class_='typecont')
type_count=[]
for i in range(0,len(div_)):
bookMl_div = div_[i].find('div',class_ ='bookMl')
strong_elm = bookMl_div.find('strong')
type = strong_elm.contents[0] #类型
span_ = div_[i].find_all('span')
for j in range(0, len(span_)):
link = span_[j].find('a')['href']
url_list.append(link)
type_count.append(type)
#创建一个空的DataFrame用于存储古诗数据
son_data = pd.DataFrame(columns=['类型','标题','作者','朝代','正文'])
# 爬取完每一首古诗的链接后,循环每一个链接爬取每一首古诗
x = 0
# 循环遍历诗歌链接列表,依次爬取每一首古诗的数据,包括标题、作者、朝代和正文,并将其存储到DataFrame中
for link in url_list:
# 请求数据
link = 'https://so.gushiwen.cn'+link
response = requests.get(link, headers=fake_headers) # 添加headers参数
html = response.content.decode("utf-8")
# print(html.txt)
type = type_count[x]
soup = BeautifulSoup(html, 'lxml')
div_ = soup.find('div',id='sonsyuanwen')
title = div_.find('h1').contents[0]
try:
# name = div_.find('p',class_='source').find_all('a')[0].find('img')['alt']
a_name = div_.find('p', class_='source').find_all('a')[0]
name = a_name.find('img')['alt']
except:
x+=1
continue
p_source = div_.find('p', class_='source')
a_time = p_source.find_all('a')[1]
time = a_time.contents[0]
# time = div_.find('p', class_='source').find_all('a')[1].contents[0]
content = div_.find('div', class_='contson').contents
text = ''
for con in content:
if(str(con)!='<br/>'):
text += str(con).replace('\n', '')
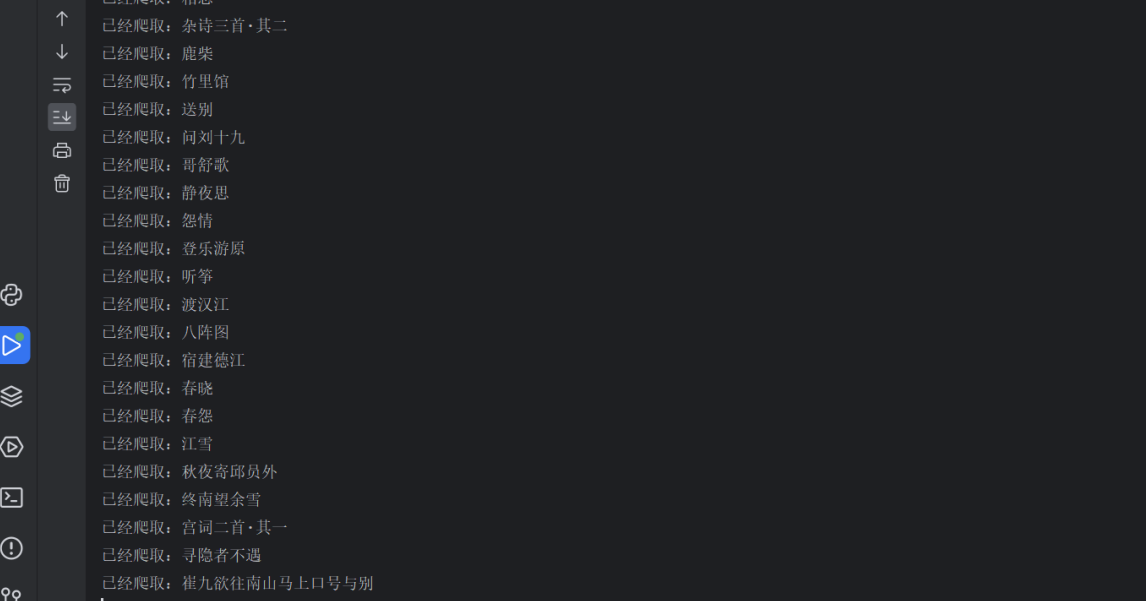
print('已经爬取:' + title) # + ",作者:" + name + ",朝代:"+time+",正文:" +text
son_data.loc[len(son_data.index)] = [type, title, name, time, text]
x+=1
son_data.to_csv('./data.csv') # 将爬取的古诗数据保存为CSV文件
2.数据清洗
def draw():
    data = pd.read_csv('./data.csv')
    # 分词
    cut_text = list(data['正文'])
    new_text = []
    all_text = ''
    for str in cut_text:
        remove_chars = '[brp·’!"\#$%&\'()#!()*+,-./:;<=>?\@,:。?¥★、….>【】[]《》?“”‘’\[\\]^_`{|}~]+'
        str = re.sub(remove_chars, "", str)
        str.replace('br','').replace('p','')
        result = jieba.cut(str)
        a = ','.join(result).split(',')
        new_text.append(a)
    for s in new_text:
        for word in s:
            all_text+=word+' '
3.数据分析与可视化
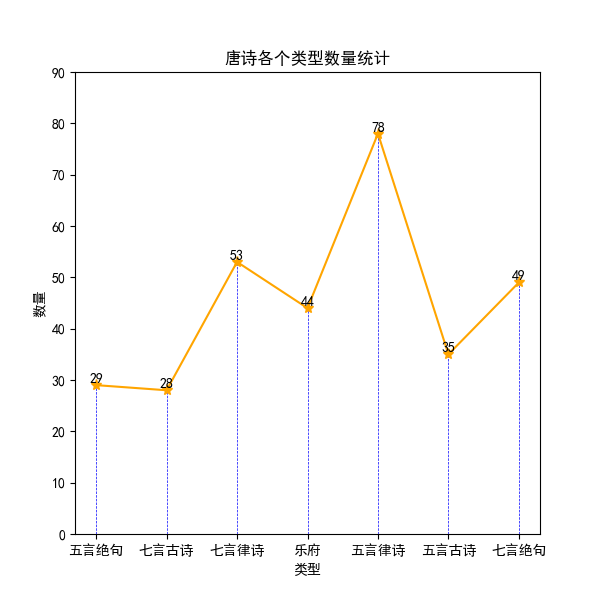
1.读取"data.csv"文件,将其转换为一个DataFrame对象。获取古诗的类型集合,并按照类型进行分组。统计每种类型古诗的数量,并存储到type_count列表中。创建一个折线图,并将古诗类型与数量作为横纵轴的坐标,绘制出图像。在图上标明数据标签和纵竖线。设置图的标题、横纵轴标签,并保存图像到"唐诗各个类型数量统计.png"文件中。
def drawPic1():
    # 类型数量折线图
    data = pd.read_csv('./data.csv')
    type_list = set(list(data['类型']))   # 获取古诗类型集合
    type_group = data.groupby(by='类型')  # 数据按类型分组
    type_count = np.linspace(0,0,len(type_list)).astype(int) # 列表:用来存各个类型的古诗数量
    index = 0
    print('【一、按类型分析:】')
    for t in type_list: # 遍历每种类型的古诗
        data_type = type_group.get_group(t)
        type_count[index] = len(data_type)  #该类型的古诗数量
        print(" " + t + ":"+ str(type_count[index])+" 首")
        index += 1
    x = np.linspace(0,len(type_list)-1,len(type_list)).astype(int)
    fig = plt.figure(figsize=(6, 6))
    ax1 = plt.subplot(1, 1, 1)
    ax1.plot(x, type_count, '-*', color='orange', linewidth=1.5, markersize='8')
    plt.xticks(x, type_list)
    # 设置数据标签
    for a, b in zip(x, type_count):
        plt.text(a, b, b, ha='center', va='bottom')
    #纵竖线
    for i in range(0,len(type_count)):
        ax1.vlines(i, 0, type_count[i], linewidth=0.5, linestyles='dashed', colors='blue')
    ax1.set_ylim((0, 90))
    ax1.set_xlabel(r'类型')
    ax1.set_ylabel(r'数量')
    ax1.set_title('唐诗各个类型数量统计')
    plt.savefig('./唐诗各个类型数量统计.png')
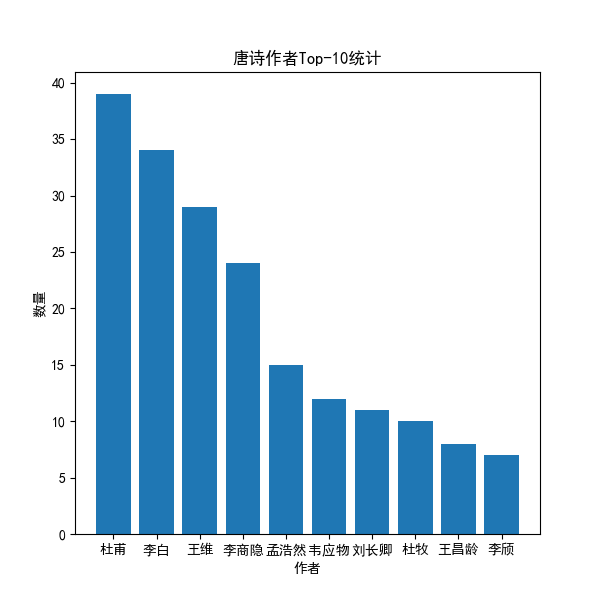
2.读取"data.csv"文件,并按照作者进行分组。统计每位作者古诗的数量,并存储到author_count列表中。创建一个柱状图,并将作者与数量作为横纵轴的坐标,绘制出图像。设置图的标题、横纵轴标签,并保存图像到"唐诗作者Top-10统计.png"文件中。
def drawPic2():
    # 作者诗数量柱状图
    data = pd.read_csv('./data.csv')
    author_list = set(list(data['作者']))  # 获取古诗捉着集合
    author_group = data.groupby(by='作者')  # 数据按作者分组
    author_count = np.linspace(0, 0, len(author_list)).astype(int)  # 列表:用来存各个作者的古诗数量
    index = 0
    # print('【二、按作者分析:】')
    for a in author_list:  # 遍历每种类型的古诗
         data_type = author_group.get_group(a)
         author_count[index] = len(data_type)  # 该类型的古诗数量
         # print(" " + a + ":" + str(author_count[index]) + " 首")
         index += 1
    author_poem = pd.DataFrame()
    author_poem['作者'] = list(author_list)
    author_poem['数量'] = list(author_count)
    author_poem = author_poem.sort_values(by='数量',ascending=False)  # 排序
    author_list = []
    author_count = []
    # 作者数量太多,只取前十
    for i in range(0,10):
        author_list.append(list(author_poem['作者'])[i])
        author_count.append(list(author_poem['数量'])[i])
    x = [0,1,2,3,4,5,6,7,8,9]
    fig = plt.figure(figsize=(6, 6))
    ax2 = plt.subplot(1, 1, 1)
    ax2.bar(x,author_count)
    plt.xticks(x, author_list)  #  rotation=-50
    ax2.set_xlabel(r'作者')
    ax2.set_ylabel(r'数量')
    ax2.set_title('唐诗作者Top-10统计')
    plt.savefig('./唐诗作者Top-10统计.png')
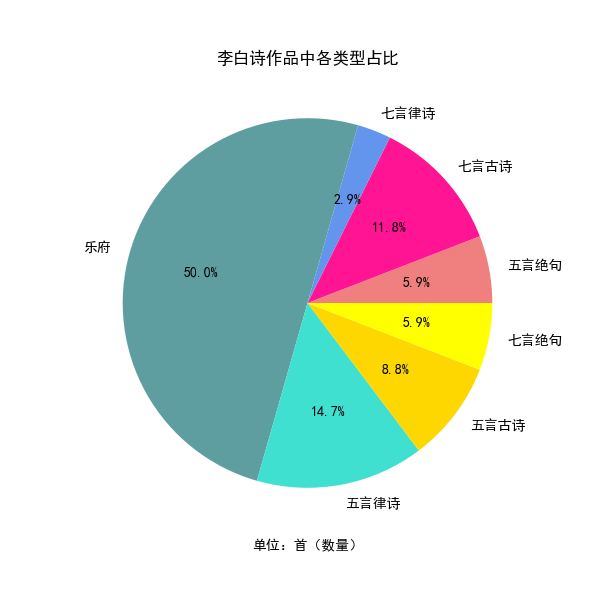
3.读取"data.csv"文件,并按照作者进行分组。获取李白的数据,并按照类型进行分组。统计李白每种类型古诗的数量,并存储到type_count列表中。创建一个扇形图,并将古诗类型与数量作为扇形的标签和大小,绘制出图像。设置图的标题和单位,并保存图像到"李白各类型的诗占比饼图.png"文件中。
def drawPic3():
    ############ 李白的诗类型扇形图
    data = pd.read_csv('./data.csv')
    author_group = data.groupby(by='作者')  # 数据按作者分组
    count = 0
    LiBai_data = author_group.get_group('李白')   # 提取出李白的数据
    type_list = set(list(LiBai_data['类型']))  # 获取古诗类型集合
    type_group = LiBai_data.groupby(by='类型')  # 数据按类型分组
    type_count = np.linspace(0, 0, len(type_list)).astype(int)  # 列表:用来存李白各个类型的古诗数量
    index = 0
    print('【一、把李白的诗,按类型统计:】')
    for t in type_list:  # 遍历每种类型的古诗
        data_type = type_group.get_group(t)
        type_count[index] = len(data_type)  # 该类型的古诗数量
        print(" " + t + ":" + str(type_count[index]) + " 首")
        index += 1
    fig = plt.figure(figsize=(6, 6))
    ax2 = plt.subplot(1, 1, 1)
    colors = ["#F08080", "#FF1493", "#6495ED", "#5F9EA0","#40E0D0","#FFD700","#FFFF00"]
    ax2.pie(type_count, labels=type_list,colors=colors,autopct='%.1f%%')
    ax2.set_xlabel('单位:首(数量)')
    ax2.set_title('李白诗作品中各类型占比')
    ax2.set_ylabel('')
    plt.savefig('./李白各类型的诗占比饼图.png')
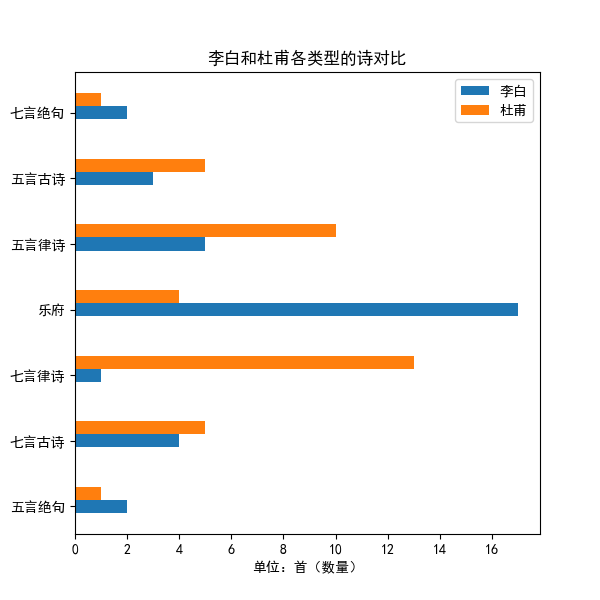
4.读取"data.csv"文件,并按照作者进行分组。获取李白和杜甫的数据,并按照类型进行分组。统计李白和杜甫每种类型古诗的数量,并存储到type_count1和type_count2列表中。创建一个图表,并将李白和杜甫的古诗类型与数量作为横纵轴的坐标,绘制出图像。
def drawPic4():
    ############ 李白的诗按类型统计
    data = pd.read_csv('./data.csv')
    type_list = set(list(data['类型']))  # 获取古诗类型集合

    author_group = data.groupby(by='作者')  # 数据按作者分组
    LiBai_data = author_group.get_group('李白')  # 提取出李白的数据
    type_list1 = type_list  # 获取古诗类型集合
    type_group1 = LiBai_data.groupby(by='类型')  # 数据按类型分组
    type_count1 = np.linspace(0, 0, len(type_list1)).astype(int)  # 列表:用来存李白各个类型的古诗数量
    index = 0
    for t in type_list1:  # 遍历每种类型的古诗
        data_type = type_group1.get_group(t)
        type_count1[index] = len(data_type)  # 该类型的古诗数量
        index += 1
    ############ 杜甫的诗按类型统计
    DuFu_data = author_group.get_group('杜甫')  # 提取出李白的数据
    type_list2 = type_list  # 获取古诗类型集合
    type_group2 = DuFu_data.groupby(by='类型')  # 数据按类型分组
    type_count2 = np.linspace(0, 0, len(type_list2)).astype(int)  # 列表:用来存杜甫各个类型的古诗数量
    index = 0
    for t in type_list2:  # 遍历每种类型的古诗
        data_type = type_group2.get_group(t)
        type_count2[index] = len(data_type)  # 该类型的古诗数量
        index += 1
    fig = plt.figure(figsize=(6, 6))
    ax3 = plt.subplot(1, 1, 1)
    y1 = list(range(len(type_list)))
    y2 = [i+0.2 for i in y1]
    ax3.barh(y1,type_count1,label='李白',height=0.2)
    ax3.barh(y2, type_count2, label='杜甫',height=0.2)
    ax3.set_xlabel('单位:首(数量)')
    ax3.set_title('李白和杜甫各类型的诗对比')
    ax3.set_ylabel('')
    plt.legend()
    plt.yticks(y1,type_list)
    plt.savefig('./李白和杜甫各类型的诗数量对比.png')
    plt.show()
5.词云图
font = "C:\\Windows\\Fonts\\simsun.ttc"  # 词云的中文字体所在路径
mask = numpy.array(Image.open('bg.png'))
wc=WordCloud(
    scale=4,  # 调整图片大小---(如果设置太小图会很模糊)
    font_path=font,  # 使用的字体库
    max_words=300,  # 词云显示的最大词数
    margin=1,  # 字体之间的间距
    mask=mask,  # 背景图片
    background_color='white',  # 背景颜色
    max_font_size=100,
    # min_font_size=1,
    # stopwords=STOPWORDS, #屏蔽的内容
    collocations=False,  # 避免重复单词
    # width=1600, height=1200  # 图像宽高,字间距
)
wc.generate(all_text)
wc.to_file('词云.jpg')  # 保存到当地文件

4.全部代码如下
'''
1. 导入所需的模块和库:
'''
import requests # 用来爬虫
from bs4 import BeautifulSoup
import numpy
from PIL import Image
import re
import pandas as pd
import jieba #分词库
from wordcloud import WordCloud #词云库
import numpy as np
from PIL import Image
import matplotlib.pyplot as plt
'''
2. 定义 get_data函数,用于爬取数据。
'''
def get_data():
# 伪请求头,伪装成浏览器
cookie = ''
fake_headers = {
'User-Agent': 'Mozilla/5.0 (Windows NT 10.0; Win64; x64) AppleWebKit/537.36 (KHTML, like Gecko) Chrome/112.0.0.0 Safari/537.36', #浏览器名称
'Referer': 'https://so.gushiwen.cn/', #来源页面的地址
'Cookie': cookie #cookie
}
#目标网址
url = "https://so.gushiwen.cn/gushi/tangshi.aspx"
# 各首唐诗的链接列表
url_list = []
#请求数据:发送请求获取目标网页内容
response = requests.get(url,headers = fake_headers) #添加headers参数
html = response.content.decode("utf-8")
# print(html.txt)
# 解析HTML
soup = BeautifulSoup(html, 'lxml')
# 解析HTML获取各个类型的诗歌,并将链接和类型分别存储在两个列表中
div_ = soup.find_all('div',class_='typecont')
type_count=[]
for i in range(0,len(div_)):
bookMl_div = div_[i].find('div',class_ ='bookMl')
strong_elm = bookMl_div.find('strong')
type = strong_elm.contents[0] #类型
span_ = div_[i].find_all('span')
for j in range(0, len(span_)):
link = span_[j].find('a')['href']
url_list.append(link)
type_count.append(type)
#创建一个空的DataFrame用于存储古诗数据
son_data = pd.DataFrame(columns=['类型','标题','作者','朝代','正文'])
# 爬取完每一首古诗的链接后,循环每一个链接爬取每一首古诗
x = 0
# 循环遍历诗歌链接列表,依次爬取每一首古诗的数据,包括标题、作者、朝代和正文,并将其存储到DataFrame中
for link in url_list:
# 请求数据
link = 'https://so.gushiwen.cn'+link
response = requests.get(link, headers=fake_headers) # 添加headers参数
html = response.content.decode("utf-8")
# print(html.txt)
type = type_count[x]
soup = BeautifulSoup(html, 'lxml')
div_ = soup.find('div',id='sonsyuanwen')
title = div_.find('h1').contents[0]
try:
# name = div_.find('p',class_='source').find_all('a')[0].find('img')['alt']
a_name = div_.find('p', class_='source').find_all('a')[0]
name = a_name.find('img')['alt']
except:
x+=1
continue
p_source = div_.find('p', class_='source')
a_time = p_source.find_all('a')[1]
time = a_time.contents[0]
# time = div_.find('p', class_='source').find_all('a')[1].contents[0]
content = div_.find('div', class_='contson').contents
text = ''
for con in content:
if(str(con)!='<br/>'):
text += str(con).replace('\n', '')
print('已经爬取:' + title) # + ",作者:" + name + ",朝代:"+time+",正文:" +text
son_data.loc[len(son_data.index)] = [type, title, name, time, text]
x+=1
son_data.to_csv('./data.csv') # 将爬取的古诗数据保存为CSV文件
##################### 分词与词云图
def draw():
data = pd.read_csv('./data.csv')
# 分词
cut_text = list(data['正文'])
new_text = []
all_text = ''
for str in cut_text:
remove_chars = '[brp·’!"\#$%&\'()#!()*+,-./:;<=>?\@,:。?¥★、….>【】[]《》?“”‘’\[\\]^_`{|}~]+'
str = re.sub(remove_chars, "", str)
str.replace('br','').replace('p','')
result = jieba.cut(str)
a = ','.join(result).split(',')
new_text.append(a)
for s in new_text:
for word in s:
all_text+=word+' '
# 词云图
font = "C:\\Windows\\Fonts\\simsun.ttc" # 词云的中文字体所在路径
mask = numpy.array(Image.open('bg.png'))
wc=WordCloud(
scale=4, # 调整图片大小---(如果设置太小图会很模糊)
font_path=font, # 使用的字体库
max_words=300, # 词云显示的最大词数
margin=1, # 字体之间的间距
mask=mask, # 背景图片
background_color='white', # 背景颜色
max_font_size=100,
# min_font_size=1,
# stopwords=STOPWORDS, #屏蔽的内容
collocations=False, # 避免重复单词
# width=1600, height=1200 # 图像宽高,字间距
)
wc.generate(all_text)
wc.to_file('词云.jpg') # 保存到当地文件
##################### 分词与词云图
def drawWordCloud():
data = pd.read_csv('./data.csv')
# 分词
cut_text = list(data['正文'])
new_text = []
all_text = ''
for str in cut_text:
# 去除无用的标点符号
remove_chars = '[brp·’!"\#$%&\'()#!()*+,-./:;<=>?\@,:。?¥★、….>【】[]《》?“”‘’\[\\]^_`{|}~]+'
str = re.sub(remove_chars, "", str)
str.replace('br','').replace('p','')
result = jieba.cut(str)
a = ','.join(result).split(',')
new_text.append(a)
for s in new_text:
for word in s:
all_text+=word+' '
# 词云图
font = "C:\\Windows\\Fonts\\simsun.ttc" # 词云的中文字体所在路径
mask = np.array(Image.open('bg.png'))
wc=WordCloud(
scale=4, # 调整图片大小---(如果设置太小图会很模糊)
font_path=font, # 使用的字体库
max_words=300, # 词云显示的最大词数
margin=1, # 字体之间的间距
mask=mask, # 背景图片
background_color='white', # 背景颜色
max_font_size=100,
# min_font_size=1,
# stopwords=STOPWORDS, #屏蔽的内容
collocations=False, # 避免重复单词
# width=1600, height=1200 # 图像宽高,字间距
)
wc.generate(all_text)
wc.to_file('词云图.jpg') # 保存到当地文件
##################### 统计与绘图
'''
drawPic1函数:
- 读取"data.csv"文件,将其转换为一个DataFrame对象。
- 获取古诗的类型集合,并按照类型进行分组。
- 统计每种类型古诗的数量,并存储到type_count列表中。
- 创建一个折线图,并将古诗类型与数量作为横纵轴的坐标,绘制出图像。
- 在图上标明数据标签和纵竖线。
- 设置图的标题、横纵轴标签,并保存图像到"唐诗各个类型数量统计.png"文件中。
'''
def drawPic1():
# 类型数量折线图
data = pd.read_csv('./data.csv')
type_list = set(list(data['类型'])) # 获取古诗类型集合
type_group = data.groupby(by='类型') # 数据按类型分组
type_count = np.linspace(0,0,len(type_list)).astype(int) # 列表:用来存各个类型的古诗数量
index = 0
print('【一、按类型分析:】')
for t in type_list: # 遍历每种类型的古诗
data_type = type_group.get_group(t)
type_count[index] = len(data_type) #该类型的古诗数量
print(" " + t + ":"+ str(type_count[index])+" 首")
index += 1
x = np.linspace(0,len(type_list)-1,len(type_list)).astype(int)
fig = plt.figure(figsize=(6, 6))
ax1 = plt.subplot(1, 1, 1)
ax1.plot(x, type_count, '-*', color='orange', linewidth=1.5, markersize='8')
plt.xticks(x, type_list)
# 设置数据标签
for a, b in zip(x, type_count):
plt.text(a, b, b, ha='center', va='bottom')
#纵竖线
for i in range(0,len(type_count)):
ax1.vlines(i, 0, type_count[i], linewidth=0.5, linestyles='dashed', colors='blue')
ax1.set_ylim((0, 90))
ax1.set_xlabel(r'类型')
ax1.set_ylabel(r'数量')
ax1.set_title('唐诗各个类型数量统计')
plt.savefig('./唐诗各个类型数量统计.png')
'''
2. drawPic2函数:通过读取同样的"data.csv"文件,对不同作者的古诗数量进行统计,并选取数量排名前十的作者,绘制柱状图进行展示。
'''
def drawPic2():
# 作者诗数量柱状图
data = pd.read_csv('./data.csv')
author_list = set(list(data['作者'])) # 获取古诗捉着集合
author_group = data.groupby(by='作者') # 数据按作者分组
author_count = np.linspace(0, 0, len(author_list)).astype(int) # 列表:用来存各个作者的古诗数量
index = 0
# print('【二、按作者分析:】')
for a in author_list: # 遍历每种类型的古诗
data_type = author_group.get_group(a)
author_count[index] = len(data_type) # 该类型的古诗数量
# print(" " + a + ":" + str(author_count[index]) + " 首")
index += 1
author_poem = pd.DataFrame()
author_poem['作者'] = list(author_list)
author_poem['数量'] = list(author_count)
author_poem = author_poem.sort_values(by='数量',ascending=False) # 排序
author_list = []
author_count = []
# 作者数量太多,只取前十
for i in range(0,10):
author_list.append(list(author_poem['作者'])[i])
author_count.append(list(author_poem['数量'])[i])
x = [0,1,2,3,4,5,6,7,8,9]
fig = plt.figure(figsize=(6, 6))
ax2 = plt.subplot(1, 1, 1)
ax2.bar(x,author_count)
plt.xticks(x, author_list) # rotation=-50
ax2.set_xlabel(r'作者')
ax2.set_ylabel(r'数量')
ax2.set_title('唐诗作者Top-10统计')
plt.savefig('./唐诗作者Top-10统计.png')
'''
3. drawPic3函数:统计李白的不同类型古诗的数量,并用扇形图展示各个类型所占的比例。
'''
def drawPic3():
############ 李白的诗类型扇形图
data = pd.read_csv('./data.csv')
author_group = data.groupby(by='作者') # 数据按作者分组
count = 0
LiBai_data = author_group.get_group('李白') # 提取出李白的数据
type_list = set(list(LiBai_data['类型'])) # 获取古诗类型集合
type_group = LiBai_data.groupby(by='类型') # 数据按类型分组
type_count = np.linspace(0, 0, len(type_list)).astype(int) # 列表:用来存李白各个类型的古诗数量
index = 0
print('【一、把李白的诗,按类型统计:】')
for t in type_list: # 遍历每种类型的古诗
data_type = type_group.get_group(t)
type_count[index] = len(data_type) # 该类型的古诗数量
print(" " + t + ":" + str(type_count[index]) + " 首")
index += 1
fig = plt.figure(figsize=(6, 6))
ax2 = plt.subplot(1, 1, 1)
colors = ["#F08080", "#FF1493", "#6495ED", "#5F9EA0","#40E0D0","#FFD700","#FFFF00"]
ax2.pie(type_count, labels=type_list,colors=colors,autopct='%.1f%%')
ax2.set_xlabel('单位:首(数量)')
ax2.set_title('李白诗作品中各类型占比')
ax2.set_ylabel('')
plt.savefig('./李白各类型的诗占比饼图.png')
def drawPic4():
############ 李白的诗按类型统计
data = pd.read_csv('./data.csv')
type_list = set(list(data['类型'])) # 获取古诗类型集合
author_group = data.groupby(by='作者') # 数据按作者分组
LiBai_data = author_group.get_group('李白') # 提取出李白的数据
type_list1 = type_list # 获取古诗类型集合
type_group1 = LiBai_data.groupby(by='类型') # 数据按类型分组
type_count1 = np.linspace(0, 0, len(type_list1)).astype(int) # 列表:用来存李白各个类型的古诗数量
index = 0
for t in type_list1: # 遍历每种类型的古诗
data_type = type_group1.get_group(t)
type_count1[index] = len(data_type) # 该类型的古诗数量
index += 1
############ 杜甫的诗按类型统计
DuFu_data = author_group.get_group('杜甫') # 提取出李白的数据
type_list2 = type_list # 获取古诗类型集合
type_group2 = DuFu_data.groupby(by='类型') # 数据按类型分组
type_count2 = np.linspace(0, 0, len(type_list2)).astype(int) # 列表:用来存杜甫各个类型的古诗数量
index = 0
for t in type_list2: # 遍历每种类型的古诗
data_type = type_group2.get_group(t)
type_count2[index] = len(data_type) # 该类型的古诗数量
index += 1
fig = plt.figure(figsize=(6, 6))
ax3 = plt.subplot(1, 1, 1)
y1 = list(range(len(type_list)))
y2 = [i+0.2 for i in y1]
ax3.barh(y1,type_count1,label='李白',height=0.2)
ax3.barh(y2, type_count2, label='杜甫',height=0.2)
ax3.set_xlabel('单位:首(数量)')
ax3.set_title('李白和杜甫各类型的诗对比')
ax3.set_ylabel('')
plt.legend()
plt.yticks(y1,type_list)
plt.savefig('./李白和杜甫各类型的诗数量对比.png')
plt.show()
if __name__ == '__main__':
get_data() # 爬取数据
'''绘图'''
drawWordCloud() # 词云图
drawPic1()
drawPic2()
drawPic3()
drawPic4()
五、总结
通过编写爬虫程序,我们从指定的网站中爬取了唐诗三百首的相关信息,包括题目、作者、内容等。这为后续的数据处理和可视化分析提供了数据基础。我们对爬取到的数据进行了清洗和整理,去除了冗余信息,确保了数据的准确性和一致性。这使得我们能够处理干净、规范的数据集。清洗后的数据被存储到CSV文件中。这样,我们可以方便地访问和管理唐诗数据,并为后续的数据可视化处理提供了便利。
如果你也喜欢编程,想通过学习Python获取更高薪资,这里给大家分享一份Python学习资料。
👉Python所有方向的学习路线👈
Python所有方向路线就是把Python常用的技术点做整理,形成各个领域的知识点汇总,它的用处就在于,你可以按照上面的知识点去找对应的学习资源,保证自己学得较为全面。(全套教程文末领取)
👉Python学习视频600合集👈
温馨提示:篇幅有限,已打包文件夹,获取方式在:文末
👉Python70个实战练手案例&源码👈

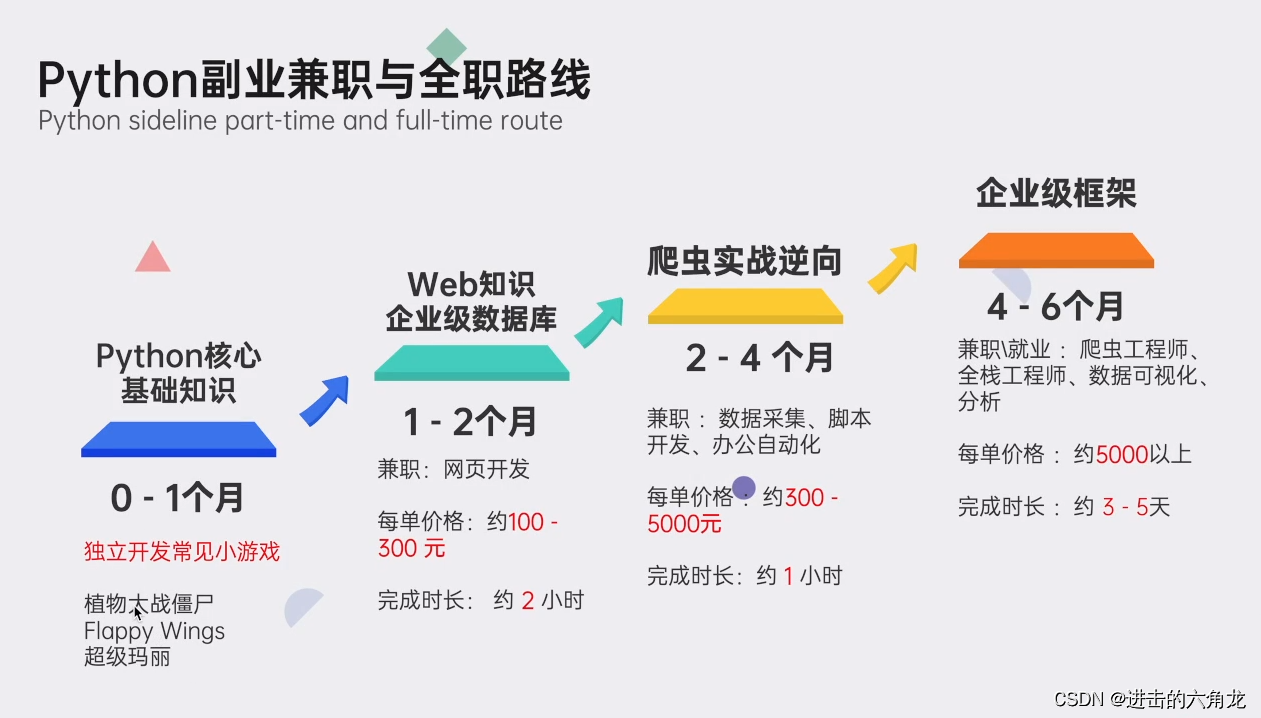
👉Python副业兼职路线&方法👈
👉 这份完整版的Python全套学习资料已经上传,朋友们如果需要可以直接下方领取
【保证100%免费】


 3716
3716

 被折叠的 条评论
为什么被折叠?
被折叠的 条评论
为什么被折叠?
 到【灌水乐园】发言


