


目录
elasticsearch
集群部署
环境
| 主机 | ip | 角色 |
| k8s1 | 192.168.81.10 | cerebro |
| server1 | 192.168.81.11 | elasticsearch |
| server2 | 192.168.81.12 | elasticsearch |
| server3 | 192.168.81.13 | elasticsearch |
| server4 | 192.168.81.14 | logstash |
| server5 | 192.168.81.15 | kibana |
软件安装
[root@server1 ~]# rpm -ivh elasticsearch-7.6.1-x86_64.rpm
修改配置
[root@server1 ~]# cd /etc/elasticsearch/
[root@server1 elasticsearch]# vim elasticsearch.yml
cluster.name: my-es
path.data: /var/lib/elasticsearch
path.logs: /var/log/elasticsearch
bootstrap.memory_lock: true
network.host: 0.0.0.0
http.port: 9200
discovery.seed_hosts: ["server1", "server2", "server3"]
cluster.initial_master_nodes: ["server1", "server2", "server3"]


修改系统限制
[root@server1 ~]# vim /etc/security/limits.conf
elasticsearch soft memlock unlimited
elasticsearch hard memlock unlimited
elasticsearch  -  nofile  65535
elasticsearch  -  nproc  4096

修改systemd启动文件
[root@server1 ~]# vim /usr/lib/systemd/system/elasticsearch.service
[service]
...
LimitMEMLOCK=infinity

[root@server1 ~]# systemctl  daemon-reload
[root@server1 ~]# swapoff -a
[root@server1 ~]# vim /etc/fstab
#/dev/mapper/rhel-swap   swap                    swap    defaults        0 0

[root@server1 ~]# systemctl daemon-reload
[root@server1 ~]# systemctl  enable --now  elasticsearch


使用docker启动服务
[root@k8s1 ~]#  docker pull lmenezes/cerebro
[root@k8s1 ~]#  docker run -d --name cerebro -p 9000:9000 lmenezes/cerebro


elasticsearch集群角色分类
Master:主要负责集群中索引的创建、删除以及数据的Rebalance等操作。 Master不负责数据的索引和检索,所以负载较轻。当Master节点失联或 者挂掉的时候,ES集群会自动从其他Master节点选举出一个Leader。Data Node:主要负责集群中数据的索引和检索,一般压力比较大。Coordinating Node:原来的Client node,主要功能是来分发请求和合并结果的。所有节点默认就是Coordinating node,且不能关闭该属性。Ingest Node:专门对索引的文档做预处理。
[root@server1 ~]# systemctl  stop elasticsearch.service
[root@server1 ~]# vim /etc/elasticsearch/elasticsearch.yml
node.master: true
node.data: false
node.ingest: true
node.ml: false
[root@server1 elasticsearch]# systemctl  restart elasticsearch.service

[root@server2 ~]# systemctl  stop elasticsearch.service
[root@server2 ~]# vim /etc/elasticsearch/elasticsearch.yml
node.master: true
node.data: true
node.ingest: false
node.ml: false
[root@server2 ~]# systemctl  restart elasticsearch.service

[root@server3 ~]# systemctl  stop elasticsearch.service
[root@server3 ~]# vim /etc/elasticsearch/elasticsearch.yml
node.master: true
node.data: true
node.ingest: false
node.ml: false
[root@server3 ~]# systemctl  restart elasticsearch.service

elasticsearch节点优化


logstash
部署
[root@server4 ~]# yum install -y jdk-11.0.15_linux-x64_bin.rpm
[root@server4 ~]# yum install -y logstash-7.6.1.rpm
命令方式
标准输入到标准输出
[root@server4 bin]# /usr/share/logstash/bin/logstash -e 'input { stdin { } } output { stdout {} }'

标准输入到文件
[root@server4 conf.d]# vim /etc/logstash/conf.d/file.conf
input {
    stdin { }
}
output {
    file {
        path => "/tmp/logstash.txt"     #输出的文件路径
        codec => line { format => "custom format: %{message}"}    #定制数据格式
}
}
[root@server4 conf.d]# /usr/share/logstash/bin/logstash -f /etc/logstash/conf.d/file.conf
[root@server4 conf.d]# cat /tmp/logstash.txt

elasticsearch-head插件
安装依赖
[root@k8s1 ~]# yum install -y bzip2
[root@k8s1 ~]# tar jxf phantomjs-2.1.1-linux-x86_64.tar.bz2
[root@k8s1 ~]# cd phantomjs-2.1.1-linux-x86_64
[root@k8s1 phantomjs-2.1.1-linux-x86_64]# cp bin/phantomjs /usr/local/bin/
[root@k8s1 ~]# yum install -y fontconfig
[root@k8s1 ~]# phantomjs
phantomjs>

安装插件
[root@k8s1 ~]# rpm -ivh nodejs-9.11.2-1nodesource.x86_64.rpm
[root@k8s1 ~]# yum install -y unzip
[root@k8s1 ~]# unzip elasticsearch-head-master.zip
[root@k8s1 ~]# cd elasticsearch-head-master/
[root@k8s1 elasticsearch-head-master]# npm install  --registry=https://registry.npm.taobao.org

[root@k8s1 elasticsearch-head-master]# vim _site/app.js

启动服务
[root@k8s1 elasticsearch-head-master]# npm run start &
修改es配置
[root@server1 ~]# vim /etc/elasticsearch/elasticsearch.yml
http.cors.enabled: true
http.cors.allow-origin: "*"

[root@server1 ~]# systemctl  restart elasticsearch.service

创建索引


elasticsearch输出插件
[root@server4 conf.d]# pwd
/etc/logstash/conf.d
[root@server4 conf.d]# vim test.conf
input {
        stdin { }
}

output {
        stdout {}

        elasticsearch {
                hosts => "192.168.81.11:9200"
                index => "logstash-%{+YYYY.MM.dd}"
        }
}

[root@server4 conf.d]# /usr/share/logstash/bin/logstash -f /etc/logstash/conf.d/test.conf

启动成功后录入数据,ctrl+c退出


file输入插件
[root@server4 conf.d]# vim test.conf
input {
        file {
                path => "/var/log/messages"
                start_position => "beginning"
        }
}

output {
        stdout {}

        elasticsearch {
                hosts => "192.168.81.11:9200"
                index => "syslog-%{+YYYY.MM.dd}"
        }

}

[root@server4 conf.d]# /usr/share/logstash/bin/logstash -f /etc/logstash/conf.d/test.conf


.sincedb文件保存文件读取进度,避免数据冗余读取
[root@server4 conf.d]# cd /usr/share/logstash/data/plugins/file
[root@server4 file]# ls -i  /var/log/messages
[root@server4 file]# cat .sincedb_452905a167cf4509fd08acb964fdb20c
sincedb文件一共6个字段
- inode编号
- 文件系统的主要设备号
- 文件系统的次要设备号
- 文件中的当前字节偏移量
- 最后一个活动时间戳(浮点数)
- 与此记录匹配的最后一个已知路径
 删除后重新读取
[root@server4 file]# rm -f .sincedb_452905a167cf4509fd08acb964fdb20c
syslog 插件
logstash伪装成日志服务器
[root@server4 conf.d]# vim syslog.conf
input {
        syslog {}
}

output {
         stdout {}

        elasticsearch {
                hosts => "192.168.81.11:9200"
                index => "syslog-%{+YYYY.MM.dd}"
        }

}

[root@server4 conf.d]# /usr/share/logstash/bin/logstash -f /etc/logstash/conf.d/syslog.conf


配置客户端日志输出
[root@server1 ~]# vim /etc/rsyslog.conf
$ModLoad imudp
$UDPServerRun 514

*.*	 @@192.168.56.14:514

[root@server1 ~]# systemctl  restart rsyslog.service
[root@server1 ~]#  logger server1


多行过滤插件
多行过滤可以把多行日志记录合并为一行事件
从server1拷贝模板文件
[root@server1 elasticsearch]# cd /var/log/elasticsearch
[root@server1 elasticsearch]# scp my-es.log server4:/var/log/
[root@server4 conf.d]# vim test.conf
input {

        file {
                path => "/var/log/my-es.log"
                start_position => "beginning"
                codec => multiline {
                pattern => "^\["
                negate => true
                what => previous
                }
        }

}

output {
        stdout {}

        elasticsearch {
                hosts => "192.168.81.11:9200"
                index => "myeslog-%{+YYYY.MM.dd}"
        }

}

[root@server4 conf.d]# /usr/share/logstash/bin/logstash -f /etc/logstash/conf.d/test.conf


grok过滤
[root@server4 ~]# yum install -y httpd
[root@server4 ~]# systemctl  enablel --now httpd
[root@server4 ~]# echo www.westos.org > /var/www/html/index.html
访问此站点生成日志信息
[root@k8s1 ~]# ab -c1 -n 100 http://192.168.81.14/index.html


[root@server4 conf.d]# vim grok.conf
input {
        file {
                path => "/var/log/httpd/access_log"
                start_position => "beginning"
        }
}

filter {
        grok {
                match => { "message" => "%{HTTPD_COMBINEDLOG}" }
        }
}

output {
        stdout {}

        elasticsearch {
                hosts => "192.168.81.11:9200"
                index => "apachelog-%{+YYYY.MM.dd}"
        }

}

[root@server4 conf.d]# /usr/share/logstash/bin/logstash -f /etc/logstash/conf.d/grok.conf


kibana数据可视化
部署
[root@server5 ~]# rpm -ivh kibana-7.6.1-x86_64.rpm

[root@server5 ~]# cd /etc/kibana/
[root@server5 kibana]# vim kibana.yml

server.host: "0.0.0.0"

elasticsearch.hosts: ["http://192.168.81.11:9200"]

i18n.locale: "zh-CN"

[root@server5 kibana]# systemctl  enable --now kibana


访问web页面: http://192.168.81.15:5601

定制数据可视化


访问量排行榜


创建dashboard,大屏展示

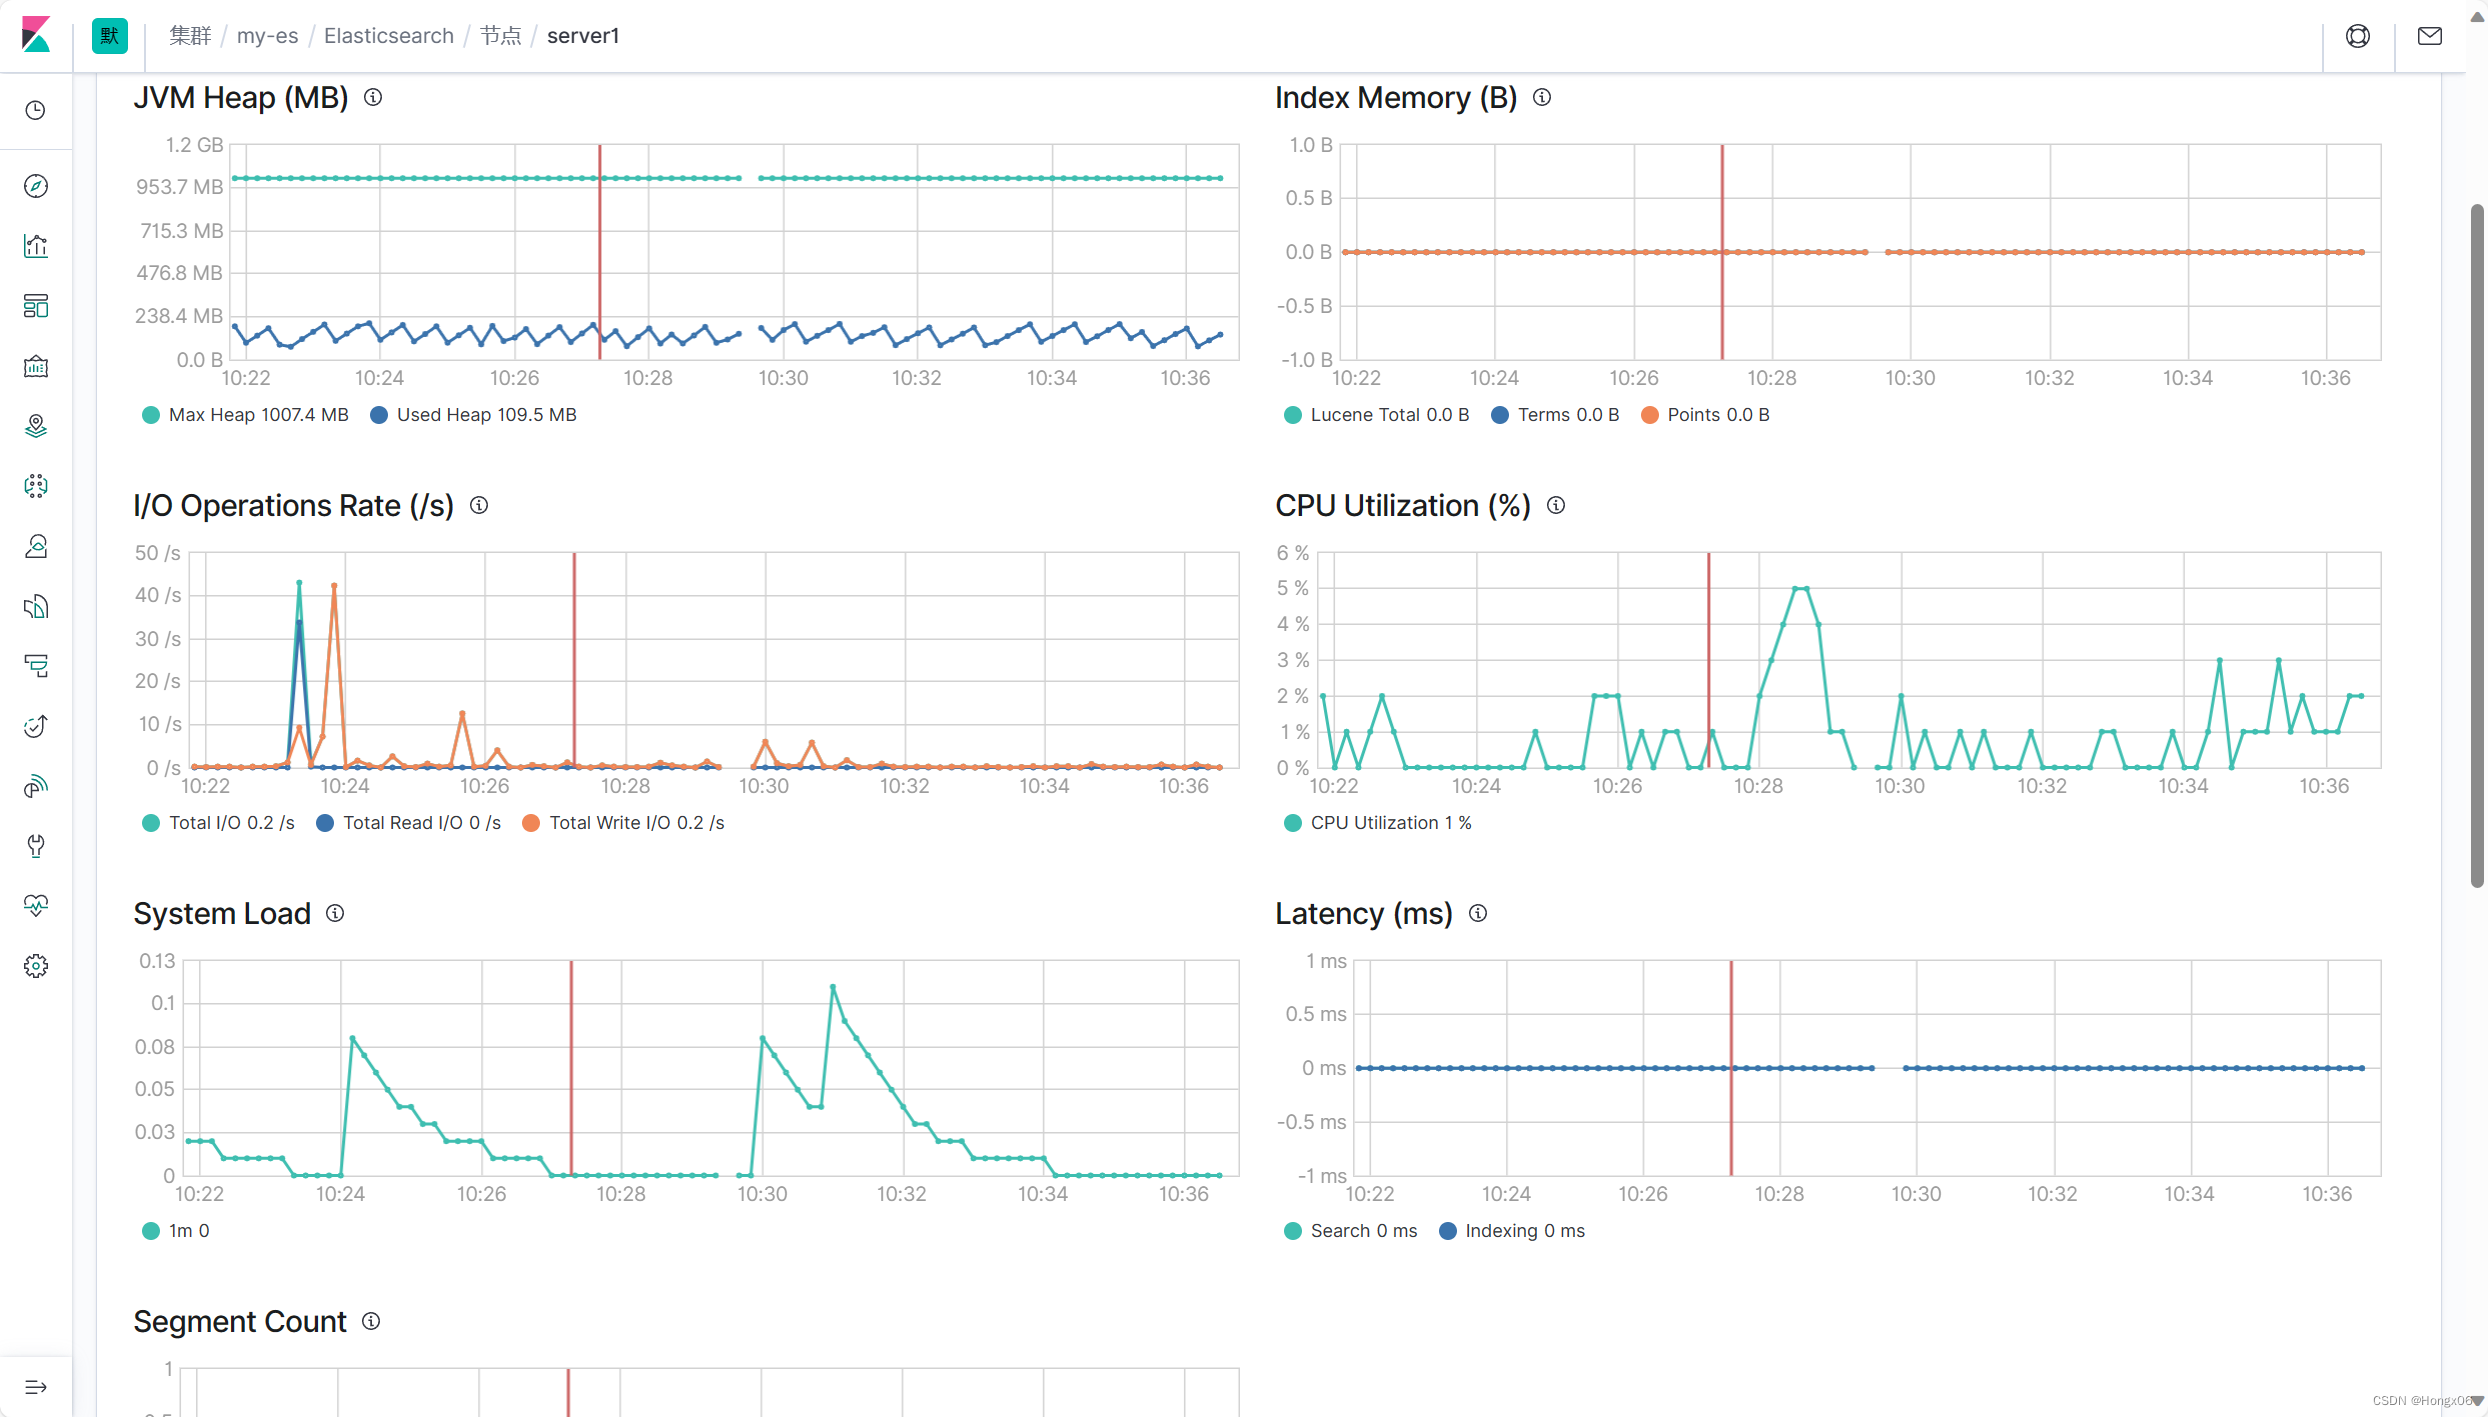
可以实时监控

ES集群监控
启用xpack认证
在server1上生成证书
[root@server1 ~]# cd /usr/share/elasticsearch/
[root@server1 elasticsearch]# bin/elasticsearch-certutil ca
[root@server1 elasticsearch]# bin/elasticsearch-certutil cert --ca elastic-stack-ca.p12
[root@server1 elasticsearch]# cp elastic-certificates.p12 /etc/elasticsearch
[root@server1 elasticsearch]# cd /etc/elasticsearch/
[root@server1 elasticsearch]# chown elasticsearch elastic-certificates.p12

[root@server1 elasticsearch]# vim elasticsearch.yml
...
http.cors.allow-headers: Authorization,X-Requested-With,Content-Length,Content-Type

xpack.security.enabled: true
xpack.security.transport.ssl.enabled: true
xpack.security.transport.ssl.verification_mode: certificate
xpack.security.transport.ssl.keystore.path: /etc/elasticsearch/elastic-certificates.p12
xpack.security.transport.ssl.truststore.path: /etc/elasticsearch/elastic-certificates.p12
[root@server1 elasticsearch]# systemctl  restart elasticsearch.service

拷贝证书到其它集群节点
[root@server1 elasticsearch]# scp elastic-certificates.p12 server2:/etc/elasticsearch/
[root@server1 elasticsearch]# scp elastic-certificates.p12 server3:/etc/elasticsearch/
server2、3配置
[root@server2 ~]# chown elasticsearch /etc/elasticsearch/elastic-certificates.p12
[root@server2 ~]# vim /etc/elasticsearch/elasticsearch.yml
...
xpack.security.enabled: true
xpack.security.transport.ssl.enabled: true
xpack.security.transport.ssl.verification_mode: certificate
xpack.security.transport.ssl.keystore.path: /etc/elasticsearch/elastic-certificates.p12
xpack.security.transport.ssl.truststore.path: /etc/elasticsearch/elastic-certificates.p12

[root@server2 ~]# systemctl  restart elasticsearch.service

等待所有集群节点重启成功后,设置认证账户密码
[root@server1 elasticsearch]# cd /usr/share/elasticsearch/
[root@server1 elasticsearch]# bin/elasticsearch-setup-passwords interactive
交互式输入密码

ES启用xpack之后,其它服务都需要配置认证
head插件在访问时,需要在url中输入用户和密码


logstash访问
[root@server4 ~]# vim /etc/logstash/conf.d/grok.conf
input {
        file {
                path => "/var/log/httpd/access_log"
                start_position => "beginning"
        }
}

filter {
        grok {
                match => { "message" => "%{HTTPD_COMBINEDLOG}" }
        }
}

output {
        stdout {}

        elasticsearch {
                hosts => "192.168.81.11:9200"
                index => "apachelog-%{+YYYY.MM.dd}"
                user => "elastic"
                password => "shg12345"
        }

}

查看是否启动成功
[root@server4 conf.d]# /usr/share/logstash/bin/logstash -f /etc/logstash/conf.d/grok.conf

kibana访问
[root@server5 kibana]# vim kibana.yml
...
elasticsearch.username: "kibana"
elasticsearch.password: "shg12345"
[root@server5 kibana]# systemctl  restart kibana.service


首先使用内部检测,然后进入设置模式


选择启动metricbeat的节点,然后根据提示步骤操作

安装软件
[root@server1 ~]# rpm -ivh metricbeat-7.6.1-x86_64.rpm
[root@server1 ~]# cd /etc/metricbeat/modules.d
[root@server1 modules.d]# metricbeat modules enable elasticsearch-xpack
[root@server1 modules.d]# vim elasticsearch-xpack.yml
- module: elasticsearch
  metricsets:
    - ccr
    - cluster_stats
    - enrich
    - index
    - index_recovery
    - index_summary
    - ml_job
    - node_stats
    - shard
  period: 10s
  hosts: ["http://localhost:9200"]
  username: "elastic"
  password: "shg12345"
  xpack.enabled: true

[root@server1 modules.d]# cd ..
[root@server1 metricbeat]# vim metricbeat.yml
...
output.elasticsearch:
  hosts: ["http://192.168.81.11:9200"]
  username: "elastic"
  password: "shg12345"

[root@server1 metricbeat]# systemctl enable --now metricbeat.service


其它节点依次类推

kibana 监控
[root@server5 ~]# rpm -ivh metricbeat-7.6.1-x86_64.rpm
[root@server5 modules.d]# metricbeat modules enable kibana-xpack
[root@server5 ~]# cd /etc/metricbeat/
[root@server5 metricbeat]# vim modules.d/kibana-xpack.yml
- module: kibana
  metricsets:
    - stats
  period: 10s
  hosts: ["192.168.36.139:5601"]
  #basepath: ""
  username: "kibana"
  password: "shg12345"
  xpack.enabled: true

[root@server5 metricbeat]# vim metricbeat.yml
output.elasticsearch:
  # Array of hosts to connect to.
  hosts: ["192.168.81.11:9200"]

  # Protocol - either `http` (default) or `https`.
  #protocol: "https"

  # Authentication credentials - either API key or username/password.
  #api_key: "id:api_key"
  username: "elastic"
  password: "shg12345"

[root@server5 metricbeat]# systemctl enable --now metricbeat.service

禁用内部检测
[root@server5 metricbeat]# vim /etc/kibana/kibana.yml
xpack.monitoring.kibana.collection.enabled: false
[root@server5 metricbeat]# systemctl  restart kibana.service


filebeat日志采集
文档:Elasticsearch module | Filebeat Reference [7.6] | Elastic
[root@server1 ~]# rpm -ivh filebeat-7.6.1-x86_64.rpm
[root@server1 ~]# cd /etc/filebeat/modules.d
[root@server1 modules.d]# filebeat modules enable elasticsearch

[root@server1 modules.d]# vim elasticsearch.yml
- module: elasticsearch
  # Server log
  server:
    enabled: true

    # Set custom paths for the log files. If left empty,
    # Filebeat will choose the paths depending on your OS.
    var.paths:
      - /var/log/elasticsearch/*.log          # Plain text logs
      - /var/log/elasticsearch/*_server.json  # JSON logs

  gc:
    enabled: true
    # Set custom paths for the log files. If left empty,
    # Filebeat will choose the paths depending on your OS.
    var.paths:
      - /var/log/elasticsearch/gc.log.[0-9]*
      - /var/log/elasticsearch/gc.log

  audit:
    enabled: true
    # Set custom paths for the log files. If left empty,
    # Filebeat will choose the paths depending on your OS.
    var.paths:
      - /var/log/elasticsearch/*_access.log  # Plain text logs
      - /var/log/elasticsearch/*_audit.json  # JSON logs

  slowlog:
    enabled: true
    # Set custom paths for the log files. If left empty,
    # Filebeat will choose the paths depending on your OS.
    var.paths:
      - /var/log/elasticsearch/*_index_search_slowlog.log     # Plain text logs
      - /var/log/elasticsearch/*_index_indexing_slowlog.log   # Plain text logs
      - /var/log/elasticsearch/*_index_search_slowlog.json    # JSON logs
      - /var/log/elasticsearch/*_index_indexing_slowlog.json  # JSON logs

  deprecation:
    enabled: true
    # Set custom paths for the log files. If left empty,
    # Filebeat will choose the paths depending on your OS.
    var.paths:
      - /var/log/elasticsearch/*_deprecation.log   # Plain text logs
      - /var/log/elasticsearch/*_deprecation.json  # JSON logs
[root@server1 modules.d]# cd ..
[root@server1 filebeat]# vim filebeat.yml
...
output.elasticsearch:
  hosts: ["http://192.168.56.11:9200"]
  username: "elastic"
  password: "westos"

[root@server1 filebeat]# systemctl  enable --now filebeat.service


其它节点依次类推


 663
663

 被折叠的 条评论
为什么被折叠?
被折叠的 条评论
为什么被折叠?
 到【灌水乐园】发言


