


起因是要画一张包含9个数据点的泰勒图,理想效果如下: 结果在颜色设置上一直报错:
ValueError Traceback (most recent call last)
Cell In[70], line 1
----> 1 ty5=sm.taylor_diagram(sdev,da,ccoef, markerLabel = label, markerLabelColor = 'black',
2 markerLegend = 'on',
3 styleOBS = '--', colOBS = 'y', markerobs = 'o',
4 markerSize = 6, tickRMS = [0.0, 0.25, 0.5, 0.75, 1.0],axismax = 2.0,
5 tickRMSangle = 145.0, showlabelsRMS = 'on',widthRMS = 1.0,
6 showlabelsSTD = 'off',titleRMS = 'off', #titleOBS = 'GroundTruth',
7 checkstats = 'off')
8 # plt.title("(e)Taylor plot of DA",fontdict=text_font,pad=35)
9 plt.tight_layout()
File ~\Desktop\路径A\路径B\skill_metrics\taylor_diagram.py:388, in taylor_diagram(*args, **kwargs)
386 lowcase = options['markerdisplayed'].lower()
387 if lowcase == 'marker':
--> 388 plot_pattern_diagram_markers(ax, X, Y, options)
389 elif lowcase == 'colorbar':
390 nZdata = len(options['cmapzdata'])
File ~\Desktop\路径A\路径B\Visulazation\skill_metrics\plot_pattern_diagram_markers.py:108, in plot_pattern_diagram_markers(ax, X, Y, option, markerColors)
106 for i, xval in enumerate(X):
107 if abs(X[i]) <= limit and abs(Y[i]) <= limit:
--> 108 h = ax.plot(X[i],Y[i],marker[i], markersize = markerSize,
109 markerfacecolor = markercolor[i],
110 markeredgecolor = markercolor[i][0:3] + (1.0,),
111 markeredgewidth = 2)
112 hp += tuple(h)
113 labelcolor.append(option['markerlabelcolor'])
File D:\anaconda\lib\site-packages\matplotlib\axes_axes.py:1688, in Axes.plot(self, scalex, scaley, data, *args, **kwargs)
1445 """
1446 Plot y versus x as lines and/or markers.
1447
(...)
1685 ('green') or hex strings ('#008000').
1686 """
1687 kwargs = cbook.normalize_kwargs(kwargs, mlines.Line2D)
-> 1688 lines = [*self._get_lines(*args, data=data, **kwargs)]
1689 for line in lines:
1690 self.add_line(line)
File D:\anaconda\lib\site-packages\matplotlib\axes_base.py:311, in _process_plot_var_args.call(self, data, *args, **kwargs)
309 this += args[0],
310 args = args[1:]
--> 311 yield from self._plot_args(
312 this, kwargs, ambiguous_fmt_datakey=ambiguous_fmt_datakey)
File D:\anaconda\lib\site-packages\matplotlib\axes_base.py:454, in _process_plot_var_args._plot_args(self, tup, kwargs, return_kwargs, ambiguous_fmt_datakey)
451 if len(tup) > 1 and isinstance(tup[-1], str):
452 # xy is tup with fmt stripped (could still be (y,) only)
453 *xy, fmt = tup
--> 454 linestyle, marker, color = _process_plot_format(
455 fmt, ambiguous_fmt_datakey=ambiguous_fmt_datakey)
456 elif len(tup) == 3:
457 raise ValueError('third arg must be a format string')
File D:\anaconda\lib\site-packages\matplotlib\axes_base.py:190, in _process_plot_format(fmt, ambiguous_fmt_datakey)
188 elif c in mcolors.get_named_colors_mapping():
189 if color is not None:
--> 190 raise ValueError(errfmt.format(fmt, "two color symbols"))
191 color = c
192 i += 1
ValueError: 'pgray' is not a valid format string (two color symbols)
跑到get_default_markers.py子模块一看,发现'pgray'来自预定义列表的第8个形状和颜色:
Define list of marker symbols and colros
kind = ['+','o','x','s','d','^','v','p','h','*']colorm = ['r','b','g','c','m','y','k','gray']
单字母颜色字符串就那么几个,各种换颜色参数,十六进制,RGB元组都不行
最后改掉这1行才成功(大概45行左右):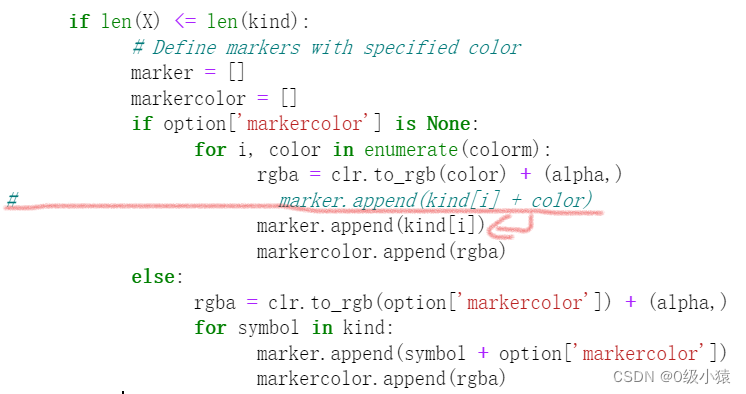
只能说新库还不是很完善,Debug使人崩溃,,,,


 2269
2269

 被折叠的 条评论
为什么被折叠?
被折叠的 条评论
为什么被折叠?
 到【灌水乐园】发言


