


Prometheus介绍
Prometheus是由SoundCloud开发的开源监控报警系统和时序列数据库(TSDB)。Prometheus使用Go语言开发,是Google BorgMon监控系统的开源版本。2016年由Google发起Linux基金会旗下的原生云基金会(Cloud Native Computing Foundation), 将Prometheus纳入其下第二大开源项目。Prometheus目前在开源社区相当活跃。Prometheus和Heapster(Heapster是K8S的一个子项目,用于获取集群的性能数据。)相比功能更完善、更全面。Prometheus性能也足够支撑上万台规模的集群。
环境准备
| IP | 主机 | 服务 |
| * | 监控 | Prometheus,grafana |
| * | 被监控端 | Node_exporter,cadviosr |
监控端安装
一、部署Prometheus
1、下载软件包
2、解压软件包
tar zxvf prometheus-2.19.2.linux-amd64.tar.gz
3、将解压完目录移动并修改文件名
mv prometheus-2.19.2.linux-amd64 /usr/local/prometheus
4、创建用户
groupadd prometheus
useradd -g prometheus -m -d /var/lib/prometheus -s /sbin/nologin prometheus
chown prometheus.prometheus -R /usr/local/prometheus
5、创建systemd服务
cat > /etc/systemd/system/prometheus.service <<EOF
[Unit]
Description=prometheus
After=network.target
[Service]
Type=simple
User=prometheus
ExecStart=/usr/local/prometheus/prometheus --config.file=/usr/local/prometheus/prometheus.yml --storage.tsdb.path=/var/lib/prometheus/data
Restart=on-failure
[Install]
WantedBy=multi-user.target
EOF
6、启动Prometheus
刷新参数
systemctl daemon-reload
7、启动Prometheus
systemctl start prometheus
8、查看状态
systemctl status prometheus
9、设置为开机自启
systemctl enable prometheus
10、访问WEB界面
被监控端安装
二、安装node_exporter
1、下载软件包
2、解压
tar zxvf node_exporter-1.0.1.linux-amd64.tar.gz
3、移动并修改文件
mv node_exporter-1.0.1.linux-amd64 /usr/local/node_exporter
4、创建用户
groupadd prometheus
useradd -g prometheus -m -d /var/lib/prometheus -s /sbin/nologin prometheus
chown prometheus.prometheus -R /usr/local/node_exporter
5、创建Systemd服务
cat > /etc/systemd/system/node_exporter.service <<EOF
[Unit]
Description=node_exporter
After=network.target
[Service]
Type=simple
User=prometheus
ExecStart=/usr/local/node_exporter/node_exporter
Restart=on-failure
[Install]
WantedBy=multi-user.target
EOF
6、启动node_exporter
#使参数生效
systemctl daemon-reload
#启动node_exporter服务
systemctl start node_exporter
#查看服务状态
systemctl status node_exporter
#设置开机自启
systemctl enable node_exporter
7、验证启动成功
curl 127.0.0.1:9100
curl 127.0.0.1:9100/metrics
服务端配置(在监控端配置)
prometheus的服务端通过pull向各个node_exporter节点端抓取信息,需要在各个node上安装exporter。可以利用 Prometheus 的 static_configs 来拉取 node_exporter 的数据。
1、编辑/usr/local/prometheus/prometheus.yml文件,添加内容:
- job_name: 'node244'
static_configs:
- targets: ['XXX.XXX.XXX.XXX:9100']
完整配置如下:
[root@localhost prometheus]# cat prometheus.yml
# my global config
global:
scrape_interval: 15s # Set the scrape interval to every 15 seconds. Default is every 1 minute.
evaluation_interval: 15s # Evaluate rules every 15 seconds. The default is every 1 minute.
# scrape_timeout is set to the global default (10s).
# Alertmanager configuration
alerting:
alertmanagers:
- static_configs:
- targets:
# - alertmanager:9093
# Load rules once and periodically evaluate them according to the global 'evaluation_interval'.
rule_files:
# - "first_rules.yml"
# - "second_rules.yml"
# A scrape configuration containing exactly one endpoint to scrape:
# Here it's Prometheus itself.
scrape_configs:
# The job name is added as a label `job=<job_name>` to any timeseries scraped from this config.
- job_name: 'server248'
# metrics_path defaults to '/metrics'
# scheme defaults to 'http'.
static_configs:
- targets: ['172.17.10.248:9090']
- job_name: 'node247'
static_configs:
- targets: ['172.17.10.247:9100']
- job_name: 'node246'
static_configs:
- targets: ['172.17.10.246:9100']
- job_name: 'node244'
static_configs:
- targets: ['172.17.10.244:9100']
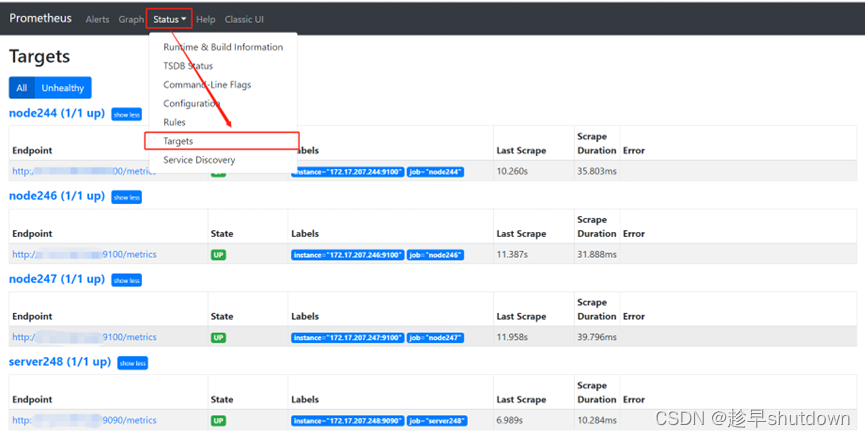
2、重启prometheus,然后在Prometheus页面中的Targets中就能看到新加入的node:
systemctl restart prometheus
3、然后再次查询web界面如下:
三、cAdvisor部署
github地址:https://github.com/google/cadvisor
1、通过docker快速安装cadvisor,然后通过8081就可以访问了(可任意修改端口)。
docker run \
--volume=/:/rootfs:ro \
--volume=/var/run:/var/run:ro \
--volume=/sys:/sys:ro \
--volume=/var/lib/docker/:/var/lib/docker:ro \
--volume=/dev/disk/:/dev/disk:ro \
--publish=8081:8080 \
--detach=true \
--name=cadvisor \
google/cadvisor:latest
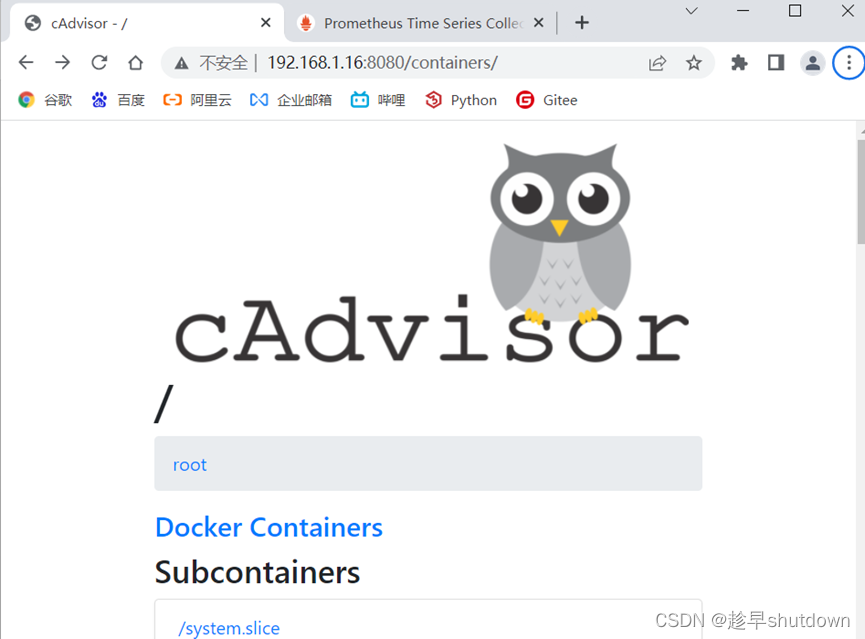
2、访问web查看
四、grafana部署
安装grafana
1、获取官方rpm包并安装rpm包
wget https://dl.grafana.com/oss/release/grafana-6.4.4-1.x86_64.rpm
或
yum -y install --downloadonly --downloaddir=/opt/grafana grafana-8.3.3
2、安装依赖包
yum -y install urw-fonts fontconfig
3、解压文件
rpm -ivh grafana-6.4.4-1.x86_64.rpm
4、设置开机自启
#设置开机自启
systemctl enable grafana-server
#启动服务
systemctl start grafana-server
5、配置文件位于/etc/grafana/grafana.ini,这里暂时保持默认配置即可
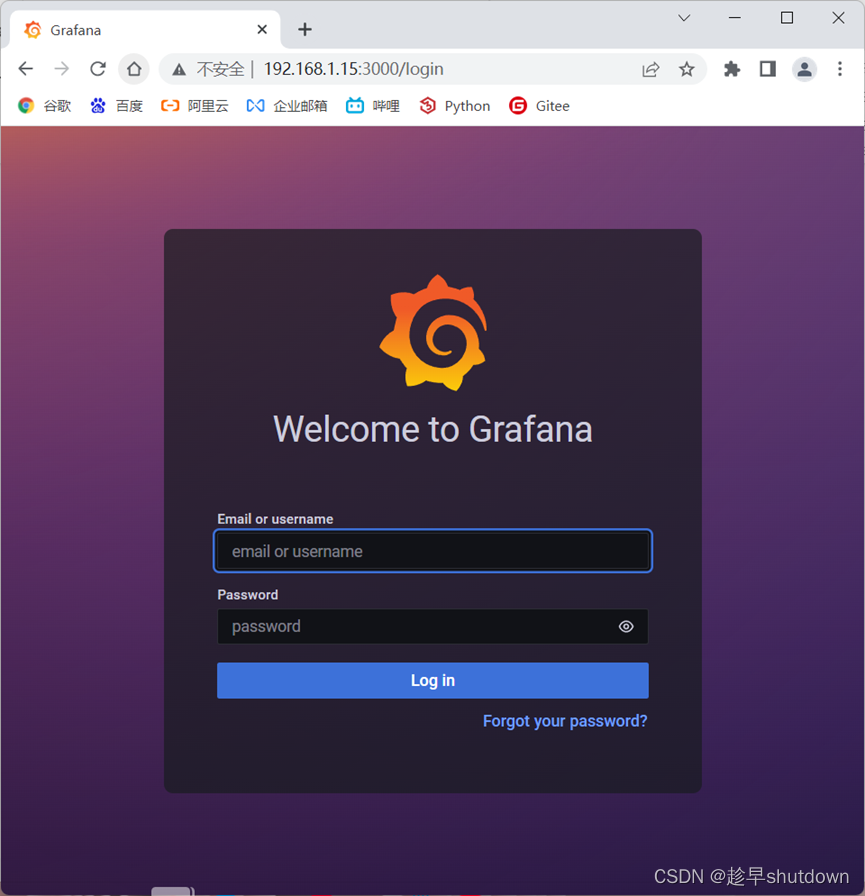
6、访问web
初始账号密码为admin
到这里Prometheus就搭建完成了


 153
153


 被折叠的 条评论
为什么被折叠?
被折叠的 条评论
为什么被折叠?
 到【灌水乐园】发言


