


 本文介绍了人工智能和数据分析的基础知识,涵盖了数据分析的四大能力——描述性、诊断性、预测性和规定性分析,以及大数据的概念和挑战。文章还讨论了数据处理周期、数据库和数据仓库,以及ETL过程。此外,内容涉及人工智能的多个子领域,如机器学习、深度学习,以及计算机视觉和语音处理。最后,提到了推荐系统和社会网络分析的应用,并探讨了AIDA实践的社会影响,包括隐私、透明度和公平性问题。
Introduction to Artificial Intelligence and Data Analytics 笔记。
课件引用于香港理工大学comp1004课程
Content
- Chapter 1: Data Analytics and Big Data
- Chapter 2: Overview of AI and Machine Learning
- Chapter 3: Regression
- Chapter 4: Classification
- Chapter 5: Deep Learning
- Chapter 6: Chatbots and Conversational Agents
- Chapter 7: NLP and Sentimental Analysis
- Chapter 8: Recommender Systems
- Chapter 9: Social Network Analysis
- Chapter 10: Societal Implications of AIDA
- Chapter 11: Computer Vision and Speech Processing
Chapter 1: Data Analytics and Big Data
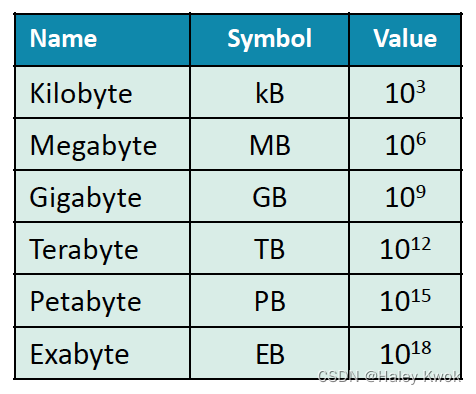
Global Datasphere is a measure of all new data that is captured, created, and replicated in any given year across the globe.
- One Terabyte (TB) = 1,000 Gigabytes (GB)
A single TB could hold 1,000 copies of the Encyclopedia Brittanica - All the X rays in a large hospital
1.1 Four data analytic capabilities
Data: Any piece of information stored and/or processed by a computer or mobile
device.
Data Analytics refers to the technologies and processes that turn raw data into
insight for making decisions and facilitates drawing conclusion from data
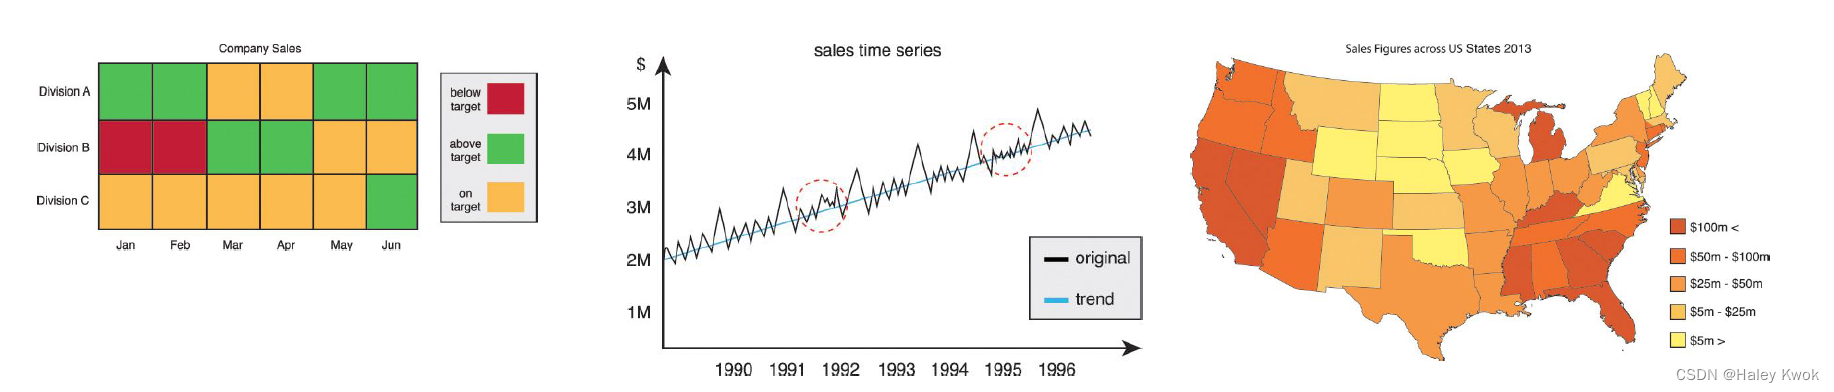
1.1.1 Descriptive Analytics
What has happened?
It is estimated that 80% of generated analytics results are descriptive in nature.
Descriptive analytics are often carried out via ad hoc reporting or dashboards
Examples
- What was the sales volume over the past 12 months?
- What is the number of support calls received as categorized by severity and geographic location?
1.1.2 Diagnostic Analytics
Diagnostic analytics aim to determine the cause of a phenomenon that occurred in the past using questions that focus on the reason behind the event.
Sample questions
- Why were Q2 sales less than Q1 sales?
- Why have there been more support calls originating from the Eastern region than from the Western region?
1.1.3 Predictive Analytics
Generate future predictions based upon past events.
Sample questions
- What are the chances that a customer will default on a loan if they have
missed a monthly payment? - What will be the patient survival rate if Drug B is administered instead of
Drug A?
1.1.4 Prescriptive Analytics
What should I do if “x” happens?
Prescriptive analytics provide specific (prescriptive) recommendations to the user.
Various outcomes are calculated, and the best course of action for each outcome is suggested.
Examples
- When is the best time to trade a particular stock?
1.2 Big Data
4V of Big Data
- Volume
A huge amount of data - Velocity
High speed and continuous flow of data - Variety
Different types of structured, semi structured and unstructured data coming from heterogenous sources - Veracity
Data may be inconsistent, incomplete and messy
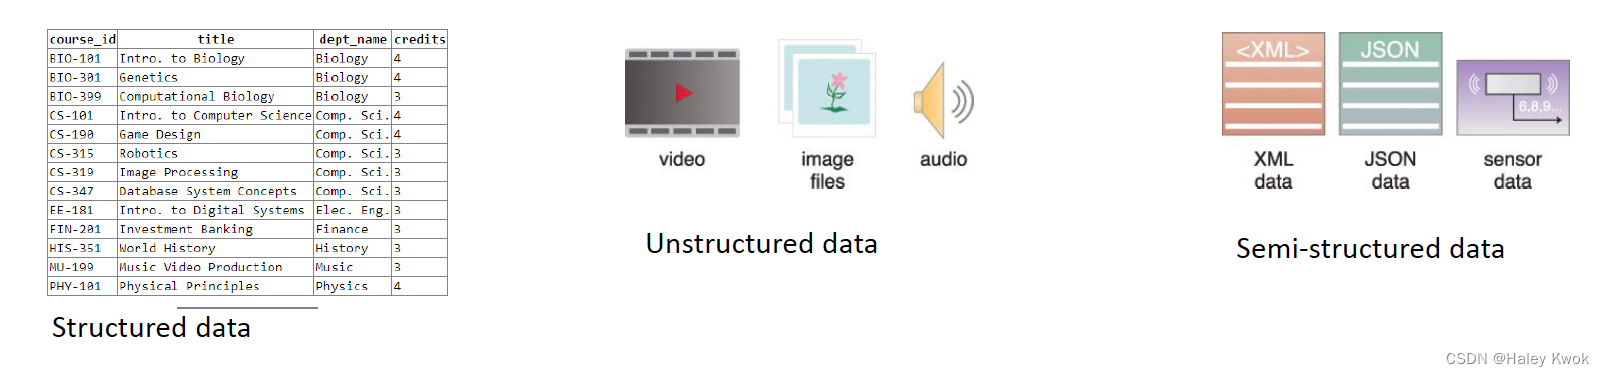
1.3 Structured vs. Unstructured data
Structured data
Data conforms to a data model or schema and is often stored in tabular form.
Unstructured data
Data that does not conform to a data model or data schema is known as unstructured data.
Estimated to makes up 80% of the data within any given enterprise.
Semi structured data
Non tabular structure, but conform to some level of structure.
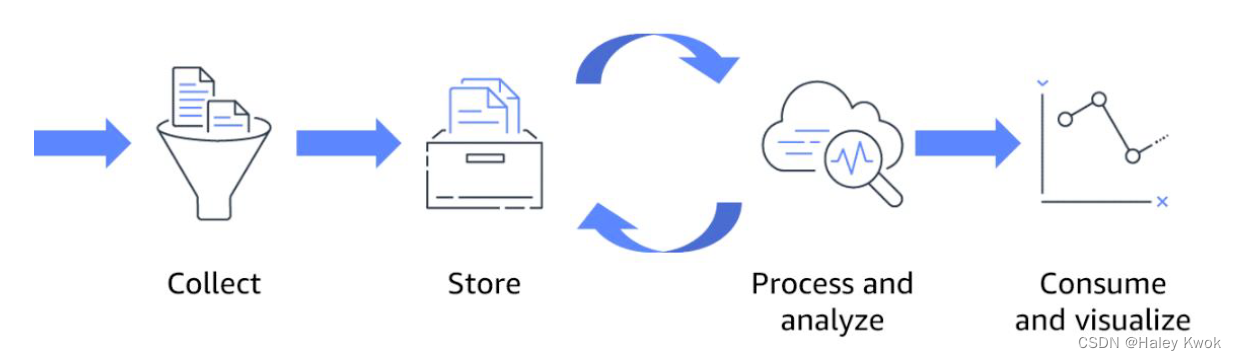
1.4 The big data processing cycle
1.4.1 Collect
Collecting the raw data such as transactions, logs, and mobile devices.
Permits developers to ingest a wide variety of data.
1.4.2 Store
Requires a secure, scalable, and durable repository to store data before or after the processing tasks.
1.4.3 Process and analyze
Data is transformed from its raw state into a consumable format.
Usually by means of sorting, aggregating, joining, and performing more advanced functions and algorithms.
The resulting datasets are then stored for further processing or made available for consumption with business intelligence and data visualization tools.
1.4.4 Consume and visualize
Data is made available to stakeholders through self service business intelligence and data visualization tools to allow fast and easy exploration of datasets.
Users might also consume the resulting data in the form of statistical predictions (in the case of predictive analytics) or recommended actions (in the case of prescriptive analytics)
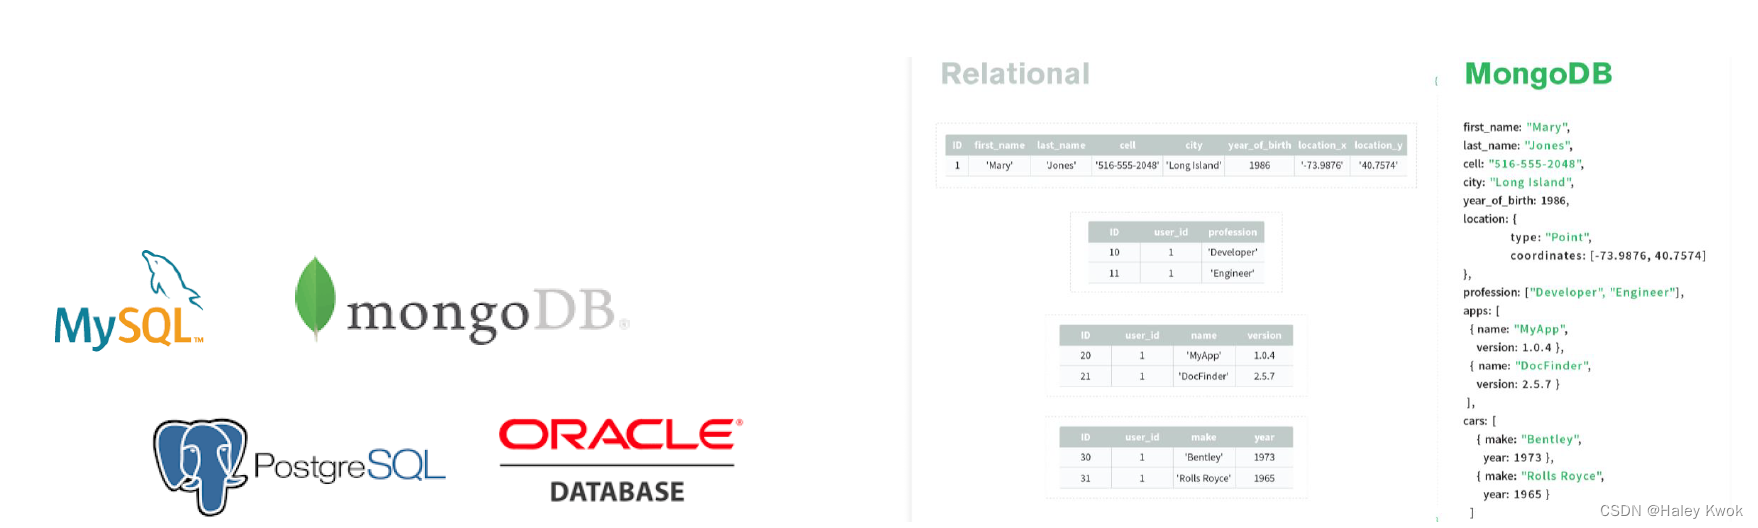
1.5 Databases
Designed to store and handle transaction data (live, real time data)
Relational databases (e.g. Mysql store data in tables with fixed rows and columns.
Non relational databases (NoSQL) store data in a variety of data models (e.g. JSON)
More flexible schema (how the data is organized)
1.6 Data Warehouse
Data warehouse is a giant database storing highly structured information that is optimized for analytics
Typically store current and historical data from one or more systems and disparate data sources
May not reflect the most up to date state of the data.
Business analysts and data scientists can connect data warehouses to explore the data, look for insights, and generate reports for business stakeholders.
Examples
Google BigQuery, Amazon
1.7 Extract, transform, load (ETL)
The ETL processes move data from its original source (e.g. database or other sources) to the data warehouse on a regular schedule (e.g., hourly or daily)
Extract : Extract data from homogeneous/heterogeneous
Transform: Clean the data and transform the data into appropriate format
Load: Insert data into the target data warehouse
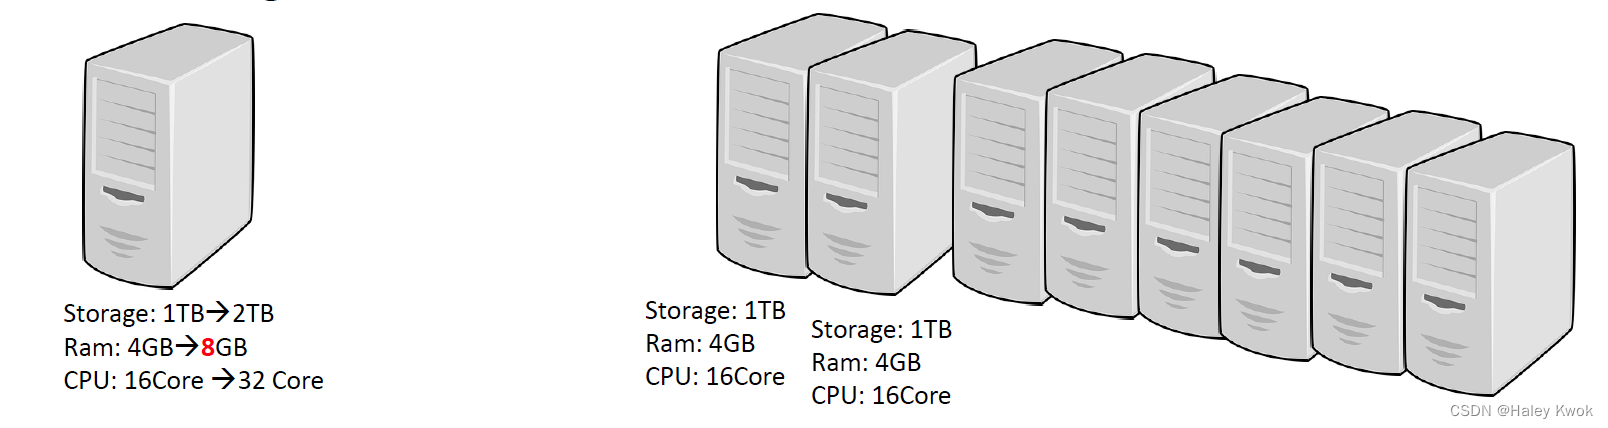
1.8 Solving the big data challenges
- Scaling up (Vertical scaling)
Have a supercomputer with enormous amounts of storage attached to an extremely fast network. Scaling out (Horizontal scaling)[A BETTER WAY]
Have a lot of smaller computers, each with a modest amount of storage, connected by networking.
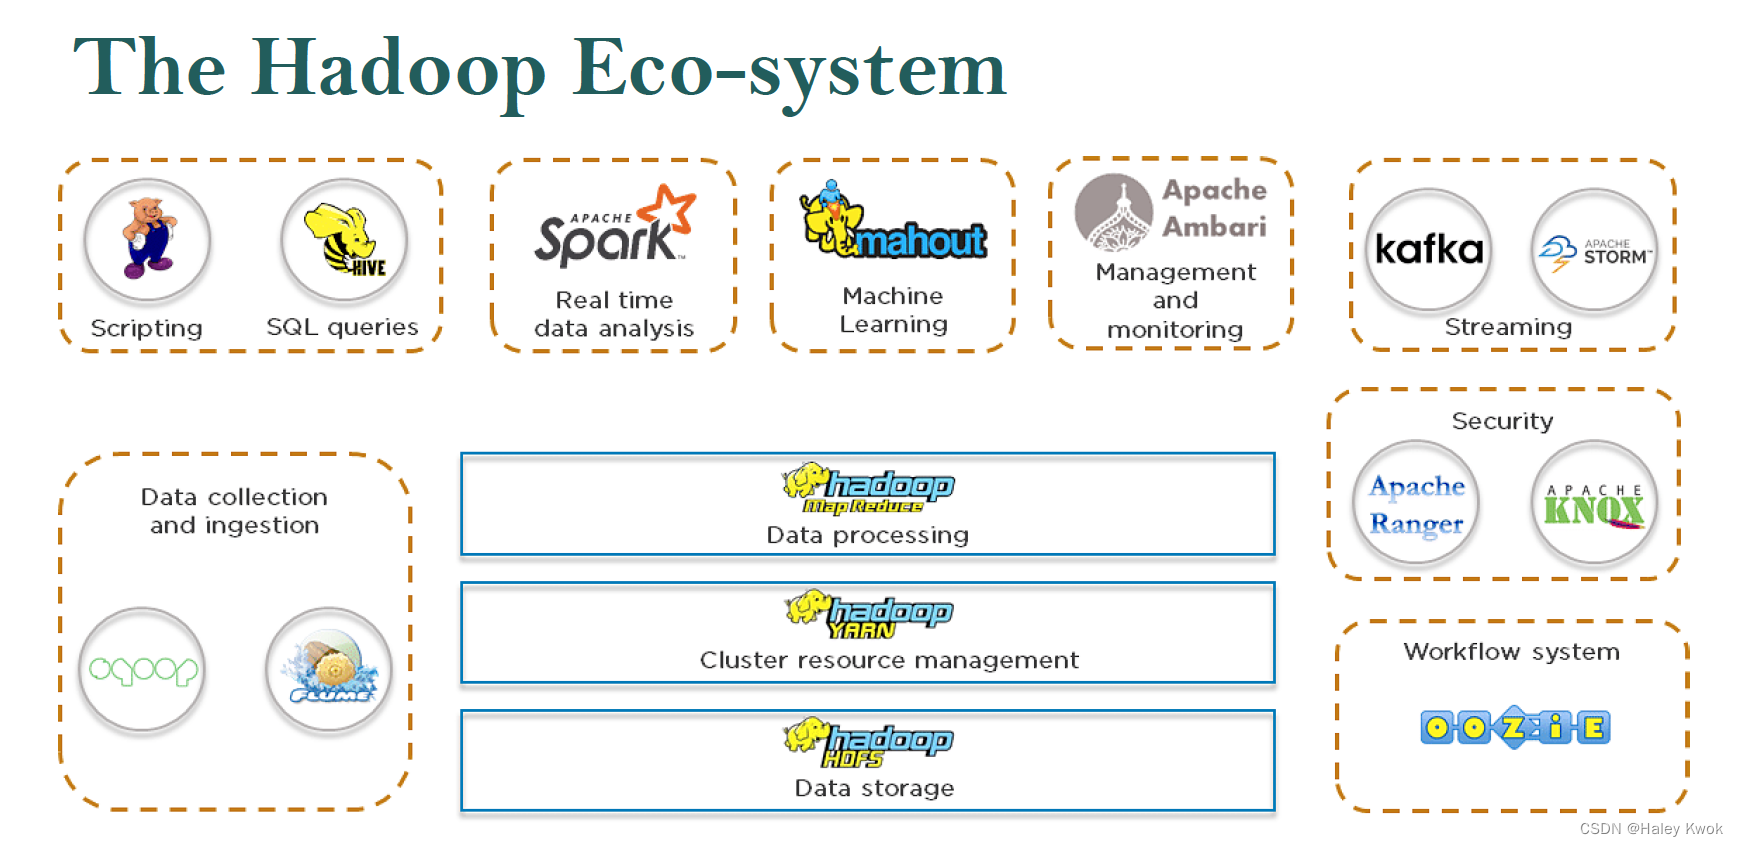
1.9 Processing of Big Data
The challenges of Big Data cannot be handled easily by traditional storage technology, e.g. databases
Hadoop
A framework that allows for storing a large amount of data and the distributed processing of
large data sets across clusters of computers
MapReduce
a programming paradigm that enables massive scalability across hundreds or thousands of
servers in a Hadoop cluster.
Apache Spark
An open source unified analytics engine for large scale data processing
2.0 Distributed File Systems
A cluster is a tightly coupled collection of servers, or nodes.
A distributed file system can allow us to store large files which spread across the nodes of a cluster
E.g. Hadoop Distributed File System (HDFS).
2.1 Hadoop
Splitting large dataset
Split large dataset into smaller data blocks and stored in different nodes.
In Hadoop, each block contains 128 MB of data and replicated three times by default.
Replication Factor: The number of times Hadoop framework replicate each and every data block.

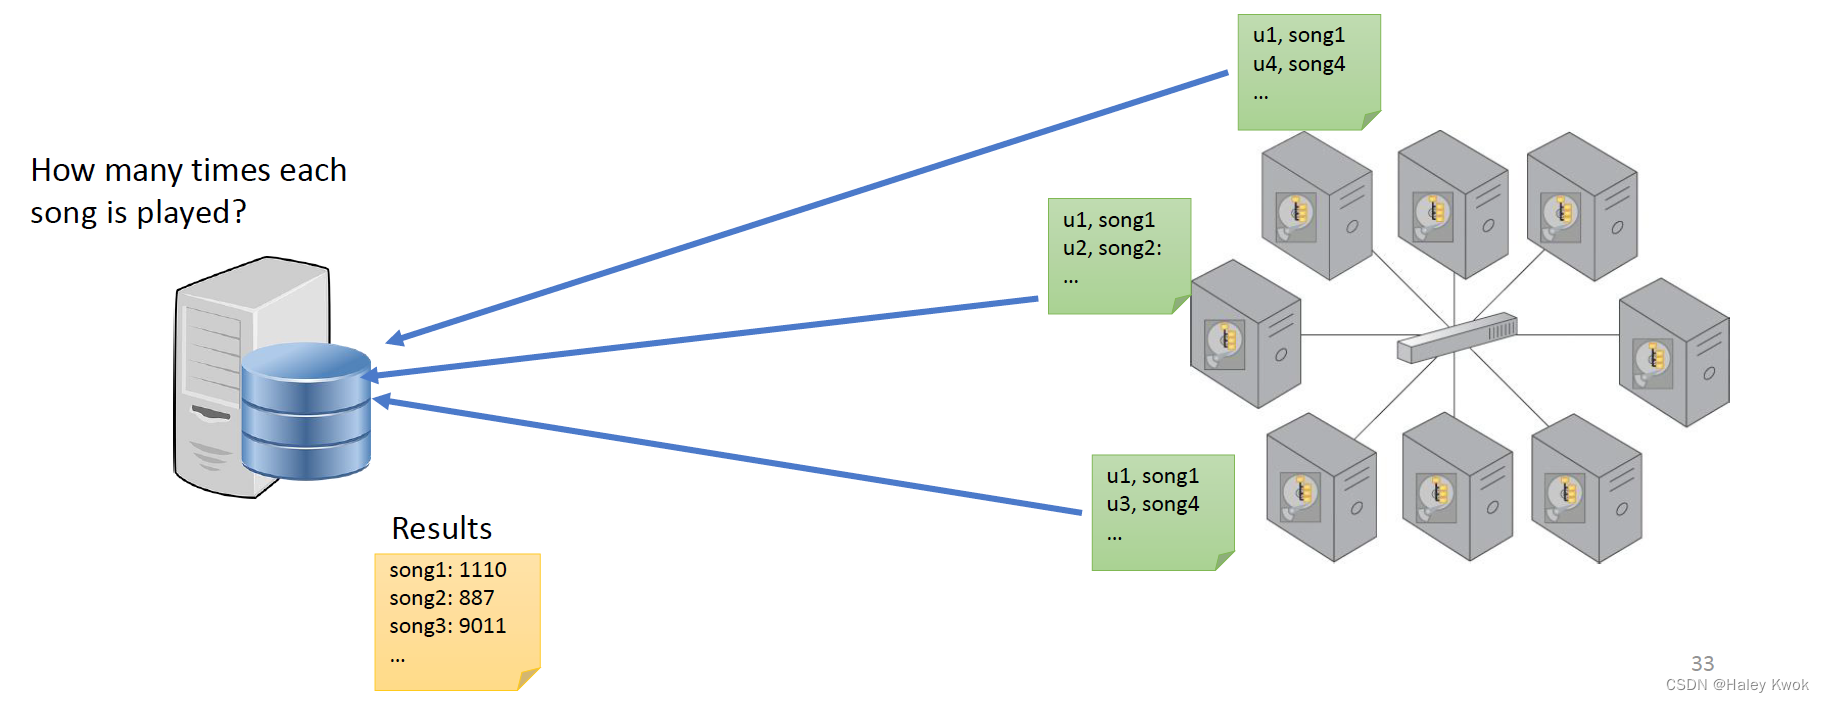
Traditional approach
Moving huge amount data to the processing unit is costly.
The processing unit becomes the bottleneck.
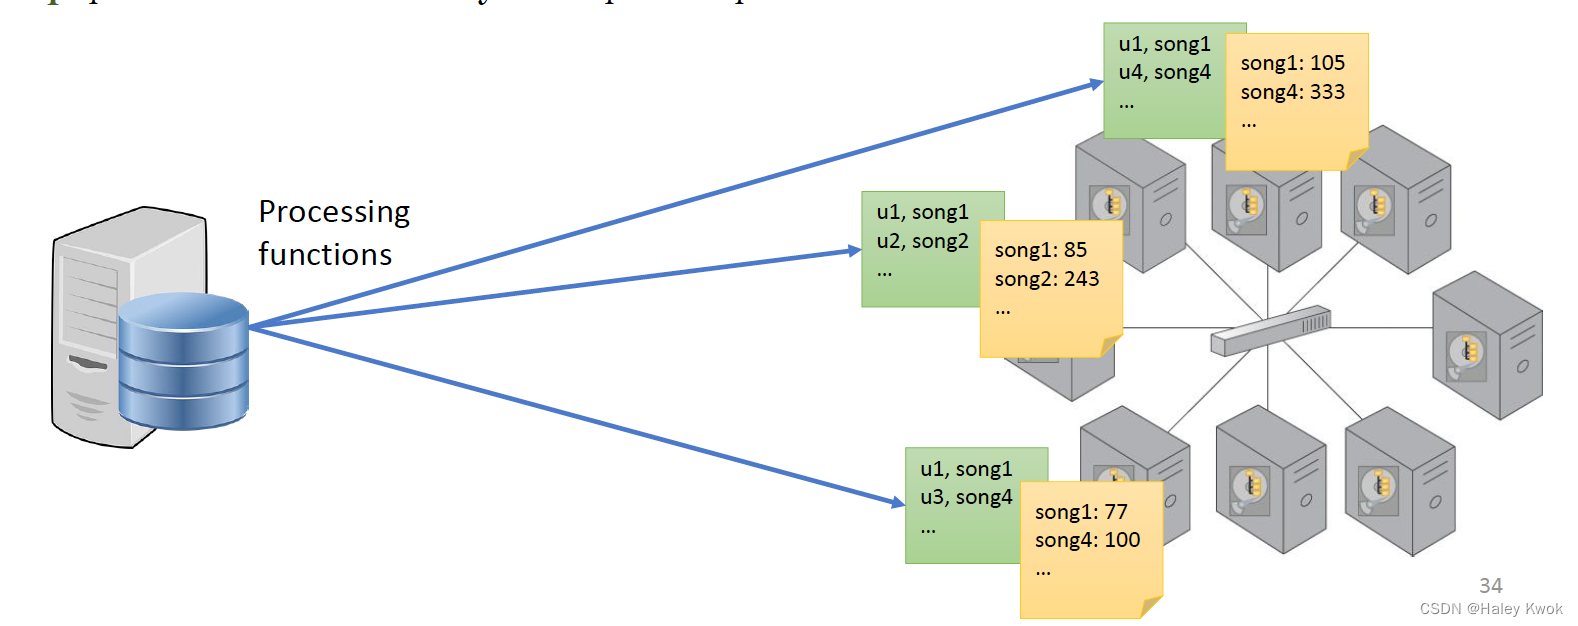
Map Function
Instead of moving data to the processing unit, we are moving the processing unit to the data
MapReduce consists of two distinct tasks Map and Reduce.
Map: process data to create key value pairs in parallel
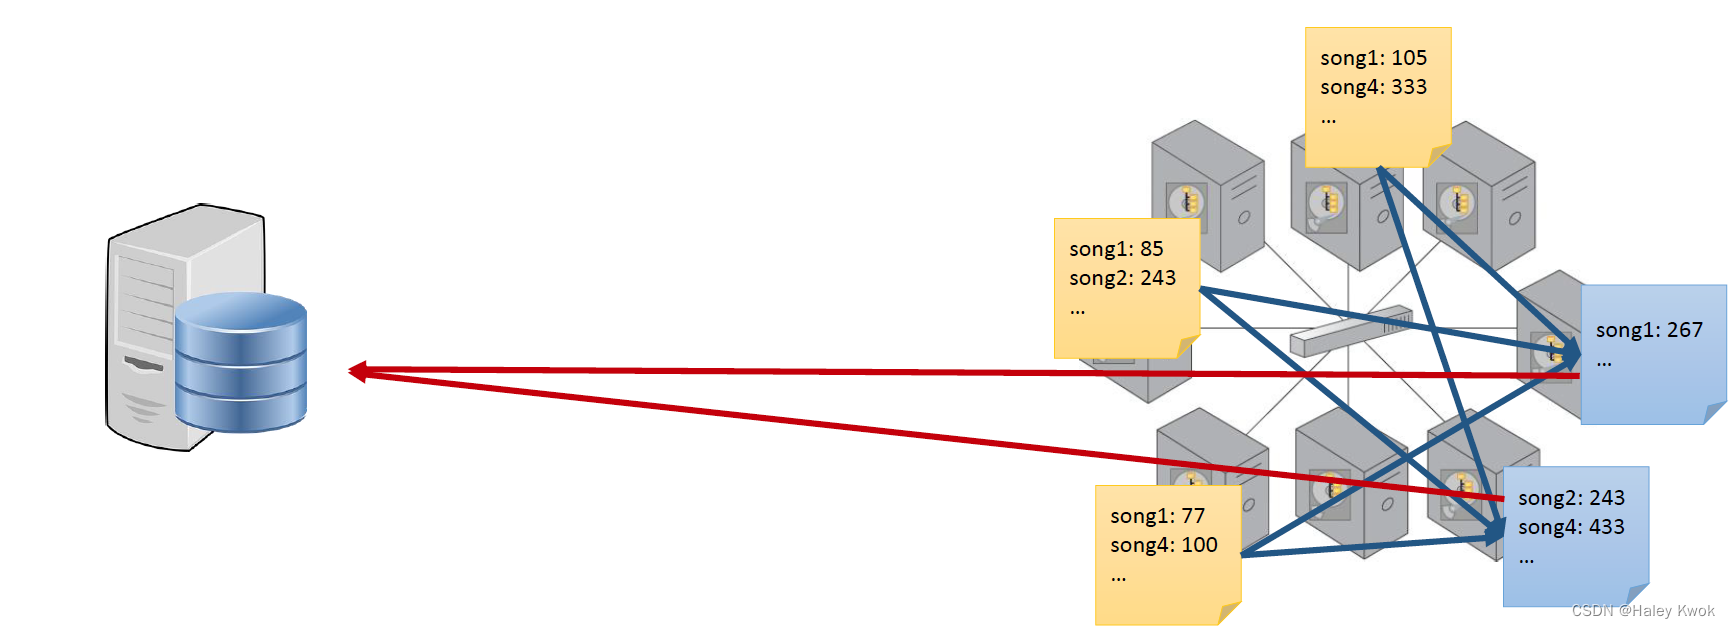
Reduce function
MapReduce consists of two distinct tasks Map and Reduce.
Map: process data by workers based on where data is stored
Reduce: Aggregate results by the “reduce workers”
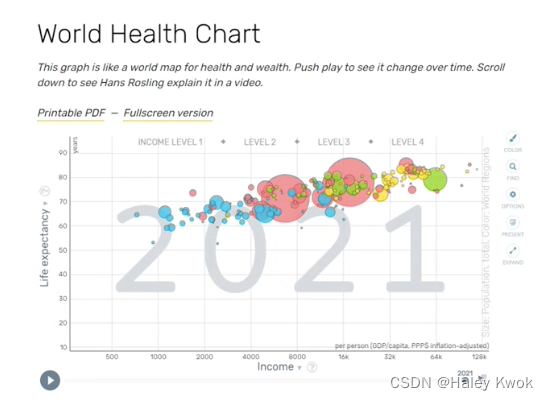
Visualization
Creation and study of the visual representation of data
One of the most important tools for data analytics/science.
Dashboards
Dashboard is a read only snapshot of an analysis that you can share with other users for reporting purposes.
Chapter 2: Overview of AI and Machine Learning
Autonomous Driving Car
Self driving vehicles or “driverless” cars
Combine sensors and software to control,
navigate, and drive the vehicle.
Drivers are NOT required to take control to safely operate the vehicle.
Vehicle/Object Detection
Classify and detect the objects in the image.
Assign a class to each object and draw a bounding box around it.
Disease Detection
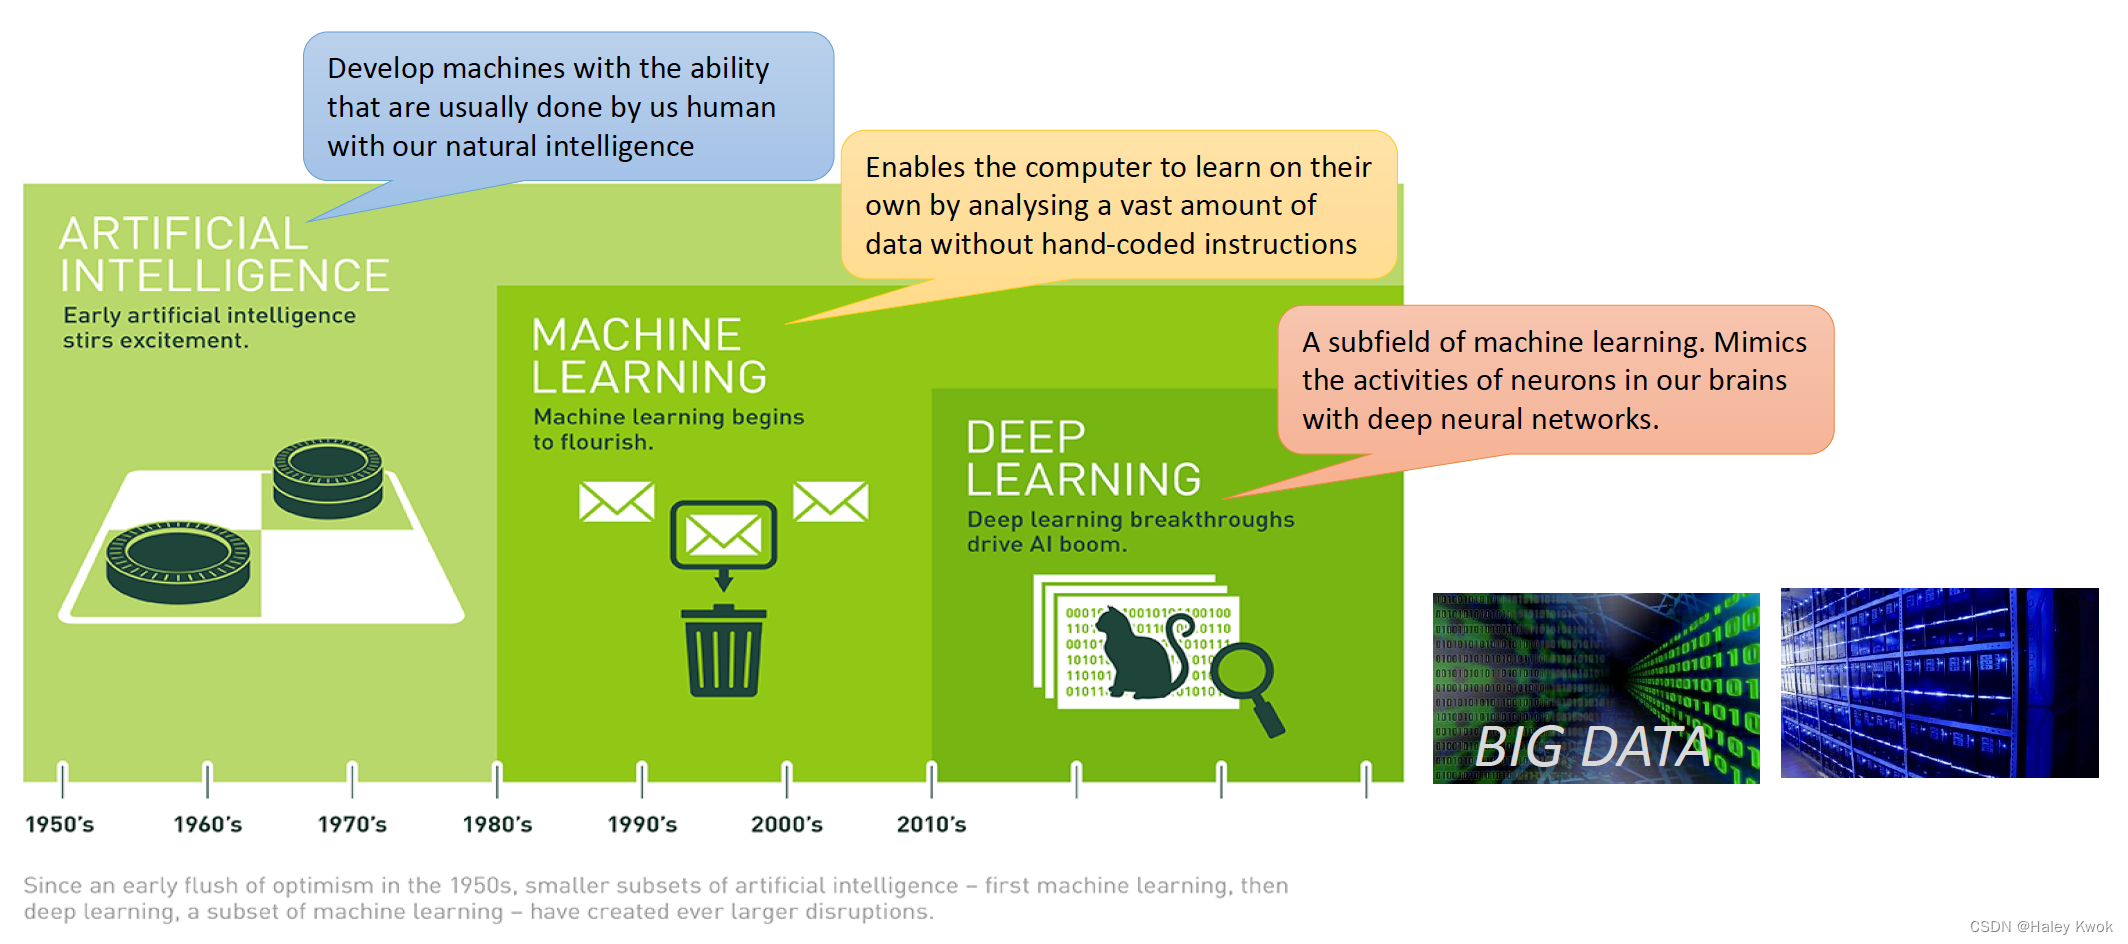
1. Subfields of Artificial Intelligence
AI is concerned with developing machines with the ability that are usually done by us humans with our natural intelligence
Computer Vision: Enabling computers to derive information from images and videos
Natural Language Processing (NLP): Giving computers the ability to understand text and spoken words
Speech Recognition
Machine Learning
Deep Learning
1.1 Image Classification
Image classification models take an image as input and return a prediction about which class the image belongs to.
Images are expected to have only one class for each image.
1.2 Object Detection
Takes an image as input and output the images with bounding boxes and labels on detected objects.
For example, Google Lens.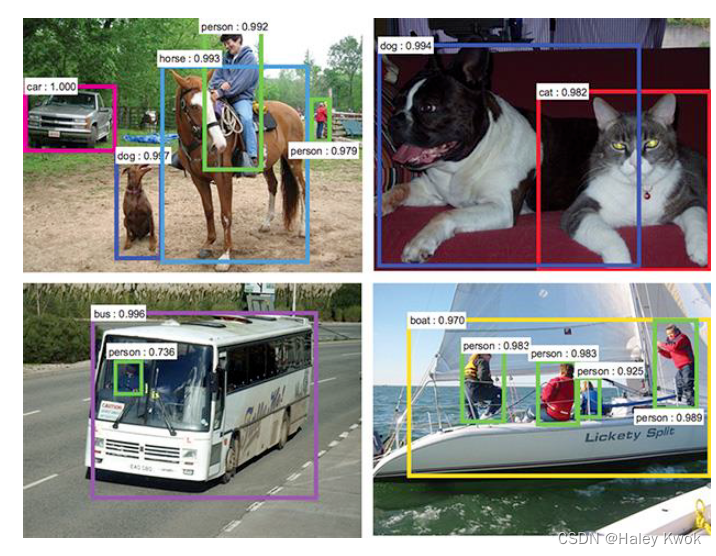
Automated Face analysis tasks
Face detection: Detect if there is a face in images/videos.
Face classification: Determine the kind of face
E.g. the Age, Gender and emotion of a person from the face
Face verification: One to one
Is it the same face (e.g. unlock your mobile phone)?
Face identification: One to many
E.g. Police search
1.3 Natural language processing (NLP)
The branch of artificial intelligence (AI) concerned with giving computers the ability to understand text and spoken words in much the same way human beings can.
Language Translation
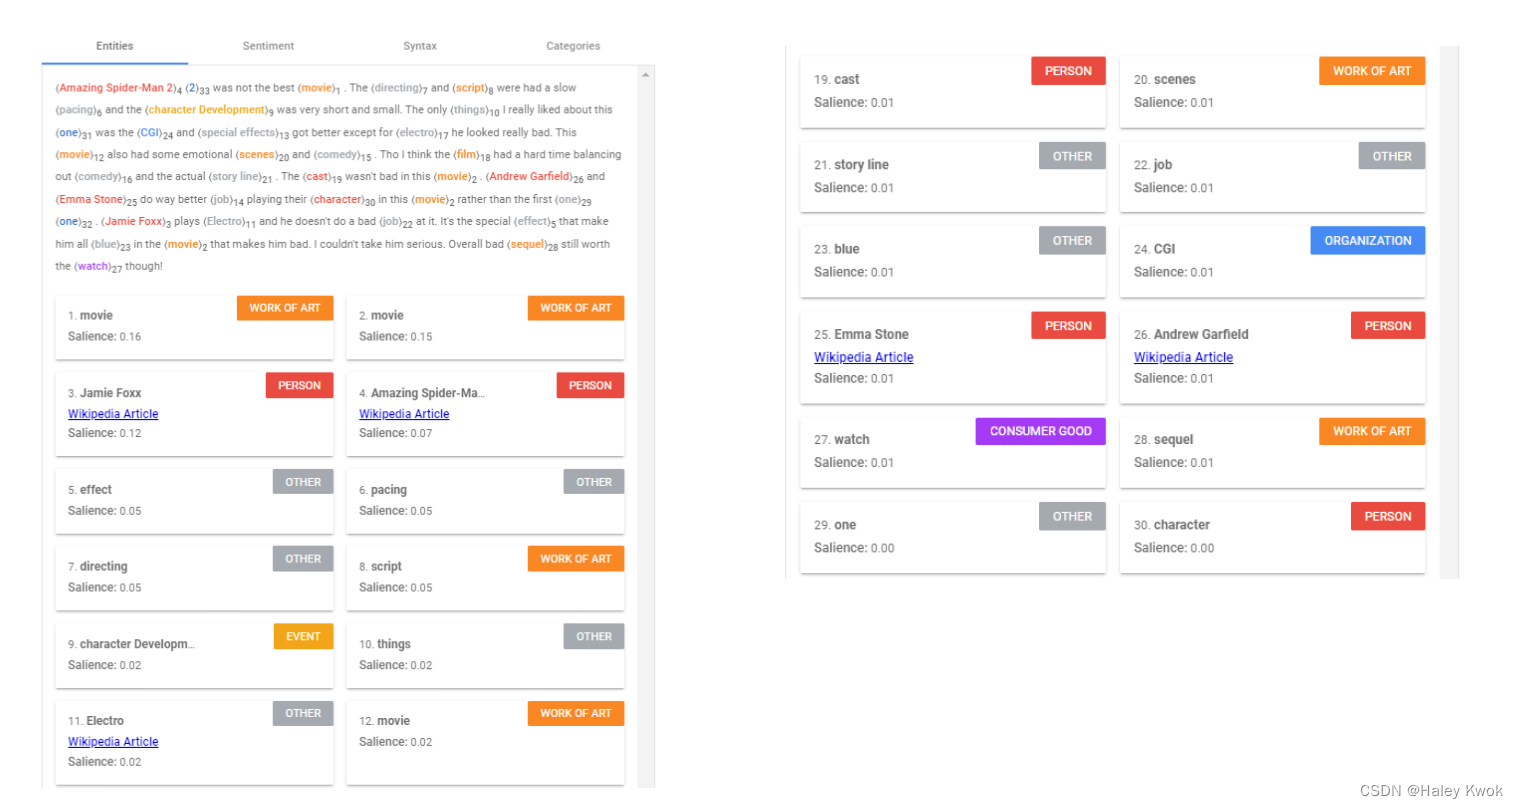
Sentiment analysis
Extract subjective qualities (e.g. attitude, emotion) from text.
Predict whether a movie review is positive or negative, based on the words in the movie
review.
Named Entity Recognition (NER)
Identify specific entities in a text, such as dates, individuals and places
1.4 Chatbots
Software application built to simulate a human like conversation.
Involve speech recognition, natural language processing and speech synthesis
Text to speech
Text to Speech (TTS) is the task of generating natural sounding speech given
text input.
May generates speech for multiple speakers and multiple languages.
Speech to text
Convert voice to text
AI, Machine Learning and Deep Learning
Example: Recognizing a digit
Let’s say that we want to teach a computer to recognize the number 7
Rules for distinguishing 7 from other characters
7s have a mostly horizontal line near the top of the figure
they have a mostly northeast southwest diagonal line
Those two lines meet in the upper right.
2. Problem: Rule-based approach

Finding a good and complete set of rules is frequently an overwhelmingly
difficult task.
The rules human experts follow are often not explicit
Easy to overlook exceptions and special cases
The technology, laws, and social conventions around human activities are
constantly changing
Constantly monitor, update, and repair this tangled web of interconnecting rules.
Learning by examples
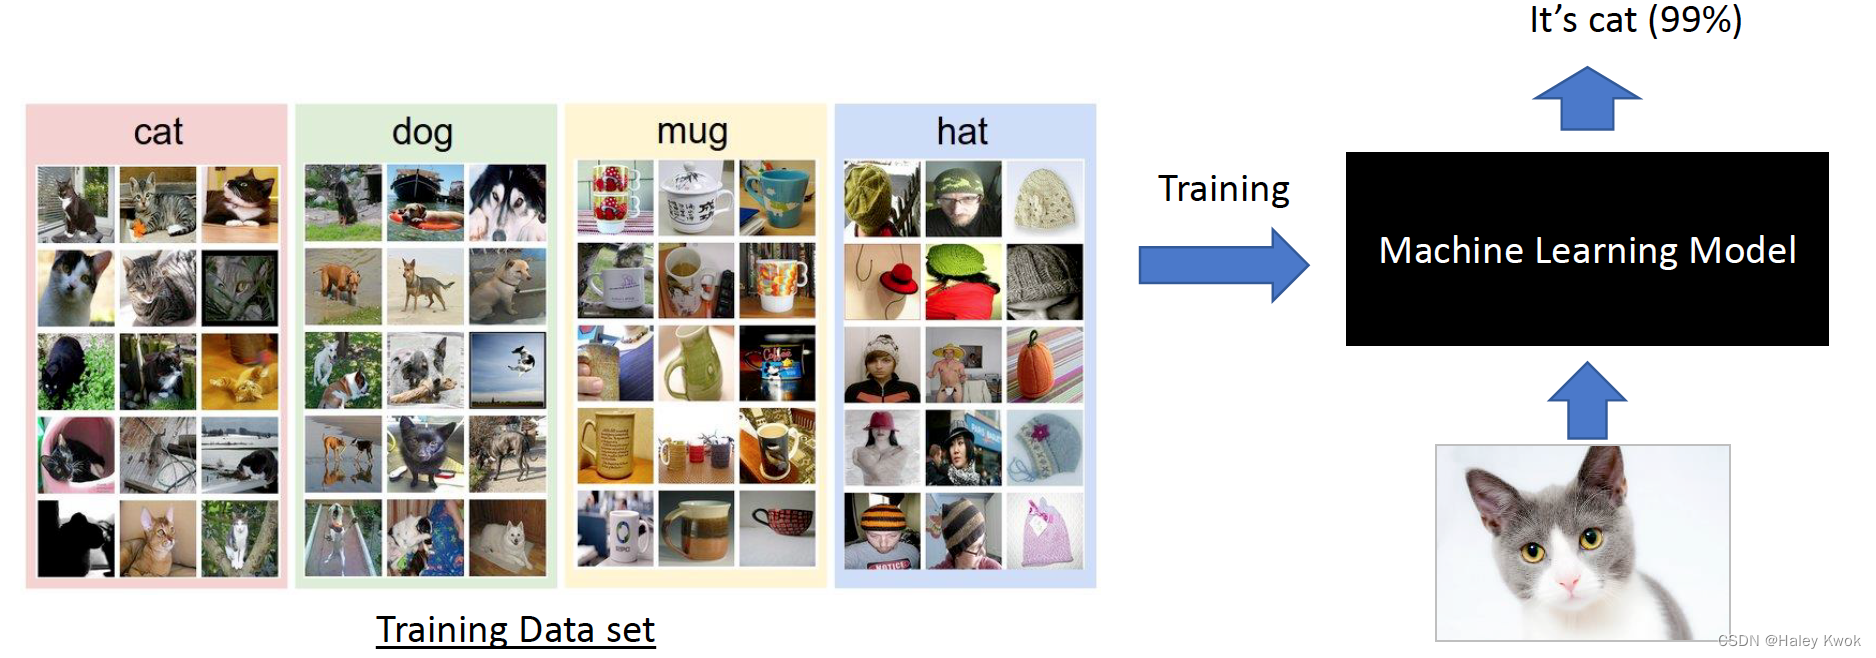
Provide many examples of each class of image
The computer looks at these examples and learn about the visual appearance and
features of each type of image
Learning the rules instead of coding the rule
3. Machine Learning
In ML, features are any property or characteristic of the data that the
model can use to make predictions
Spam Classifier
Spam : junk or unwanted email, such as chain letters, promotions, etc
Ham: non spam emails.
ImageNet
A large visual database designed for use in visual object recognition software research
More than 14 million images have been hand annotated by the project to indicate what objects are pictured, covering 100,000 classes
ImageNet contains more than 20,000 categories
E.g. “balloon” or “strawberry”, each consisting of several hundred images
4. ML models and algorithms
ML Model
A representation of reality using a set of rules that mimic the existing data as closely as possible
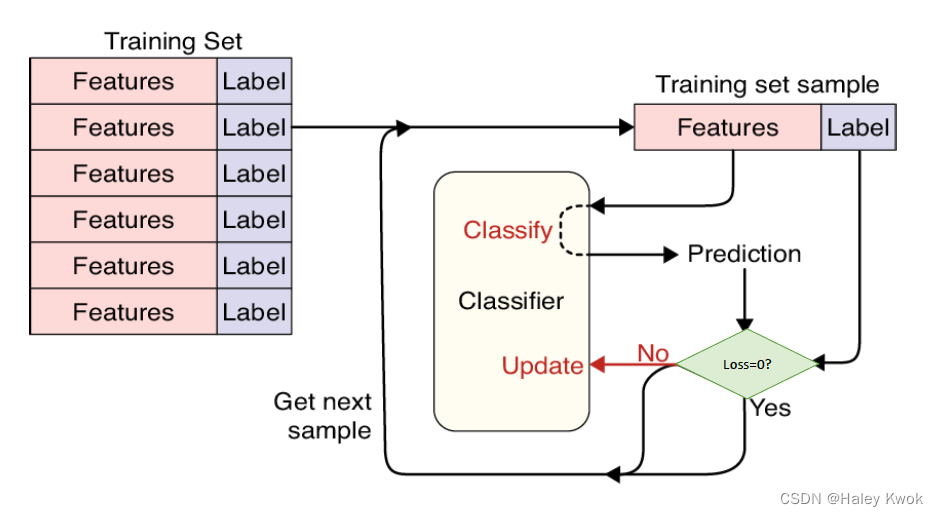
Training
Giving examples to a model so it can learn.
Split the dataset into two parts
Training set: Used to train the model
Test set: Used to test the accuracy of the model on data the model has never seen before during training
Algorithm
A procedure, or a set of steps, used to solve a problem or perform a computation
The goal of machine learning algorithms is to build a model for prediction
5. K-nearest neighbor
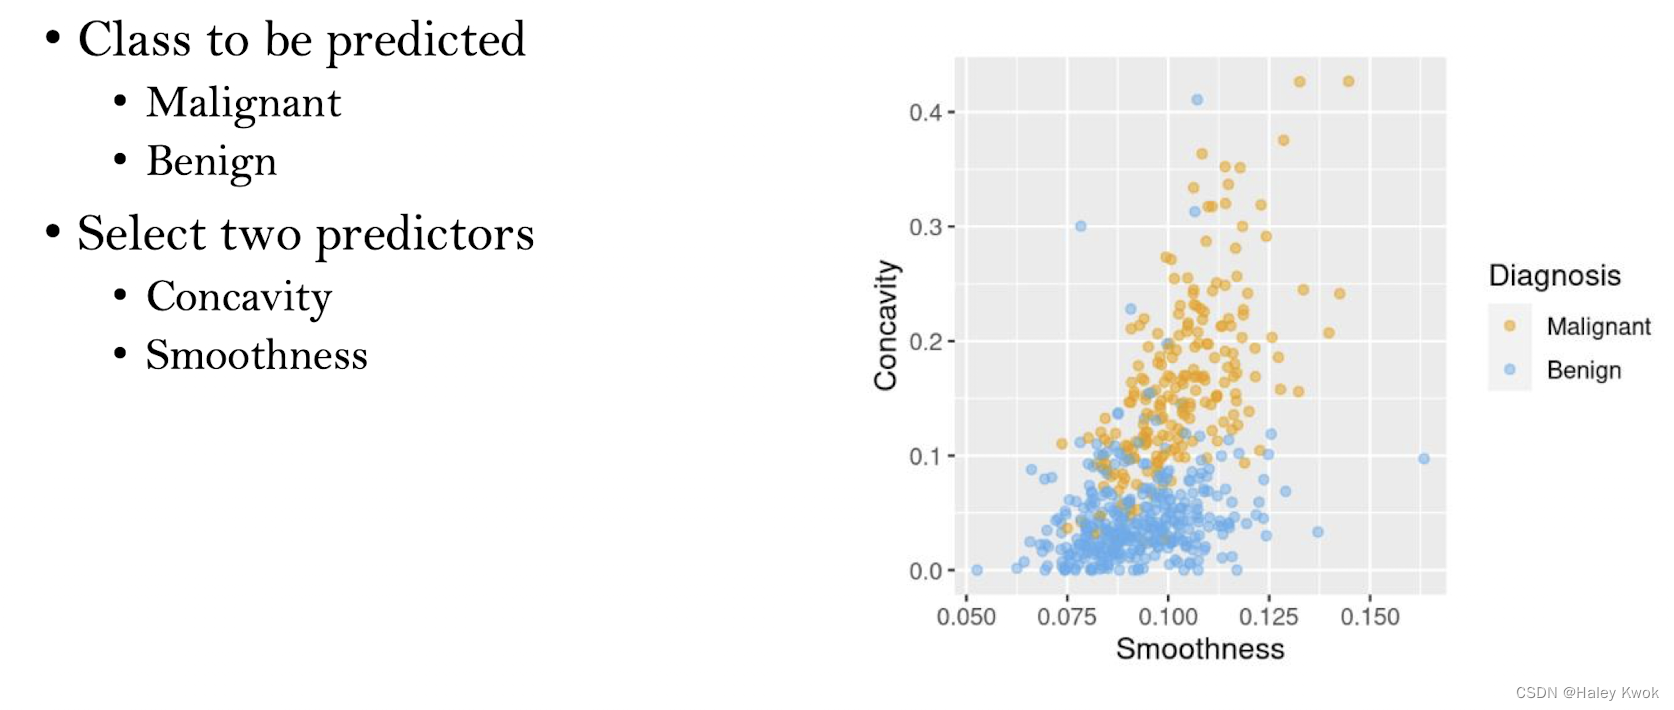
The nearest point to this new observation is malignant and located at the coordinates (2.1, 3.6).
If a point is close to another in the scatter plot, then the perimeter and concavity values
are similar.
We may expect that they would have the same diagnosis.
Classifying unlabelled examples by assigning them the class of similar labeled examples
“k”is a parameter that specifies the number of neighbors to consider when making
the classification.
Applications
Recommendation systems that predict whether a person will enjoy a movie or song
Identifying patterns in genetic data to detect specific proteins or diseases
Computer vision applications, including optical character recognition and facial recognition in
both still images and video.
3-nearest neighbor
To improve the prediction we can consider several
neighboring points
Among those 3 closest points, we use the majority class as our prediction for the new observation
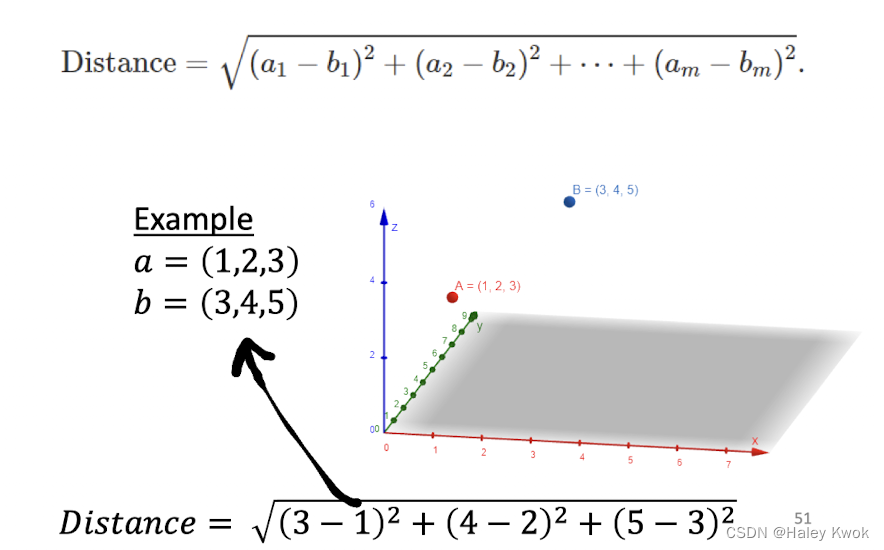
Euclidian Distance
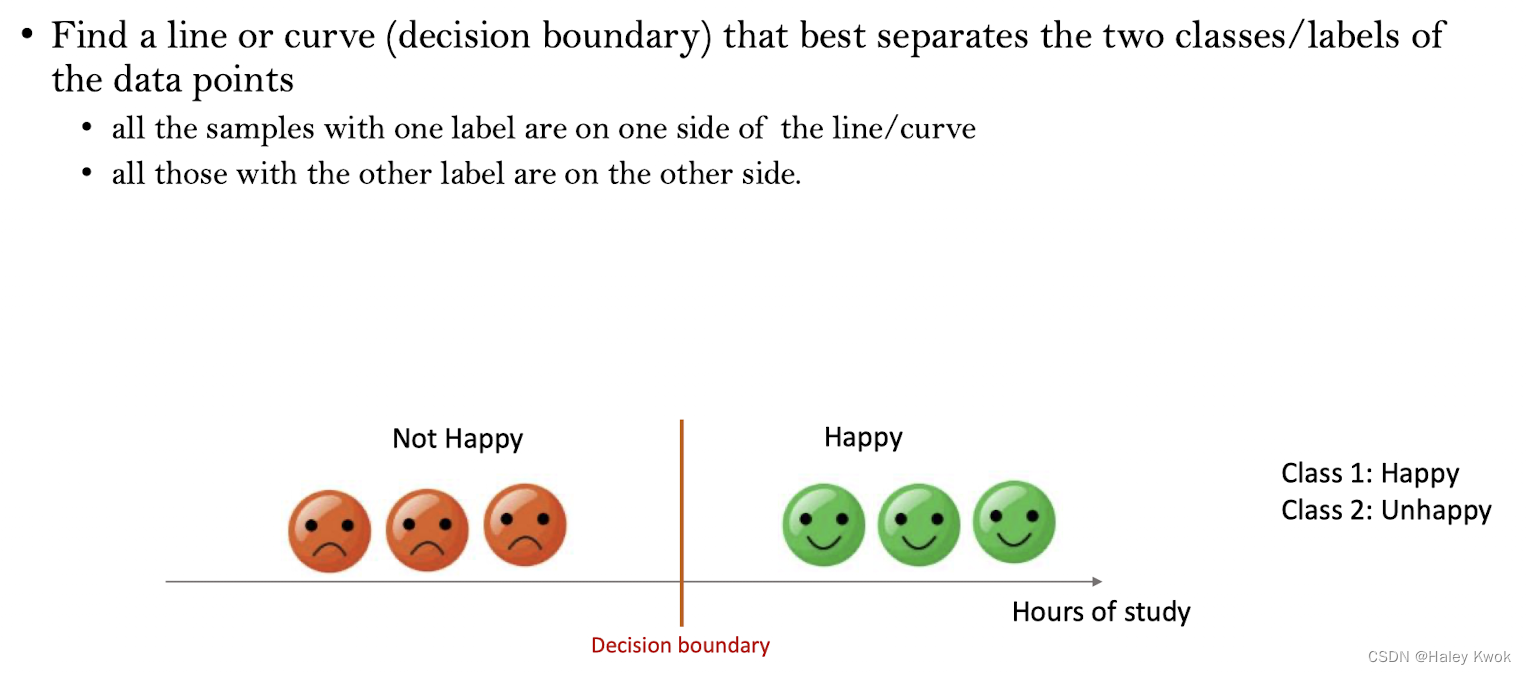
Boundary method
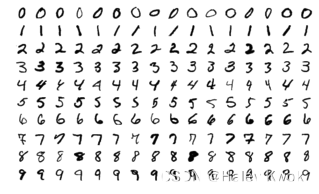
Hand-writing digit recognition
MNIST handwritten digit database
Ground Truth
Ground truth is information that is known to be real or true.
Training and Loss
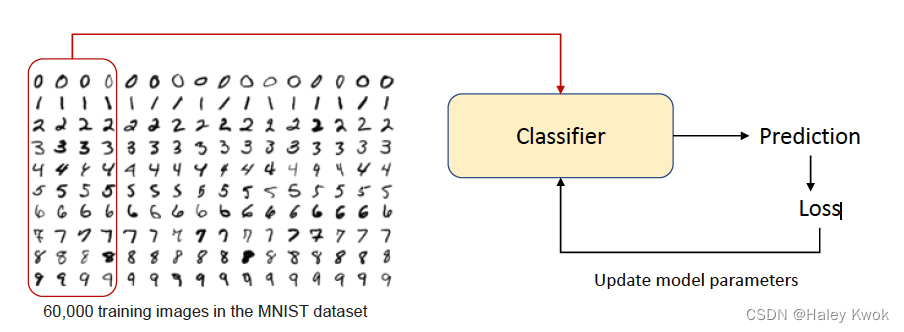
Epoch
The number of epochs is a hyperparameter that defines the number of times that the learning algorithm will work through the entire training dataset.
In each epoch, each sample in the training dataset has had an opportunity to update the internal model parameters.
• In the first epoch, AI may make large prediction errors
• Feed the training data to AI multiple times to learn from the mistakes and reduce the prediction errors
Batch size
Due to computational and memory limits, we generally don’t feed the entire training set to the AI model
• Break down the training data into smaller batches which are fed to the model individually
• The batch size is a hyperparameter that defines the number of samples to work through before
Hyper-parameters
Any quantity that the model creates or modifies during the training process is a parameter
• We can twist many other knobs before training a model
• E.g. the number of epochs, batch size, the “k” value in k nearest neighbor, learning rate (more about it later), etc
• Any quantity that you set before the training process is a hyperparameter
Overfitting
The word overfitting refers to a model that models the training data well but it fails to generalize
6. Types of Machine Learning
Supervised Learning
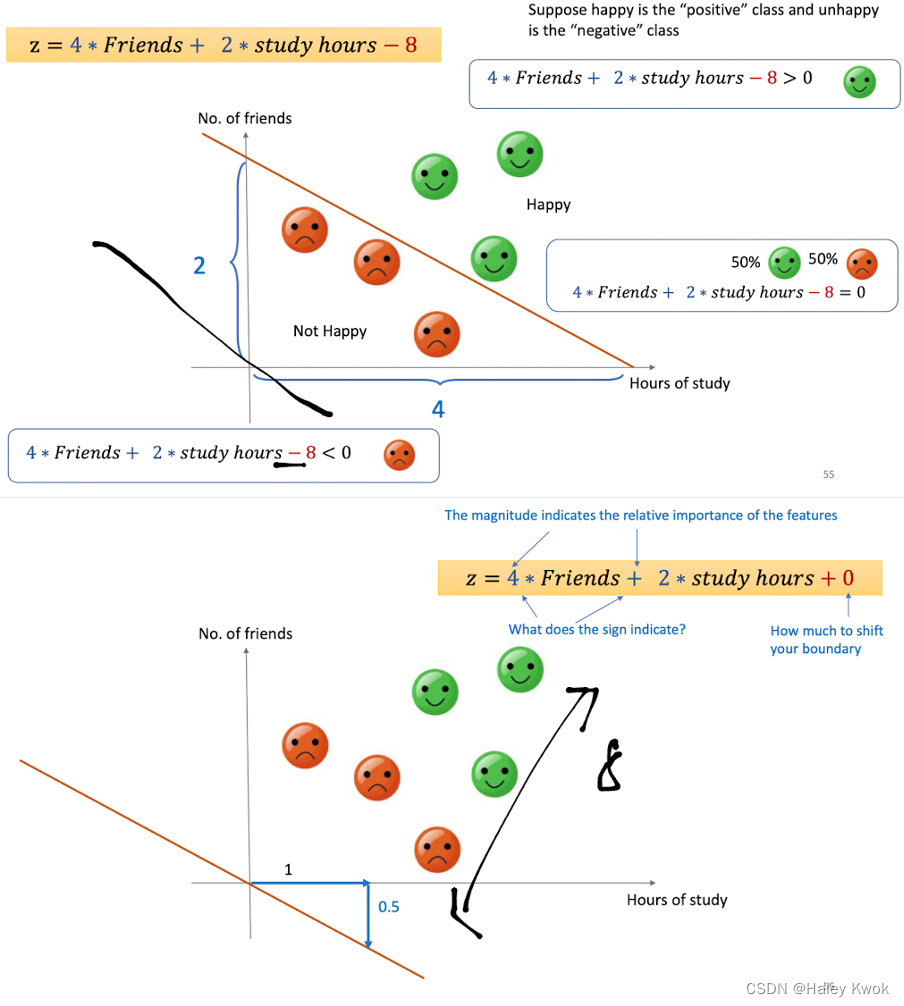
Classification (Binary/Multiclass)
Use attributes (𝑥1,𝑥2,….) to predict a categorical variable (𝑦) yes/no, rain/no rain
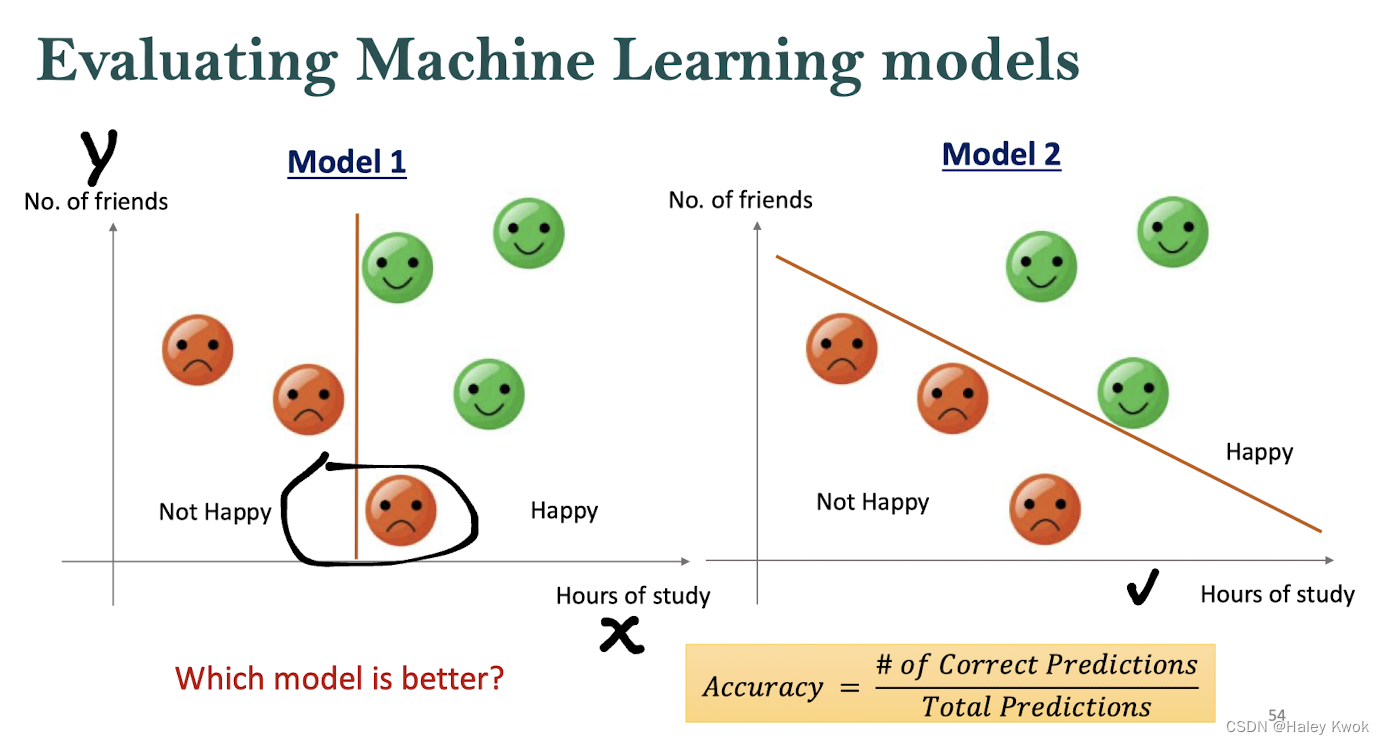
Evaluation of Model
Positive vs. Negative Class
Confusion Matrix
Validation Set
To validate which model to use: Cross Validation
In the case of small data sets (say, less than 1,000 observations), a very popular scheme is cross-validation
• The data is split into K folds (e.g., 5). A model is trained on K − 1 training folds and tested on the remaining validation fold.
• This is repeated for all possible validation folds resulting in K performance estimates that can then be averaged

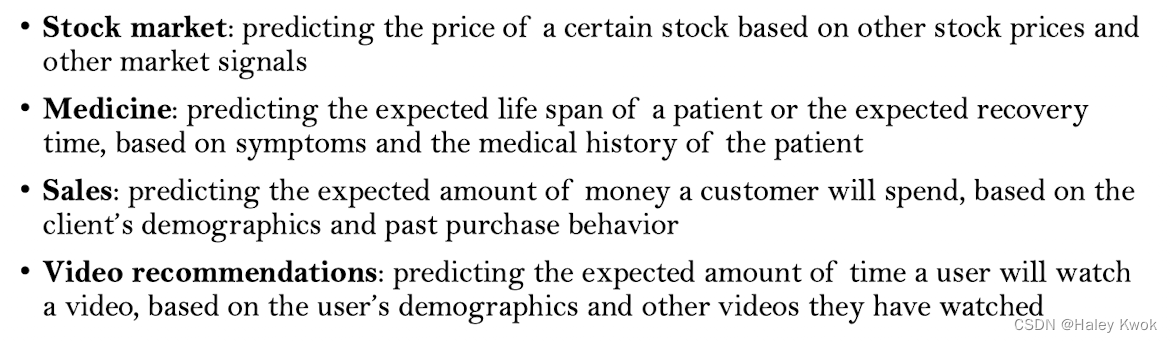
Regression
y = f ( x 1 , x 2 , x 3 , . . . ) y = f(x_1, x_2, x_3, ...) y=f(x1,x2,x3,...)
Use attributes (𝑥1,𝑥2,….) to predict a numerical variable (𝑦).
The output of a regression model is a number, e.g. prices, sizes, or weights.
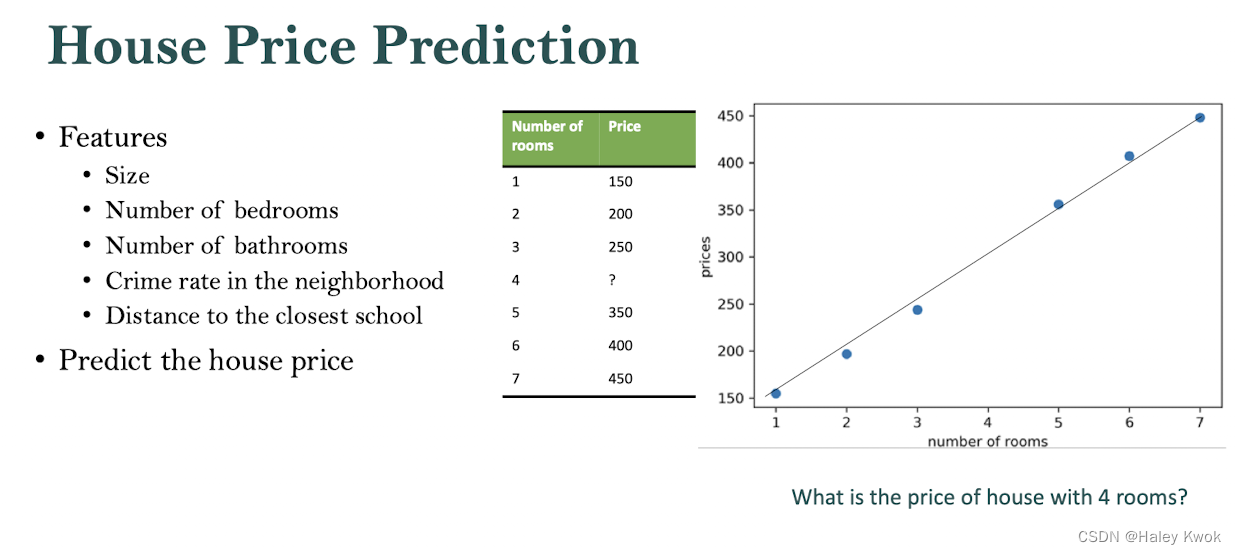
Examples
 最低0.47元/天 解锁文章


 被折叠的 条评论
为什么被折叠?
被折叠的 条评论
为什么被折叠?
 到【灌水乐园】发言


