


Aspose.Words For .Net是一种高级Word文档处理API,用于执行各种文档管理和操作任务。API支持生成,修改,转换,呈现和打印文档,而无需在跨平台应用程序中直接使用Microsoft Word。此外,API支持所有流行的Word处理文件格式,并允许将Word文档导出或转换为固定布局文件格式和最常用的图像/多媒体格式。
接下来我们将进入关于“使用图表”的介绍,在Aspose.Words中学会关于ChartSeries类的相关,包括使用单个ChartSeries类、使用ChartSeries的单个图表数据点、使用单个ChartSeries的图表数据标签。
>>Aspose.Words for .NET更新至最新版,支持转换为PDF 1.7标准,点击下载体验
欢迎下载|体验更多Aspose文档管理产品或 加入Aspose技术交流群(761297826)
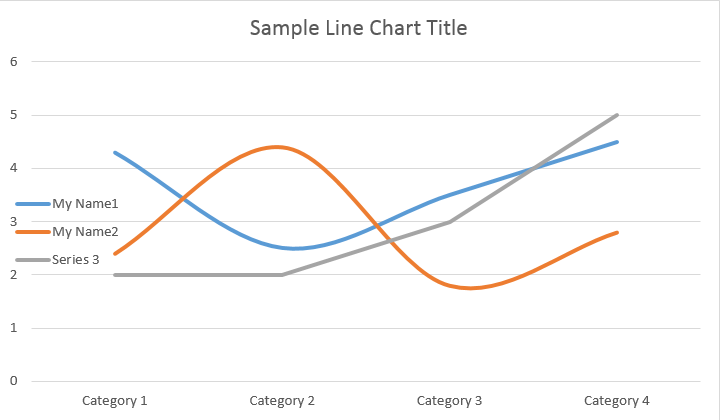
使用单个ChartSeries类
以下是处理特定系列的方法。
// Get first series.
ChartSeries series0 = shape.Chart.Series[0];

// Get second series.
ChartSeries series1 = shape.Chart.Series[1];

// Change first series name.
series0.Name = "My Name1";

// Change second series name.
series1.Name = "My Name2";

// You can also specify whether the line connecting the points on the chart shall be smoothed using Catmull-Rom splines.
series0.Smooth = true;
series1.Smooth = true;
请查看结果如下:
所有单个ChartSeries都有默认的ChartDataPoint选项,请尝试使用以下代码进行更改:
// Specifies whether by default the parent element shall inverts its colors if the value is negative.
series0.InvertIfNegative = true;

// Set default marker symbol and size.
series0.Marker.Symbol = MarkerSymbol.Circle;
series0.Marker.Size = 15;

series1.Marker.Symbol = MarkerSymbol.Star;
series1.Marker.Size = 10;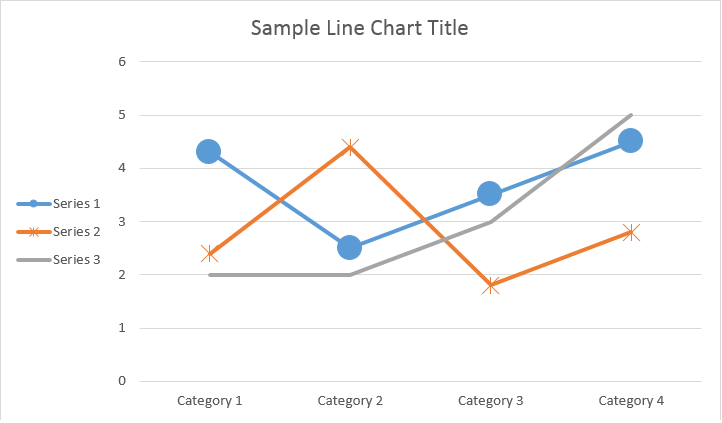
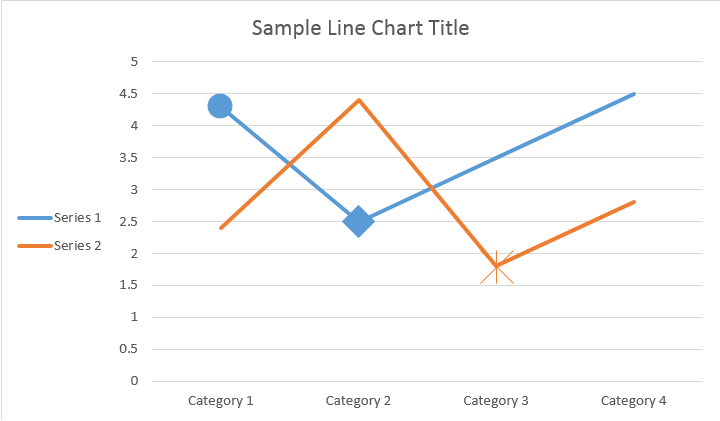
如何使用ChartSeries的单个ChartDataPoint
使用ChartDataPoint,可以自定义图表系列的单个数据点的格式。
// The path to the documents directory.
string dataDir = RunExamples.GetDataDir_WorkingWithCharts();
Document doc = new Document();
DocumentBuilder builder = new DocumentBuilder(doc);

Shape shape = builder.InsertChart(ChartType.Line, 432, 252);
Chart chart = shape.Chart;

// Get first series.
ChartSeries series0 = shape.Chart.Series[0];
// Get second series.
ChartSeries series1 = shape.Chart.Series[1];
ChartDataPointCollection dataPointCollection = series0.DataPoints;

// Add data point to the first and second point of the first series.
ChartDataPoint dataPoint00 = dataPointCollection.Add(0);
ChartDataPoint dataPoint01 = dataPointCollection.Add(1);

// Set explosion.
dataPoint00.Explosion = 50;

// Set marker symbol and size.
dataPoint00.Marker.Symbol = MarkerSymbol.Circle;
dataPoint00.Marker.Size = 15;

dataPoint01.Marker.Symbol = MarkerSymbol.Diamond;
dataPoint01.Marker.Size = 20;

// Add data point to the third point of the second series.
ChartDataPoint dataPoint12 = series1.DataPoints.Add(2);
dataPoint12.InvertIfNegative = true;
dataPoint12.Marker.Symbol = MarkerSymbol.Star;
dataPoint12.Marker.Size = 20;
dataDir = dataDir + @"SingleChartDataPoint_out.docx";
doc.Save(dataDir);
请查看结果如下:
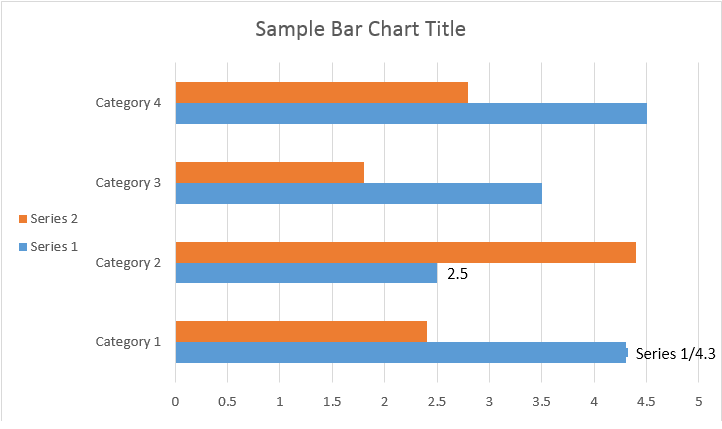
如何使用单个ChartSeries的ChartDataLabel
使用ChartDataLabel,您可以指定图表系列的单个数据标签的格式,例如显示/隐藏LegendKey,CategoryName,SeriesName,Value等。
Document doc = new Document();
DocumentBuilder builder = new DocumentBuilder(doc);

Shape shape = builder.InsertChart(ChartType.Bar, 432, 252);
Chart chart = shape.Chart;

// Get first series.
ChartSeries series0 = shape.Chart.Series[0];
ChartDataLabelCollection dataLabelCollection = series0.DataLabels;

// Add data label to the first and second point of the first series.
ChartDataLabel chartDataLabel00 = dataLabelCollection.Add(0);
ChartDataLabel chartDataLabel01 = dataLabelCollection.Add(1);

// Set properties.
chartDataLabel00.ShowLegendKey = true;

// By default, when you add data labels to the data points in a pie chart, leader lines are displayed for data labels that are
// Positioned far outside the end of data points. Leader lines create a visual connection between a data label and its
// Corresponding data point.
chartDataLabel00.ShowLeaderLines = true;

chartDataLabel00.ShowCategoryName = false;
chartDataLabel00.ShowPercentage = false;
chartDataLabel00.ShowSeriesName = true;
chartDataLabel00.ShowValue = true;
chartDataLabel00.Separator = "/";
chartDataLabel01.ShowValue = true;
dataDir = dataDir + @"SimpleBarChart_out.docx";
doc.Save(dataDir);
请查看结果如下:


 1216
1216


 被折叠的 条评论
为什么被折叠?
被折叠的 条评论
为什么被折叠?
 到【灌水乐园】发言


