


目录
声明:无论绘制哪种图形,如果需要生成复合图,只需多调用一次方法即可。每调用一次方法,就会生成一条曲线。
一、官网文档地址
本文内容来自于官网,选取了官网的一些比较好用的功能展示,如需学习更多功能,请访问以上的官网链接。谢谢。
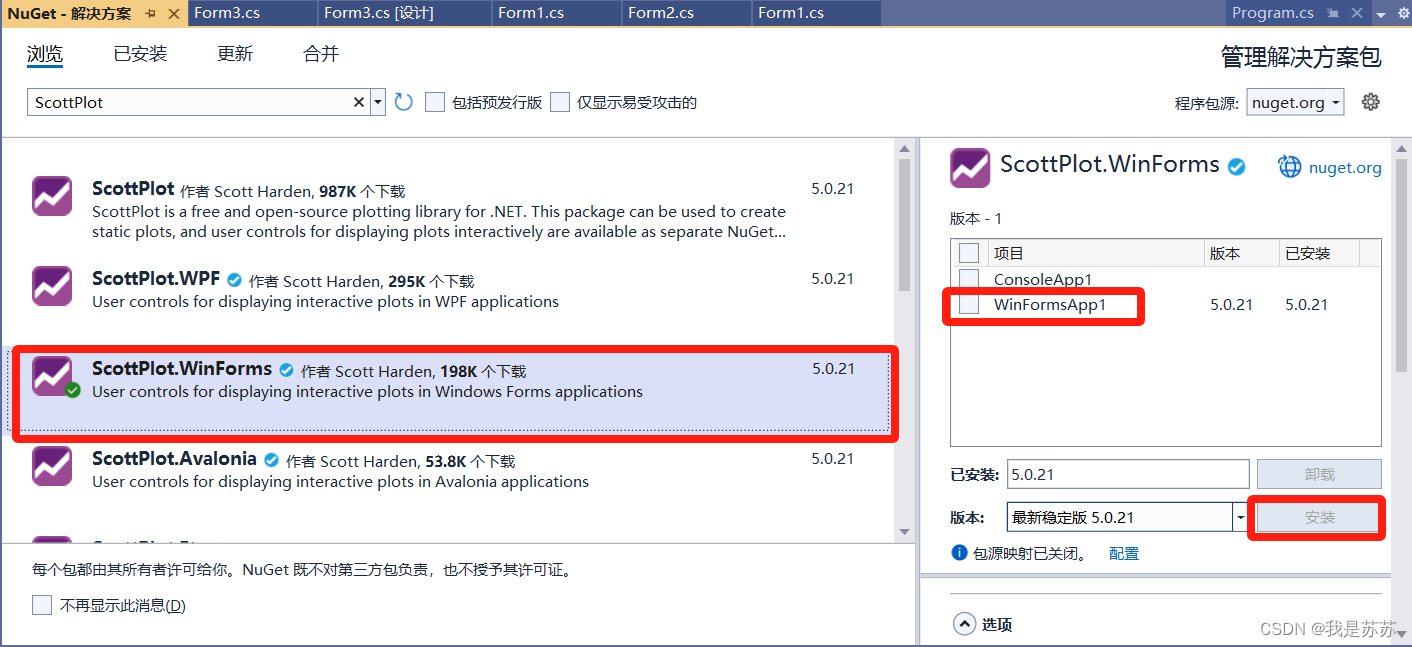
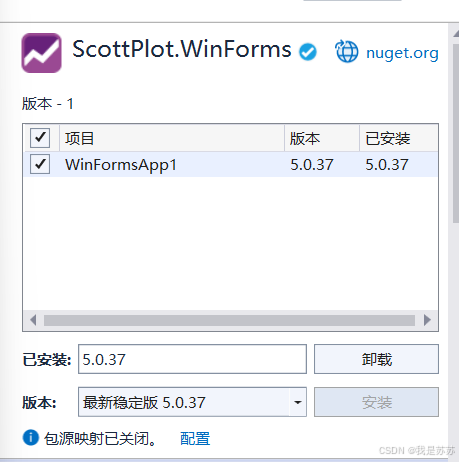
二、在VS2022中安装Scottplot
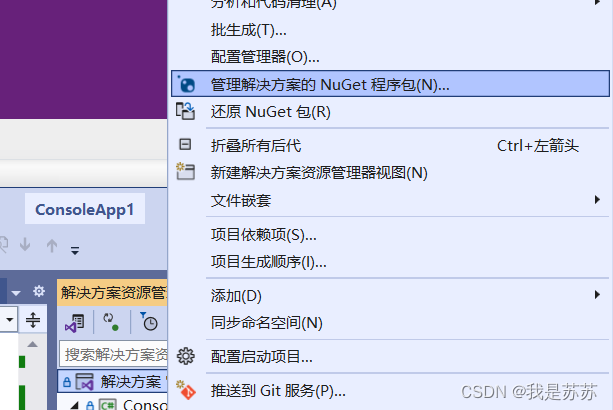
由于我用的是winforms,所以下载下图红框框winforms版本的(此时我的VS2022框架是.NET8,虽然下图支持到.NET6,但是可以照常使用,第一个我试过下载用不了,因此选择红框那个ScottPlot.Winforms即可)
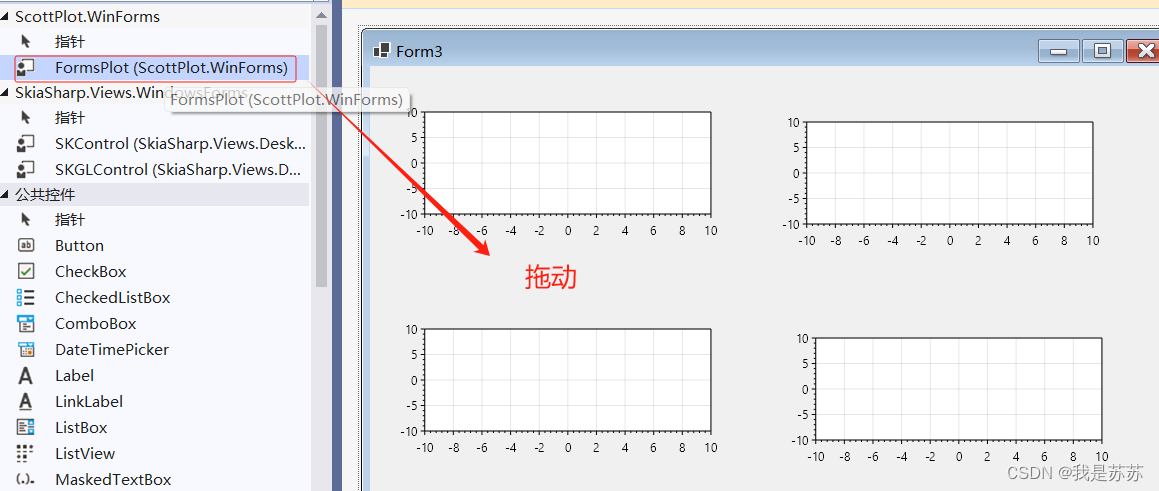
三、拖动Scottplot
下载成功后工具箱会自动更新该控件,我们此时可以创建一个窗体,点击视图-工具箱,找到下图红框的这个控件并且拖动进去
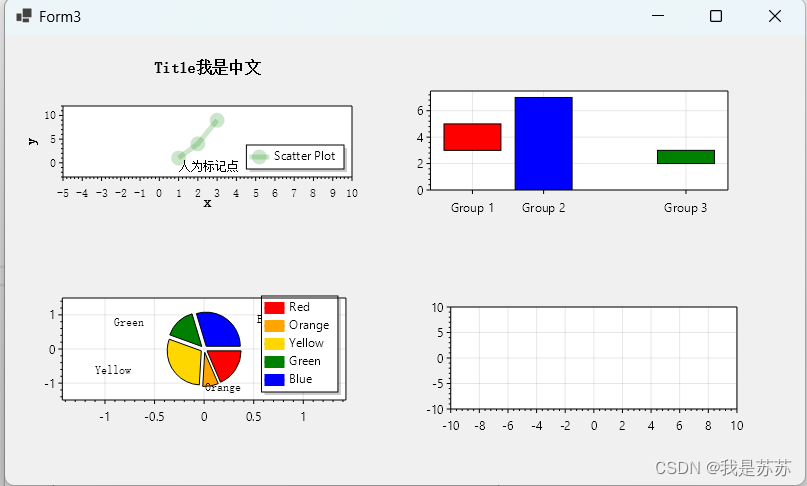
四、Scottplot老版本demo
分别演示柱折线图、柱状图、饼图的应用
//以下是一个代码示例

private void Form3_Load(object sender, EventArgs e)

 {

//一、折线图

     var plot1 = formsPlot1.Plot;

     double[] xs = { 1,2,3};

     double[] ys = { 1, 4, 9 };

     var style1 = plot1.Add.Scatter(xs, ys);

     style1.Color = Colors.Green.WithOpacity(.2);//绿色,透明度0.2

     style1.LineWidth = 5;//线宽5

     style1.MarkerSize = 15; //标记点大小是15

     style1.Label = "Scatter Plot"; // 添加图例

     plot1.Style.SetFont("宋体");//图像设置宋体字样

     plot1.Legend.Font.Name = "宋体";//图例设置宋体字样

     plot1.Title("Title我是中文");

     plot1.Add.Text("人为标记点",1,1);//在坐标x=1 y=1上标注字符串

     plot1.HideGrid();//隐藏网格线

     plot1.XLabel("x");

     plot1.YLabel("y");

     plot1.ShowLegend();//展示图例

     plot1.Axes.SetLimits(-5, 10, -3, 12);//x轴范围-5到10,y轴范围-3,12

     //plot1.SavePng("C:\\Users\\ASUS\\Pictures\\Saved Pictures\\abc.png", 400, 300);//保存图片

     //Tick[] ticks1 =

     //{

     //    new(1, "Group 1"),//x轴位置设置标签

     //    new(2, "Group 2"),

     //    new(3, "Group 3"),

     //};

     //plot1.Axes.Bottom.TickGenerator = new ScottPlot.TickGenerators.NumericManual(ticks1);//x轴位置设置标签

     //plot1.Axes.Margins(bottom: 0);//柱形图贴着X轴


//二、柱状图

     var plot2 = formsPlot2.Plot;

     //double[] values = { 5, 10, 7, 13 };

     //var style2 = plot2.Add.Bars(values);

     ScottPlot.Bar[] bars =

     {

         new() { Position = 1, Value = 5, ValueBase = 3, FillColor = Colors.Red },

         new() { Position = 2, Value = 7, ValueBase = 0, FillColor = Colors.Blue },

         new() { Position = 4, Value = 3, ValueBase = 2, FillColor = Colors.Green },

     };

     plot2.Add.Bars(bars);

     Tick[] ticks =

     {

         new(1, "Group 1"),//x轴位置设置标签

         new(2, "Group 2"),

         new(4, "Group 3"),

     };

     plot2.Axes.Bottom.TickGenerator = new ScottPlot.TickGenerators.NumericManual(ticks);//x轴位置设置标签

     plot2.Axes.Margins(bottom: 0);//柱形图贴着X轴


//三、饼图
     var plot3 = formsPlot3.Plot;

     PieSlice slice1 = new() { Value = 5, FillColor = Colors.Red, Label = "Red"};

     PieSlice slice2 = new() { Value = 2, FillColor = Colors.Orange, Label = "Orange" };

     PieSlice slice3 = new() { Value = 8, FillColor = Colors.Gold, Label = "Yellow" };

     PieSlice slice4 = new() { Value = 4, FillColor = Colors.Green, Label = "Green" };

     PieSlice slice5 = new() { Value = 8, FillColor = Colors.Blue, Label = "Blue" };

     List<PieSlice> slices = new() { slice1, slice2, slice3, slice4, slice5 };

     // 将饼图的数据添加到 plot3 中,并设置一些显示选项

     var pie = plot3.Add.Pie(slices);

     pie.ExplodeFraction = .1; // 设置饼图中的某个扇形稍微偏离饼图中心

     pie.ShowSliceLabels = true; // 显示扇形标签

     pie.SliceLabelDistance = 1.1; // 设置扇形标签的距离

     plot3.ShowLegend();//展示图例

}五、Scottplot老版本demo-效果图
六、Scottplot新版本demo
本次演示的是5.0.37版本
声明:无论绘制哪种图形,如果需要生成复合图,只需多调用一次方法即可。每调用一次方法,就会生成一条曲线。
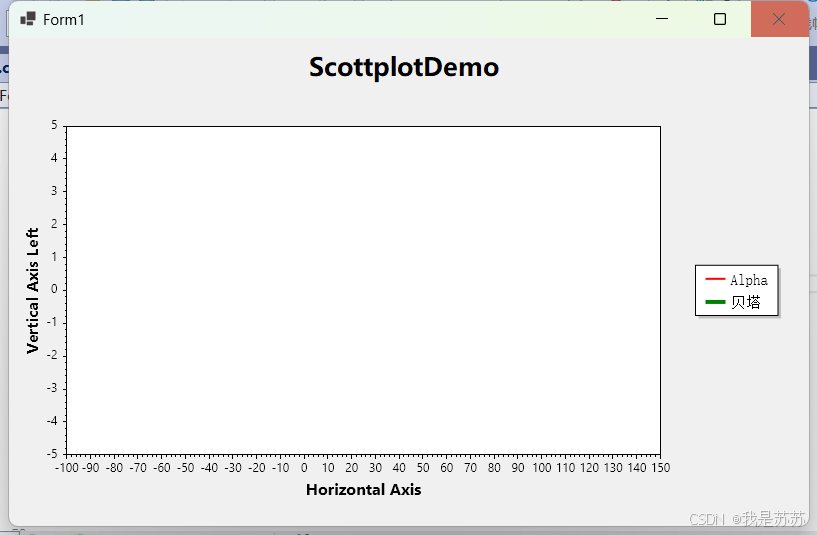
1、刻度、图例、标题、网格和保存图片
private void Form1_Load(object sender, EventArgs e)
{
    var myPlot = formsPlot1.Plot;//假设你拖到面板上的控件叫【formsPlot1】

    //一、刻度限制(xmin,xmax,ymin,ymax)
    myPlot.Axes.SetLimits(-100, 150, -5, 5);
    myPlot.Axes.Bottom.TickGenerator = new ScottPlot.TickGenerators.NumericAutomatic { TickDensity = 2 };//x轴刻度密度,值越大越密
    myPlot.Axes.Left.TickGenerator = new ScottPlot.TickGenerators.NumericAutomatic { TickDensity = 1 };//y轴刻度密度,值越大越密

    //二、图例绘制
    LegendItem[] items = {
        new() { LineColor = Colors.Red, LineWidth = 2, LabelText = "Alpha" },
        new() { LineColor = Colors.Green, LineWidth = 4, LabelText = "贝塔" }
        };

    myPlot.Legend.Alignment = Alignment.UpperCenter;
    myPlot.Legend.FontSize = 15;
    myPlot.Legend.FontName = "宋体";
    myPlot.ShowLegend(items);
    myPlot.ShowLegend(Edge.Right); // 如果不需要图例可以注释掉

    //三、标题设置
    myPlot.Axes.Left.Label.Text = "Vertical Axis Left";//x轴
    myPlot.Axes.Bottom.Label.Text = "Horizontal Axis";//y轴

    //四、倍数和网格设置
    //myPlot.ScaleFactor = 1.5;/放大倍数
    //myPlot.Axes.Hairline(true);//开启后,网格密集化
    myPlot.HideGrid();//开启后,隐藏网格

    //五、保存图片(位置,宽,高)
    myPlot.SavePng("demo.png", 400, 300);
}
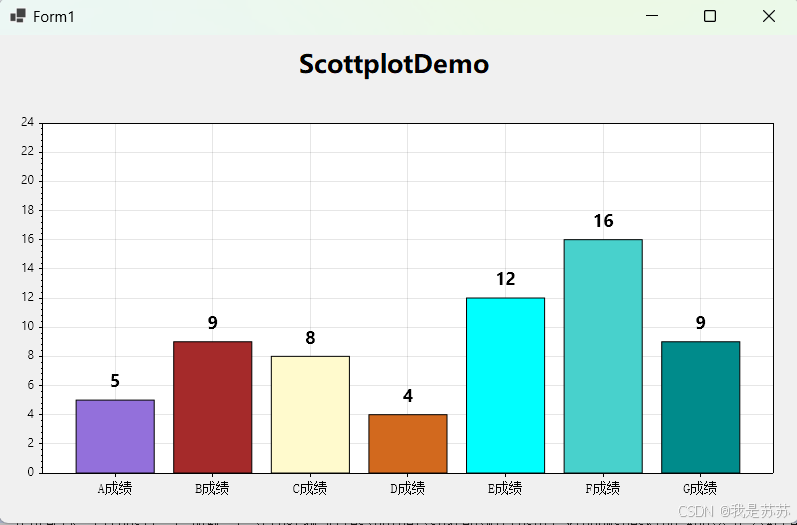
2、柱形图
【数据注入】
private void Form1_Load(object sender, EventArgs e)
{
    var myPlot = formsPlot1.Plot;//假设你拖到面板上的控件叫【formsPlot1】
    List<double> datalist = new List<double> { 5, 9, 8, 4, 12, 16, 9 };//数据
    List<string> title = new List<string> { "A成绩", "B成绩", "C成绩", "D成绩", "E成绩", "F成绩", "G成绩" };//标题,也可不传入,不传入默认就是索引
    DrawHistogram(myPlot, datalist, title);
}
【封装-柱形图】
/// <summary>
/// 绘制柱形图
/// </summary>
/// <param name="myPlot"></param>
/// <param name="datalist"></param>
/// <param name="tickLabels"></param>
/// <exception cref="Exception"></exception>
private static void DrawHistogram(Plot myPlot, List<double> datalist,List<string> tickLabels= null)
{
    if(tickLabels!=null && tickLabels.Count!=datalist.Count)
    {
        throw new Exception("标题长度和数据长度不匹配,渲染失败!");
    }
    //1.生成x轴:
    List<double> xlist = new List<double>();
    for (int i = 0; i < datalist.Count; i++)
    {
         var width = 1.1;//调整横坐标间隔(间接调柱形图宽度,值越大 柱形图宽度越窄)
         xlist.Add((double)i * width);
    }

    //2.绘图-渲染柱形图
    var barPlot = myPlot.Add.Bars(xlist, datalist);
    //绘图-渲染横坐标
    if (tickLabels != null)
    {
        myPlot.Axes.Bottom.SetTicks(xlist.ToArray(), tickLabels.ToArray());
    }
    else
    {
        myPlot.Axes.Bottom.SetTicks(xlist.ToArray(), xlist.ConvertAll(x=>x.ToString()).ToArray());
    }
    myPlot.Axes.Bottom.TickLabelStyle.FontName = "宋体";//中文必须加上字体
    myPlot.Axes.Bottom.TickLabelStyle.FontSize = 14;
    //myPlot.Axes.Bottom.TickLabelStyle.Rotation = 45;//倾斜文字,容纳更多内容

    //3.加上柱形图头上的数值,柱状图随机颜色
    Random random = new Random();
    List<System.Drawing.Color> colorlist = GetAllColorList();
    int index = 0;
    foreach (var bar in barPlot.Bars)
    {
        bar.Label = bar.Value.ToString();
        //bar.FillColor = ScottPlot.Color.FromHex(String.Format("#{0:X6}", random.Next(0x1000000)));//完全颜色随机(三选一)
        //bar.FillColor = GetCommonColorList()[index];//精选常用颜色(三选一,index初始化0,后续index++)
        bar.FillColor = ScottPlot.Color.FromColor(colorlist[random.Next(colorlist.Count)]);//精选颜色随机(三选一)
        index++;
    }
    barPlot.ValueLabelStyle.Bold = true;
    barPlot.ValueLabelStyle.FontSize = 18;
    myPlot.Axes.Margins(bottom: 0, top: .5);//距离底部为0 距离顶部为最大值*0.5的距离
    //myPlot.Axes.SetLimitsY(0, 8);//设置y轴的范围,注意要在设置了Margins后使用
}
【封装-全颜色库】
(原谅我吧,官方没随机色,脚本万岁)
/// <summary>
/// 颜色列表
/// </summary>
/// <returns></returns>
private static List<System.Drawing.Color> GetAllColorList()
{
var result = new List<System.Drawing.Color>();
result.Add(System.Drawing.Color.MediumAquamarine);
result.Add(System.Drawing.Color.MediumBlue);
result.Add(System.Drawing.Color.MediumOrchid);
result.Add(System.Drawing.Color.MediumPurple);
result.Add(System.Drawing.Color.MediumSeaGreen);
result.Add(System.Drawing.Color.MediumSlateBlue);
result.Add(System.Drawing.Color.MediumSpringGreen);
result.Add(System.Drawing.Color.MediumTurquoise);
result.Add(System.Drawing.Color.MediumVioletRed);
result.Add(System.Drawing.Color.MidnightBlue);
result.Add(System.Drawing.Color.MintCream);
result.Add(System.Drawing.Color.MistyRose);
result.Add(System.Drawing.Color.Moccasin);
result.Add(System.Drawing.Color.Navy);
result.Add(System.Drawing.Color.OldLace);
result.Add(System.Drawing.Color.Olive);
result.Add(System.Drawing.Color.Maroon);
result.Add(System.Drawing.Color.OliveDrab);
result.Add(System.Drawing.Color.Magenta);
result.Add(System.Drawing.Color.LimeGreen);
result.Add(System.Drawing.Color.LavenderBlush);
result.Add(System.Drawing.Color.LawnGreen);
result.Add(System.Drawing.Color.LemonChiffon);
result.Add(System.Drawing.Color.LightBlue);
result.Add(System.Drawing.Color.LightCoral);
result.Add(System.Drawing.Color.LightCyan);
result.Add(System.Drawing.Color.LightGoldenrodYellow);
result.Add(System.Drawing.Color.LightGray);
result.Add(System.Drawing.Color.LightGreen);
result.Add(System.Drawing.Color.LightPink);
result.Add(System.Drawing.Color.LightSalmon);
result.Add(System.Drawing.Color.LightSeaGreen);
result.Add(System.Drawing.Color.LightSkyBlue);
result.Add(System.Drawing.Color.LightSlateGray);
result.Add(System.Drawing.Color.LightSteelBlue);
result.Add(System.Drawing.Color.LightYellow);
result.Add(System.Drawing.Color.Lime);
result.Add(System.Drawing.Color.Linen);
result.Add(System.Drawing.Color.Yellow);
result.Add(System.Drawing.Color.Orange);
result.Add(System.Drawing.Color.Orchid);
result.Add(System.Drawing.Color.Silver);
result.Add(System.Drawing.Color.SkyBlue);
result.Add(System.Drawing.Color.SlateBlue);
result.Add(System.Drawing.Color.SlateGray);
result.Add(System.Drawing.Color.Snow);
result.Add(System.Drawing.Color.SpringGreen);
result.Add(System.Drawing.Color.SteelBlue);
result.Add(System.Drawing.Color.Tan);
result.Add(System.Drawing.Color.Teal);
result.Add(System.Drawing.Color.Thistle);
result.Add(System.Drawing.Color.Tomato);
result.Add(System.Drawing.Color.Transparent);
result.Add(System.Drawing.Color.Turquoise);
result.Add(System.Drawing.Color.Violet);
result.Add(System.Drawing.Color.Wheat);
result.Add(System.Drawing.Color.Sienna);
result.Add(System.Drawing.Color.OrangeRed);
result.Add(System.Drawing.Color.SeaShell);
result.Add(System.Drawing.Color.SandyBrown);
result.Add(System.Drawing.Color.PaleGoldenrod);
result.Add(System.Drawing.Color.PaleGreen);
result.Add(System.Drawing.Color.PaleTurquoise);
result.Add(System.Drawing.Color.PaleVioletRed);
result.Add(System.Drawing.Color.PapayaWhip);
result.Add(System.Drawing.Color.PeachPuff);
result.Add(System.Drawing.Color.Peru);
result.Add(System.Drawing.Color.Pink);
result.Add(System.Drawing.Color.Plum);
result.Add(System.Drawing.Color.PowderBlue);
result.Add(System.Drawing.Color.Purple);
result.Add(System.Drawing.Color.RebeccaPurple);
result.Add(System.Drawing.Color.Red);
result.Add(System.Drawing.Color.RosyBrown);
result.Add(System.Drawing.Color.RoyalBlue);
result.Add(System.Drawing.Color.SaddleBrown);
result.Add(System.Drawing.Color.Salmon);
result.Add(System.Drawing.Color.SeaGreen);
result.Add(System.Drawing.Color.Khaki);
result.Add(System.Drawing.Color.Lavender);
result.Add(System.Drawing.Color.Cyan);
result.Add(System.Drawing.Color.DarkMagenta);
result.Add(System.Drawing.Color.DarkKhaki);
result.Add(System.Drawing.Color.DarkGreen);
result.Add(System.Drawing.Color.DarkGray);
result.Add(System.Drawing.Color.DarkGoldenrod);
result.Add(System.Drawing.Color.DarkCyan);
result.Add(System.Drawing.Color.DarkBlue);
result.Add(System.Drawing.Color.Ivory);
result.Add(System.Drawing.Color.Crimson);
result.Add(System.Drawing.Color.Cornsilk);
result.Add(System.Drawing.Color.CornflowerBlue);
result.Add(System.Drawing.Color.Coral);
result.Add(System.Drawing.Color.Chocolate);
result.Add(System.Drawing.Color.DarkOliveGreen);
result.Add(System.Drawing.Color.Chartreuse);
result.Add(System.Drawing.Color.BurlyWood);
result.Add(System.Drawing.Color.Brown);
result.Add(System.Drawing.Color.BlueViolet);
result.Add(System.Drawing.Color.Blue);
result.Add(System.Drawing.Color.BlanchedAlmond);
result.Add(System.Drawing.Color.Black);
result.Add(System.Drawing.Color.Bisque);
result.Add(System.Drawing.Color.Beige);
result.Add(System.Drawing.Color.Azure);
result.Add(System.Drawing.Color.Aquamarine);
result.Add(System.Drawing.Color.Aqua);
result.Add(System.Drawing.Color.AntiqueWhite);
result.Add(System.Drawing.Color.AliceBlue);
result.Add(System.Drawing.Color.CadetBlue);
result.Add(System.Drawing.Color.DarkOrange);
result.Add(System.Drawing.Color.YellowGreen);
result.Add(System.Drawing.Color.DarkRed);
result.Add(System.Drawing.Color.Indigo);
result.Add(System.Drawing.Color.IndianRed);
result.Add(System.Drawing.Color.DarkOrchid);
result.Add(System.Drawing.Color.Honeydew);
result.Add(System.Drawing.Color.GreenYellow);
result.Add(System.Drawing.Color.Green);
result.Add(System.Drawing.Color.Gray);
result.Add(System.Drawing.Color.Goldenrod);
result.Add(System.Drawing.Color.Gold);
result.Add(System.Drawing.Color.GhostWhite);
result.Add(System.Drawing.Color.Gainsboro);
result.Add(System.Drawing.Color.Fuchsia);
result.Add(System.Drawing.Color.ForestGreen);
result.Add(System.Drawing.Color.HotPink);
result.Add(System.Drawing.Color.Firebrick);
result.Add(System.Drawing.Color.FloralWhite);
result.Add(System.Drawing.Color.DodgerBlue);
result.Add(System.Drawing.Color.DimGray);
result.Add(System.Drawing.Color.DeepSkyBlue);
result.Add(System.Drawing.Color.DeepPink);
result.Add(System.Drawing.Color.DarkViolet);
result.Add(System.Drawing.Color.DarkTurquoise);
result.Add(System.Drawing.Color.DarkSlateGray);
result.Add(System.Drawing.Color.DarkSlateBlue);
result.Add(System.Drawing.Color.DarkSeaGreen);
result.Add(System.Drawing.Color.DarkSalmon);
return result;
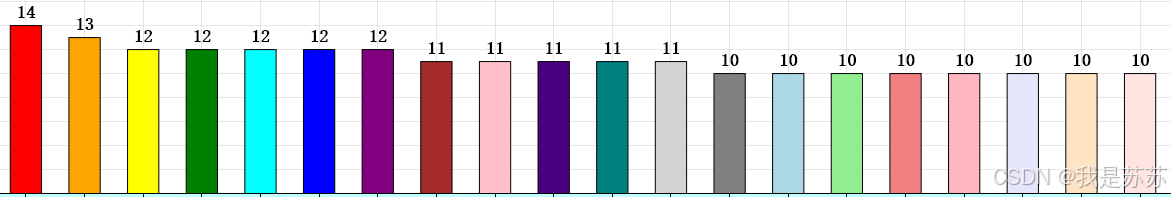
}【效果图】
3、折线图(平滑和不平滑)
【数据注入】(支持两种方式)
private void Form1_Load(object sender, EventArgs e)
{
    var myPlot = formsPlot1.Plot;//假设你拖到面板上的控件叫【formsPlot1】
    List<double> xs = new() { 1, 2, 3, 4, 5 };
    List<double> ys = new() { 1, 4, 9, 16, 25 };
    DrawLinechart(myPlot, ys, xs);

    //List<string> title = new() { "小虹", "小花", "小明", "小迪", "小雷" };
    //List<double> ys2 = new() { 1, 4, 9, 16, 25 };
    //DrawLinechart(myPlot, ys2, title);
}
【封装-折线图】
//方法重载,方便调用
private static void DrawLinechart(Plot myPlot, List<double> ys, List<string> title = null)
{
    DrawLinechart(myPlot, ys, null, title);
}

//原始方法
private static void DrawLinechart(Plot myPlot, List<double> ys, List<double> xs = null, List<string> title = null)
{
    bool flag = false;
    bool isallnull = xs==null && title== null;
    if (isallnull)
    {
        throw new Exception("请传入横坐标值或者横坐标轴标签,渲染失败!");
    }
    if ((xs!=null && xs.Count != ys.Count) || (title != null && title.Count != ys.Count))
    {
        throw new Exception("横纵坐标长度不同,渲染失败!");
    }

    if (title?.Count!=0 ||  xs?.Count==0 )
    {
        xs = new List<double>();
        flag = true;//表示xs要渲染成0,1,2,3,4...序列
        for (var i = 0; i < ys.Count; i++)
        {
            xs.Add(i + 1);
        }
    }

    //1.数据渲染
    var sp = myPlot.Add.Scatter(xs, ys);

    //2.平滑处理
    sp.Smooth = true;//平滑折线图,注释掉这行代码可以变成直线图
    sp.LineWidth = 3;
    sp.MarkerSize = 10;
    sp.Color = Colors.Blue;//设置线颜色 , 这里也可由入参控制:①调用传参:ScottPlot.Colors.Blue    ②方法入参:ScottPlot.Color co    ②方法使用:sp.Color = co;
    myPlot.Axes.AntiAlias(true);

    //3.数值标记
    int index = 0;
    foreach (var item in ys)
    {
        var txt = myPlot.Add.Text(item.ToString(), xs[index], item);
        txt.LabelFontSize = 16;
        txt.LabelPadding = 2;
        txt.LabelBold = true;
        // 调整文本位置,使其显示在点的上方
        txt.OffsetY = -25; // 越小越靠上
        txt.OffsetX = -6;// 越小越靠左
        index++;
    }

    // 4.横坐标标记
    if (flag && title!=null && title.Count!=0)
    {
        myPlot.Axes.Bottom.SetTicks(xs.ToArray(), title.ToArray());
        myPlot.Axes.Bottom.TickLabelStyle.FontName = "宋体";
        myPlot.Axes.Bottom.TickLabelStyle.FontSize = 15;
    }

    // 5.调整图表边距
    myPlot.Axes.Margins(bottom: .1, top: .3);
}
【实现效果】
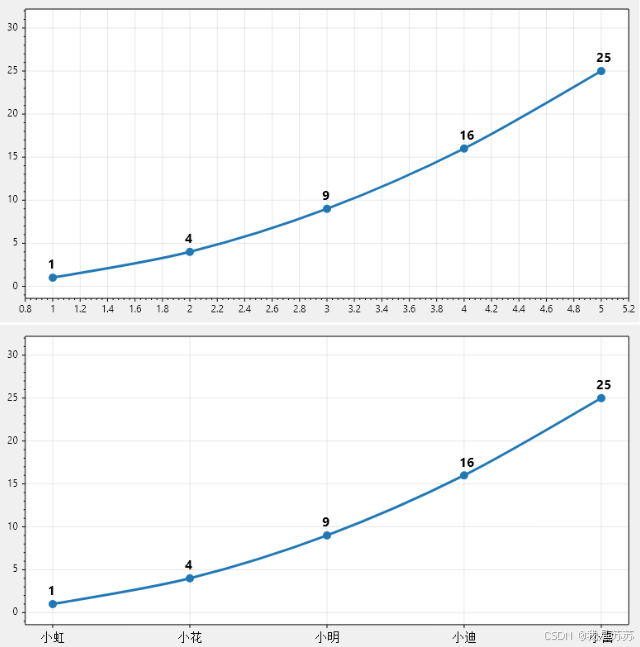
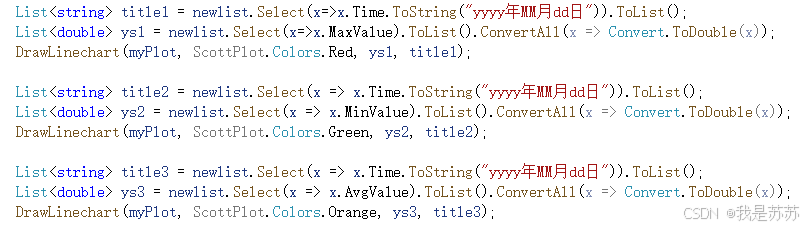
【调用方法实现多折线图】
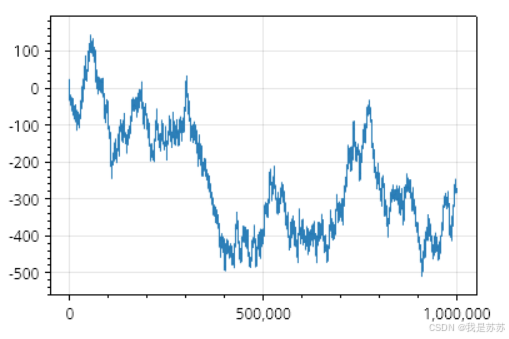
4、信号图
【demo】
【注意】一般上千个数据才有较好效果,图片展示用的是官网的,并非以下代码实现的!
private void Form1_Load(object sender, EventArgs e)
{
    var myPlot = formsPlot1.Plot;//假设你拖到面板上的控件叫【formsPlot1】
    List<Double> datalist = new List<double> { 1,5,99,15,8,42,36,52,81,42,582,42,62, 15, 8, 42, 36, 52, 81, 42, 582, 42, 62, 15, 8, 42, 36, 52, 81, 42, 582, 42, 62, 15, 8, 42, 36, 52, 81, 42, 582, 42, 62 };
    DrawSignal(myPlot, datalist);
}

private void DrawSignal(Plot myPlot, List<double> datalist)
{
    myPlot.Add.Signal(datalist.ToArray());
    //myPlot.Title("信号图标题");
}
【封装-信号图】
private void DrawSignal(Plot myPlot, List<double> datalist)
{
    myPlot.Add.Signal(datalist.ToArray());
    //myPlot.Title("信号图标题");
}
5、鸡冠花图
【调用】
private void Form1_Load(object sender, EventArgs e)
{
    var myPlot = formsPlot1.Plot;//假设你拖到面板上的控件叫【formsPlot1】
    List<double> datalist = new List<double> { 18, 5.8, 6, 9, 15, 3 };
    List<string> titlelist = new List<string> { "小虹", "小花", "小明", "小迪", "小雷","小美"};
    DrawCoxcomb(myPlot, datalist, titlelist, 0.6);
}
【封装-鸡冠花】
private static void DrawCoxcomb(Plot myPlot, List<double> datalist, List<string> titlelist, double transparency = 1) //数据,标题,透明度(0-1)
{
    if (datalist.Count != titlelist.Count)
    {
        throw new Exception("数据长度和标题长度不一致,渲染失败");
    }
    List<PieSlice> slicelist = new List<PieSlice>();
    string fontname = "宋体";
    int fontsize = 15;
    foreach (var item in datalist)
    {
        int index = datalist.IndexOf(item);
        slicelist.Add(new PieSlice { Value = item, Label = $"{titlelist[index]}: {item}", FillColor = GetCommonColorList(transparency)[index] ,LabelFontName= fontname,LabelFontSize=fontsize });
    }
    //slicelist.ForEach(x => x.LabelFontColor = x.FillColor);//标签上色
    var plot = myPlot.Add.Coxcomb(slicelist);
    plot.ShowSliceLabels = true;//图上展示标签
    plot.SliceLabelDistance = 0.9;//标签与切片之间的距离
    myPlot.Axes.Frameless();//隐藏双轴
    myPlot.Legend.FontName= fontname;
    myPlot.Legend.FontSize = fontsize;
    myPlot.ShowLegend();//展示图例
    myPlot.HideGrid();
    myPlot.Axes.FrameWidth(800);
}
【封装-常用颜色】
/// <summary>
/// 常见颜色列表
/// </summary>
/// <param name="trans"></param>
/// <returns></returns>
private static List<ScottPlot.Color> GetCommonColorList(double trans = 1)
{
    // 定义颜色并应用透明度
    var result = new List<ScottPlot.Color>
    {
        Colors.Red.WithOpacity(trans ),      // 红色
        Colors.Orange.WithOpacity(trans ),   // 橙色
        Colors.Yellow.WithOpacity(trans ),   // 黄色
        Colors.Green.WithOpacity(trans ),    // 绿色
        Colors.Cyan.WithOpacity(trans ),     // 青色
        Colors.Blue.WithOpacity(trans ),     // 蓝色
        Colors.Purple.WithOpacity(trans ),   // 紫色
        Colors.Brown.WithOpacity(trans ),    // 棕色
        Colors.Pink.WithOpacity(trans ),     // 粉色
        Colors.Indigo.WithOpacity(trans ),   // 靛蓝色
        Colors.Teal.WithOpacity(trans ) ,     // 青绿色
        Colors.LightGray.WithOpacity(trans),    // 浅灰色
        Colors.Gray.WithOpacity(trans),         // 灰色
        Colors.LightBlue.WithOpacity(trans),    // 浅蓝色
        Colors.LightGreen.WithOpacity(trans),   // 浅绿色
        Colors.LightCoral.WithOpacity(trans),   // 浅珊瑚色
        Colors.LightPink.WithOpacity(trans),     // 浅粉色
        Colors.Lavender.WithOpacity(trans),     // 薰衣草色
        Colors.Bisque.WithOpacity(trans),       // 米色
        Colors.MistyRose.WithOpacity(trans),    // 玫瑰雾色
        Colors.PaleGoldenRod.WithOpacity(trans) // 苍黄色
    };
    return result;
}
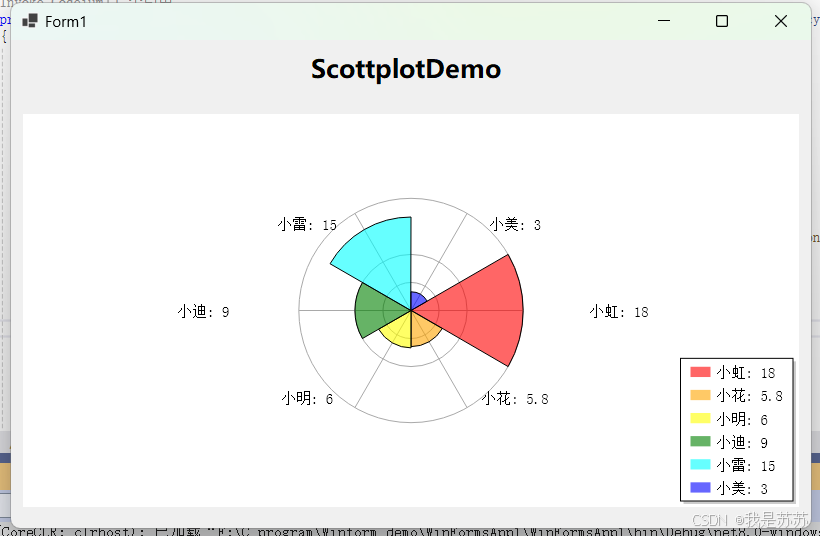
【效果】
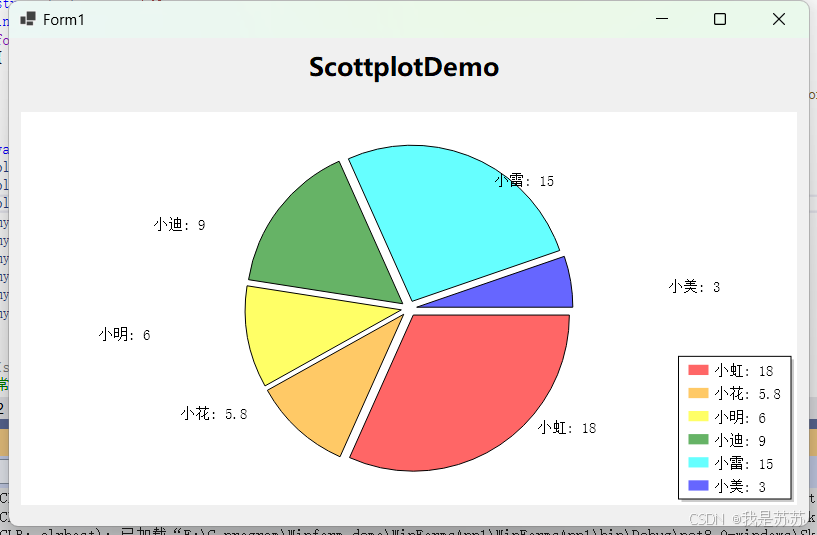
6、饼图
【调用】
private void Form1_Load(object sender, EventArgs e)
{
    var myPlot = formsPlot1.Plot;//假设你拖到面板上的控件叫【formsPlot1】
    List<double> datalist = new List<double> { 18, 5.8, 6, 9, 15, 3 };
    List<string> titlelist = new List<string> { "小虹", "小花", "小明", "小迪", "小雷","小美"};
    DrawPie(myPlot, datalist, titlelist, 0.6);
}
【封装-饼图】
private static void DrawPie(Plot myPlot, List<double> datalist, List<string> titlelist, double transparency = 1) //数据,标题,透明度(0-1)
{
    if (datalist.Count != titlelist.Count)
    {
        throw new Exception("数据长度和标题长度不一致,渲染失败");
    }
    List<PieSlice> slicelist = new List<PieSlice>();
    string fontname = "宋体";
    int fontsize = 15;
    int index = 0;
    foreach (var item in datalist)
    {
        slicelist.Add(new PieSlice { Value = item, Label = $"{titlelist[index]}: {item}", FillColor = GetCommonColorList(transparency)[index] ,LabelFontName= fontname,LabelFontSize=fontsize });
        index++;
    }
    //slicelist.ForEach(x => x.LabelFontColor = x.FillColor);//标签上色
    var plot = myPlot.Add.Pie(slicelist);
    plot.ShowSliceLabels = true;
    plot.SliceLabelDistance = 0.9;//标签与切片之间的距离
    plot.ExplodeFraction = 0.05;//【重要】设置饼图之间的间隙
    myPlot.Axes.Frameless();//隐藏双轴
    myPlot.Legend.FontName= fontname;
    myPlot.Legend.FontSize = fontsize;
    myPlot.ShowLegend();
    myPlot.HideGrid();
    myPlot.Axes.FrameWidth(800);
}
【封装-常用颜色】
见标题五
【效果】
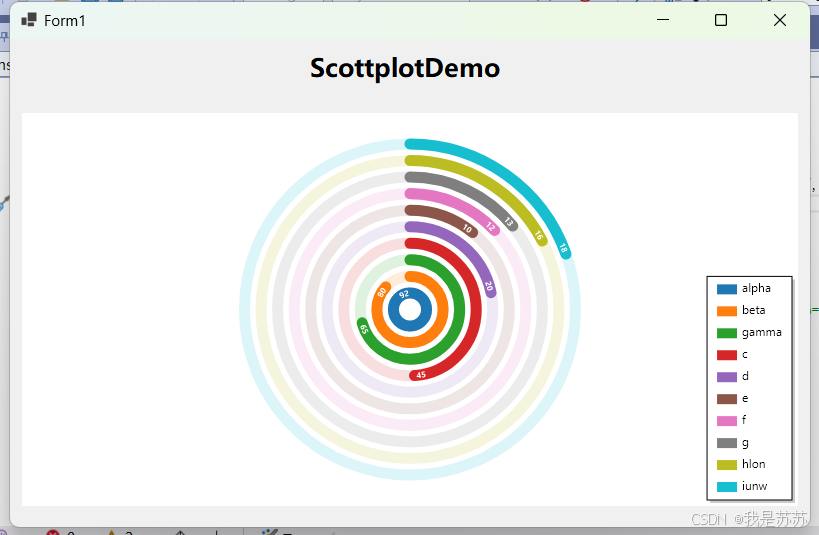
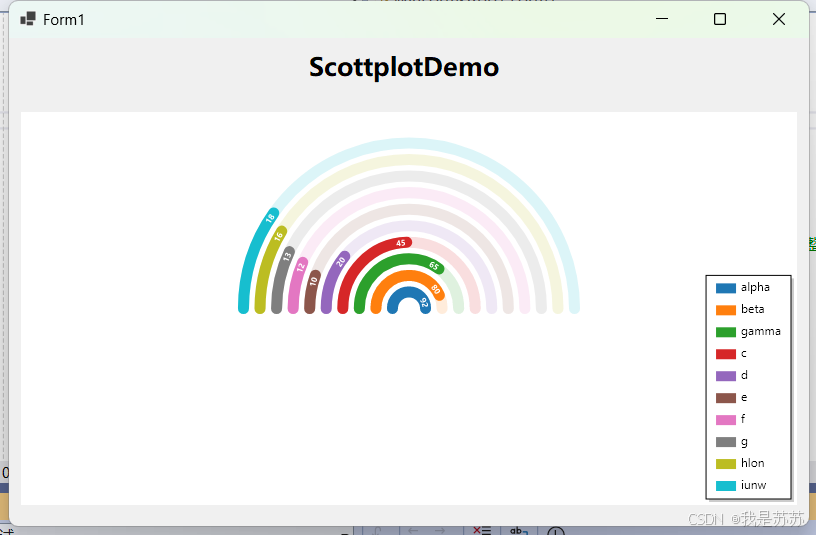
7、环形图
【调用】
private void Form1_Load(object sender, EventArgs e)
{
    var myPlot = formsPlot1.Plot;//假设你拖到面板上的控件叫【formsPlot1】
    List<double> datalist = new List<double>{ 92, 80, 65, 45, 20 ,10,12,13,16,18};
    List<string> titlelist = new List<string> { "alpha", "beta", "gamma", "c", "d", "e", "f", "g", "hlon", "iunw" };
    bool isComplete = false;
    DrawCircle(myPlot, datalist, titlelist,isComplete);
    myPlot.ShowLegend();
}
【封装-环形图】
private void DrawCircle(Plot myPlot,List<double> datalist,List<string>titlelist,bool b = true)//b=true 完整圆  b=false半圆
{
    var radialGaugePlot = myPlot.Add.RadialGaugePlot(datalist.ToArray());
    radialGaugePlot.Labels = titlelist.ToArray();
    if (!b)
    {
        radialGaugePlot.CircularBackground = b;
        radialGaugePlot.MaximumAngle = 180;
        radialGaugePlot.StartingAngle = 180;
    }
    myPlot.ShowLegend();
}
【效果】
8.字体设置方法
//1.标记点
var sets = plot1.Add.XXXX(XXXX)
sets.FontName = "微软雅黑";//新版是LabelFontName
sets.FontSize = 15;

//2.坐标轴
myPlot.Axes.Bottom.TickLabelStyle.FontName = "微软雅黑";
myPlot.Axes.Bottom.TickLabelStyle.Bold = true;

//3.图例
myPlot.Legend.FontSize = 15;
9.点击后刷新的方法
//点击按钮触发的事件
private void radioButton1_CheckedChanged(object sender, EventArgs e)
{
    DrawPlot();//【第一步】调用绘制图表的方法
    formsPlot1.Refresh();//【第二步】,调用刷新方法(假设你拖到面板上的控件叫【formsPlot1】,这里对它强制刷新)
}
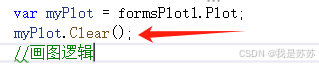
【可选第三步】在DrawPlot()内部要注意,建议是先清后画,避免其他问题:
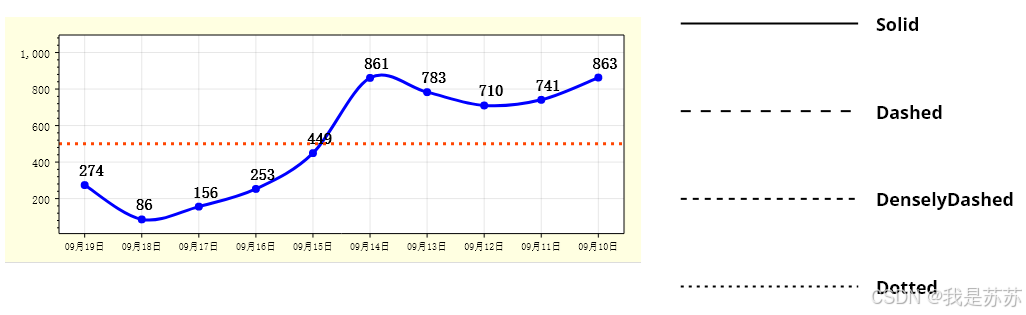
10.给图像增加虚线/实线
实现代码:
var hl2 = myPlot.Add.HorizontalLine(500);//这是垂直y轴的写法,若想垂直x轴,应该写为:VerticalLine
hl2.LineColor = Colors.OrangeRed;//选择颜色
hl2.LineWidth = 3;//宽度
hl2.LinePattern = LinePattern.Dotted;//样式(四选一)
效果参考和线段类型图:
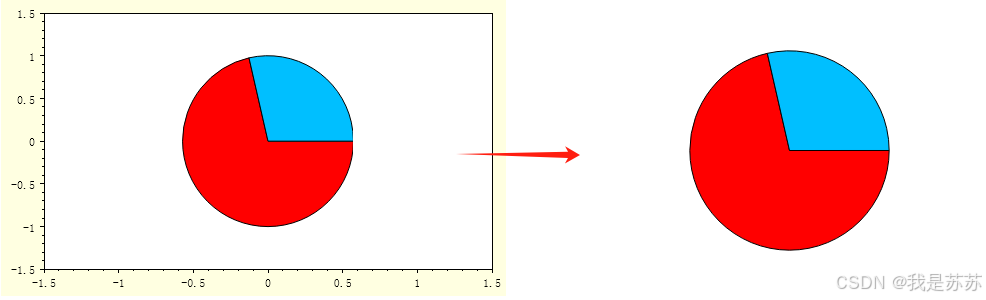
11.图表铺满(留白处理)
myPlot.Axes.Margins(bottom: 0, top: 0,left:0,right:0);
//myPlot.Axes.Margins(bottom: 0, top: 0.2,left:0,right:0); //距离顶部:图表高度的20%
12.定制自选颜色
FillColor = ScottPlot.Color.FromHex("#FF0000");13.去掉边框
代码:
myPlot.Axes.Bottom.IsVisible = false;
myPlot.Axes.Left.IsVisible = false;
myPlot.Axes.Right.IsVisible = false;
myPlot.Axes.Top.IsVisible = false;
效果:
14.轴范围
// 设置 Y 轴的范围,从 -2 到 12
myPlot.Axes.SetLimitsY(-2, 12);

// 设置 X 轴的范围,从 0.3 到 11.5
myPlot.Axes.SetLimitsX(0.3, 11.5);
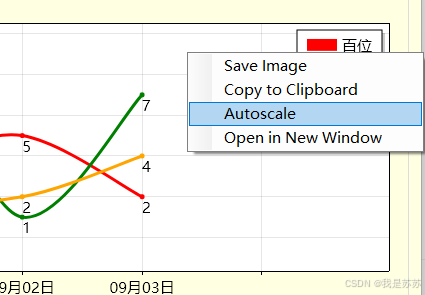
七、小技巧
右键图表
保存/粘贴板导出/自动放缩/新窗体打开(推荐,这个效果很很厉害)
八、后记
【说明】官网更新实在太快了,有一些方法更新了
比如字体:
myPlot.Font.Set("宋体");
myPlot.Legend.FontName = "宋体";
本贴中的老旧 demo 和新 demo 相隔不到半年,但许多方法已经更新。如果你遇到无法运行的 demo,请访问官网获取最新的学习资源。如果发现任何问题,请不吝指正。谢谢!


 1328
1328

 被折叠的 条评论
为什么被折叠?
被折叠的 条评论
为什么被折叠?
 到【灌水乐园】发言


