


没有前端经验,第一次做前端项目,第一次用vue,第一次在vue中引入echarts。紧紧只是静态页面的显示,也遇到无数坑。
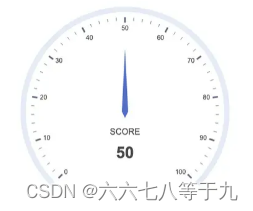
最后的图形:

因为要做数据可视化的界面,涉及很多图标,自己尝试用echarts来实现,以仪表盘为例。
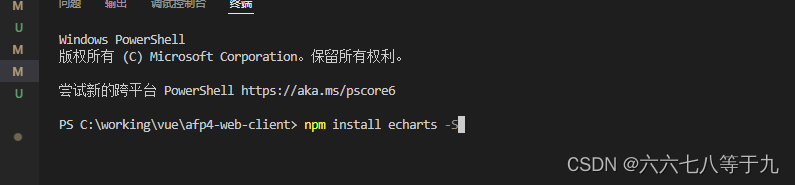
1、打开已经建好的vue项目文件(文件是别人已经做好的,我只是在项目上添加一个数据可视化的页面)。我在网上找到cnpm安装的方法,全局安装了echarts(坑)。
然后按照网上的方法,在我需要放仪表盘的页面引入echarts,这里引入的时候就出问题了,怎么都引入不了,最后发现

换了一种引入方法,瞬间就可以了。

2、在Apache ECharts 官网上,找到一个仪表盘,因为自己设计的图,官网上的案例都满足不了,所以找了个最简单的图形进行改造。
3、图表正式开始,新建一个方法,然后运行,图表初始化。


4、样式自定义,整个可视化组件的内容都在这个setOption里面,我在series里面分了两层做表盘,具体样式我放在最下面代码里面。

5、最后说一下echarts坑,这个仪表盘需要做渐变,但是官方不支持,于是我在万能的网上找到了这个方法new t.$echarts.graphic.LinearGradient,这个可以实现渐变,但是这个方法不支持echarts5.0以上的版本,于是我只能卸载现在安装的5.0版本,重新安装4.9版本。
版本换了以后,所有的渐变效果都很自然的实现了。
html:
<img id="bg_img" src="./img/chartBg.jpg" alt="" style="display: none" />
<div class="Echarts" style="width: 20%; height: 100%">
<div id="powerTotal" class="chartSs"></div>
</div>
script:
powerTotaltData() {
let t = this;
this.powerChart = this.$echarts.init(
document.querySelector("#powerTotal")
);
let sizeFun = function () {
this.powerChart.resize();
};
this.powerChart.setOption({
// kwh
title: {
text: "kwh",
left: "35%",
top: "69%",
textStyle: {
color: "#9c9eaf",
fontSize: "12",
},
color: ["#2efeff"],
},
series: [
{
type: "gauge",
center: ["40%", "60%"],
radius: "90%",
startAngle: 223,
endAngle: -43,
min: 0,
max: 100,
splitNumber: 10,
//指针
pointer: {
show: false,
},
// 表盘
axisLine: {
show: true,
roundCap: true,
lineStyle: {
width: 12,
// eharts5.0以上版本不支持
color: [
[
1,
new t.$echarts.graphic.LinearGradient(0, 0, 1, 0, [
{
offset: 0.1,
color: "#2efeff",
},
{
offset: 0.5,
color: "#40cfff",
},
{
offset: 0.75,
color: "#3084f4",
},
{
offset: 1,
color: "#5530f4",
},
]),
],
],
},
},
//刻度
axisTick: {
show: false,
},
//间隔线
splitLine: {
show: false,
},
//刻度数字
axisLabel: {
show: false,
distance: -20,
color: "#999",
fontSize: 20,
},
//name标题
title: {
show: true,
color: "#bed4ff",
offsetCenter: [0, "80%"],
},
//表盘内文字
detail: {
valueAnimation: false,
width: "0%",
// lineHeight: 80,
fontSize: 32,
color: "#2efeff",
offsetCenter: [0, 0],
// fontWeight: "bolder",
formatter: "{value}",
},
data: [
{
value: 4000,
name: "总电量",
},
],
},
// 外层刻度
{
type: "gauge",
radius: "115%",
center: ["40%", "60%"],
startAngle: 223,
endAngle: -43,
min: 0,
max: 100,
splitNumber: 10,
axisLine: {
show: false,
lineStyle: {
width: 2,
opacity: 0,
},
},
title: { show: false },
detail: { show: false },
splitLine: { show: false },
axisTick: {
length: 12,
lineStyle: {
color: {
image: document.getElementById("bg_img"),
repeat: "no-repeat",
},
width: 3,
},
},
axisLabel: { show: false },
pointer: { show: false },
itemStyle: {},
},
],
});
},
css:
.chartSs {
width: 100%;
height: 100%;
}


 5726
5726


 被折叠的 条评论
为什么被折叠?
被折叠的 条评论
为什么被折叠?
 到【灌水乐园】发言


