


最近在公司工作中,遇到一个图表的需求,要求实现背景图是可以动态跟随最高点而改变位置的。
好玩的是,我实现了效果,但是没在官方配置项看到我这个用法的出处,所以记录一下。
话不多说,配置项也没什么好解释的,直接上代码!!!
that.chartOption = {
grid: {
left: '3%',
top: '15%', //8原本
right: '8%',
bottom: '28%',
containLabel: true,
show: true,
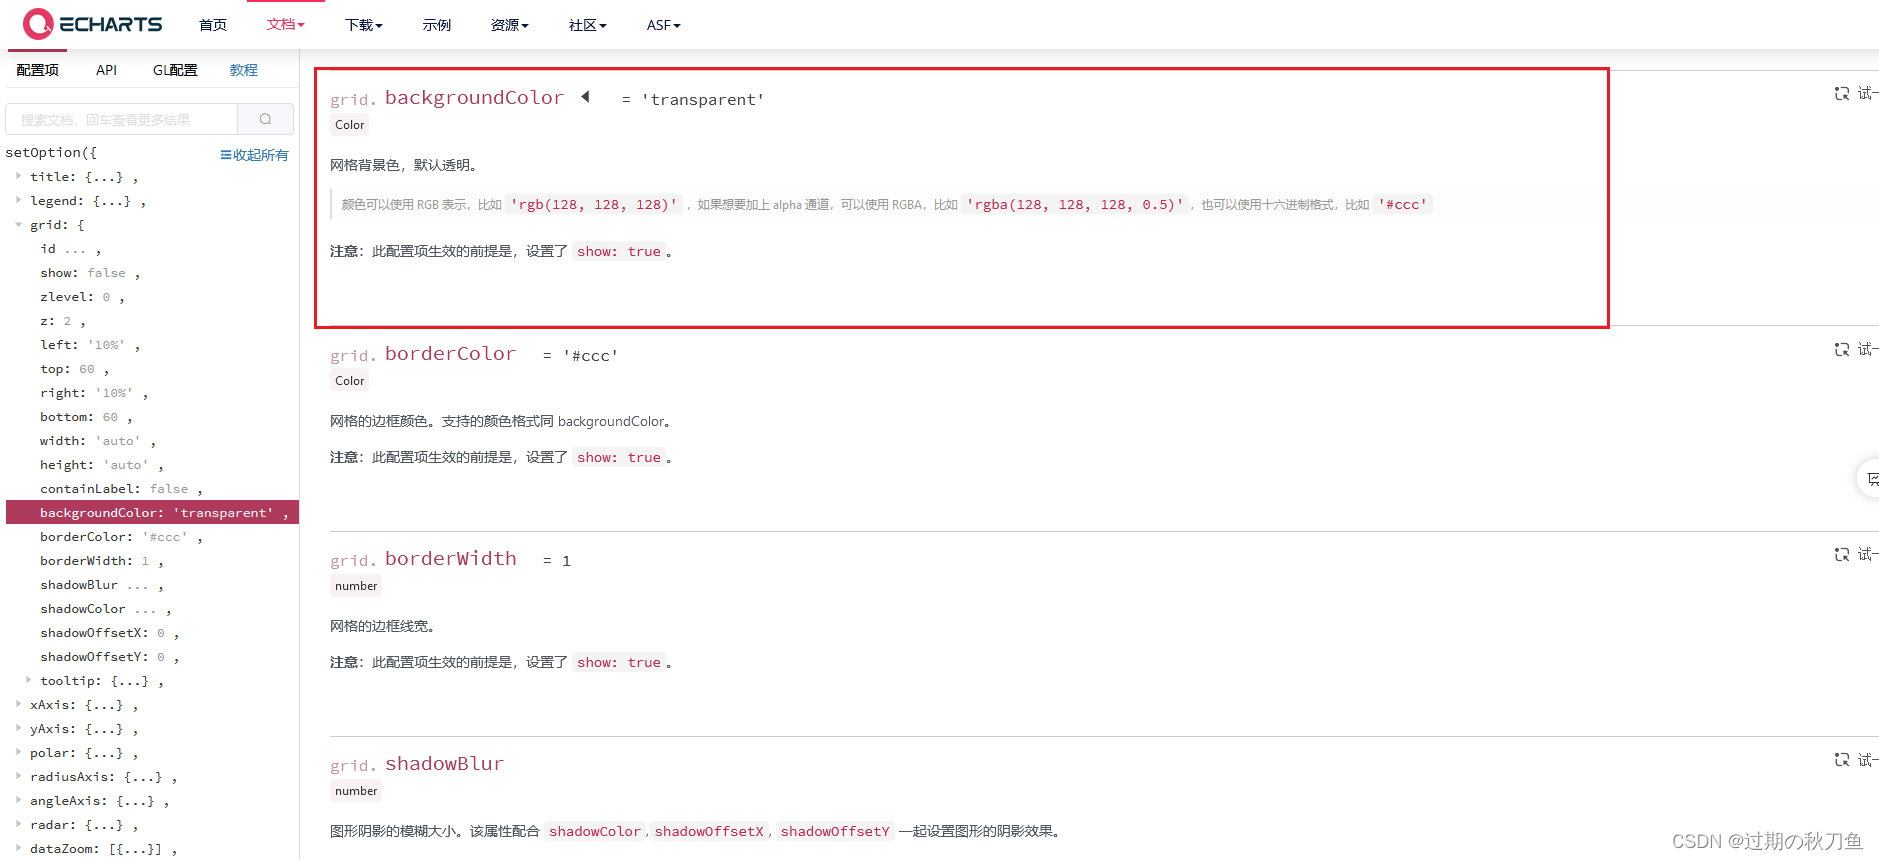
backgroundColor: {
//这个就是控制背景色的,我使用的是渐变,offset是我动态计算的,后面会贴方法。
colorStops: [
{ offset: 0, color: 'blue' },
{ offset: that.percentage, color: 'red' },
{ offset: 1, color: 'blue' }
]
}
},
tooltip: {
trigger: 'axis'
},
xAxis: {
top: '15%',
name: '距离',
nameTextStyle: {
color: '#fff'
},
type: 'category',
boundaryGap: false, //是否留白
axisLine: { show: true }, //显示轴
axisTick: { show: false }, //轴刻度线
axisLabel: { show: true, color: '#fff' }, //显示轴的数值和颜色
data: xData
// min: this.startPoint,
// max: this.endPoint
},
yAxis: {
name: '幅值',
nameTextStyle: {
color: '#fff'
},
type: 'value',
// 定制折线图的范围
max: 1000,
min: 0,
splitLine: { show: false }, //显示背景线轴
axisLine: { show: true }, //显示轴
axisTick: { show: false }, //轴刻度线
axisLabel: { show: true, color: '#fff' } //显示轴的数值和颜色
},
dataZoom: [
{
type: 'inside',
show: true,
xAxisIndex: [0]
// start: 2109,
// end: 2150
},
{
type: 'inside',
show: true,
yAxisIndex: [0],
bottom: '30%'
}
],
series: [
{
symbol: 'none', //去折线上的点
type: 'line',
itemStyle: {
normal: {
color: '#3AFFF3',
lineStyle: {
color: '#3AFFF3',
width: '1'
}
}
},
data: yData,
markPoint: {
symbolSize: 15, // 设置异常点的大小
symbol: 'circle',
data: errorLocations,
label: {
show: true,
color: '#fff',
position: 'right' // 将字样显示在标记点的上方
},
itemStyle: {
borderWidth: 4, // 设置边框宽度
borderColor: '#FF3400', // 设置边框颜色
color: '#FFA500' // 设置标记点颜色为黄色
}
},
markLine: {
symbol: ['none', 'none'],
label: { show: false },
lineStyle: {
color: '#608cc6',
type: 'solid'
},
animation: false,
data: [
{ xAxis: 1 },
{ xAxis: 2 },
{ xAxis: 3 },
{ xAxis: 4 },
{ xAxis: 5 },
{ xAxis: 6 },
{ xAxis: 7 },
{ xAxis: 8 },
{ xAxis: 9 },
{ xAxis: 10 },
{ xAxis: 11 },
{ xAxis: 12 },
{ xAxis: 13 },
{ xAxis: 14 },
{ xAxis: 15 },
{ xAxis: 16 },
{ xAxis: 17 },
{ xAxis: 18 },
{ xAxis: 19 },
{ yAxis: 10000 }
]
}
}
]
}下面是计算offset的方法,用来最大点位置整个x轴的相对位置。
      function calculatePercentageOfMax(array) {
        // 找到数组中的最大值及其索引位置
        const max = Math.max(...array)
        const index = array.indexOf(max)

        // 计算最大值位置相对于数组长度的百分比
        const percentage = index / (array.length - 1)

        return percentage
      }
这样就可以实现背景色动态跟随变化了。
echarts官网我确实没看到可以用那个api,可能是没写出来,没去看源码,有大佬知道的话,可以在下方留言!


 1418
1418

 被折叠的 条评论
为什么被折叠?
被折叠的 条评论
为什么被折叠?
 到【灌水乐园】发言


