import pandas as pd
from plotnine import *

# 定义自定义函数
def f(x):
    return x**2

# 生成 x 值
x_values = range(-10, 11)

# 生成对应的 y 值
y_values = [f(x) for x in x_values]

# 创建数据框
df = pd.DataFrame({'x': x_values, 'y': y_values})
# df为:
     x    y
0  -10  100
1   -9   81
2   -8   64
3   -7   49
4   -6   36
5   -5   25
6   -4   16
7   -3    9
8   -2    4
9   -1    1
10   0    0
11   1    1
12   2    4
13   3    9
14   4   16
15   5   25
16   6   36
17   7   49
18   8   64
19   9   81
20  10  100
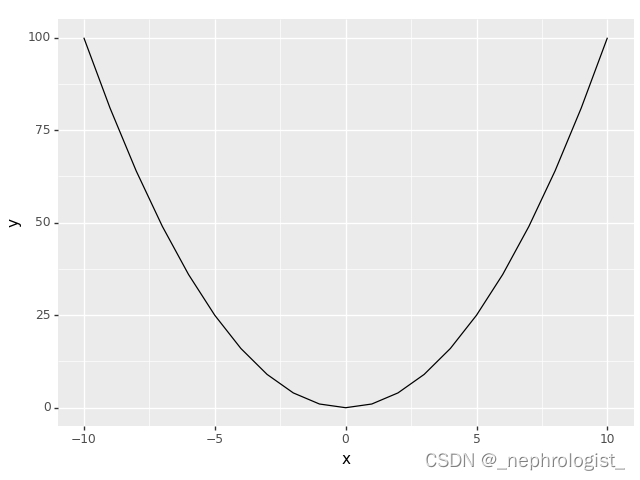
绘制函数图像
print(ggplot(df, aes(x='x', y='y')) +
      geom_line()
)
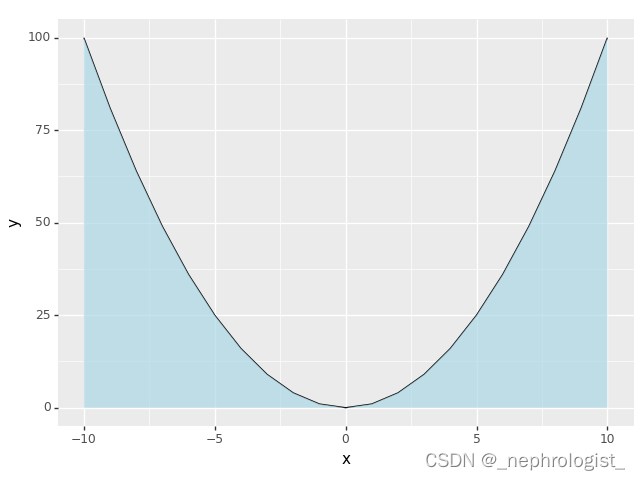
绘制函数图像:下面添加阴影
print(ggplot(df, aes(y='y', x='x')) +
      geom_line() +
      geom_ribbon(aes(ymin=0, ymax='y'), fill='lightblue', alpha=0.7)
)


 8372
8372


 被折叠的 条评论
为什么被折叠?
被折叠的 条评论
为什么被折叠?
 到【灌水乐园】发言


