


代码,笔记,数据集文件放在gitee
点这里进入gitee
https://gitee.com/jiangxun07/python-data-analysis.git
0 Seaborn简介
Seaborn 是一个基于 matplotlib 且数据结构与 pandas 统一的统计图制作库。
这里列出了一些 seaborn 的功能:
- 计算多变量间关系的面向数据集接口
- 可视化类别变量的观测与统计
- 可视化单变量或多变量分布并与其子数据集比较
- 控制线性回归的不同因变量并进行参数估计与作图
- 对复杂数据进行易行的整体结构可视化
- 对多表统计图的制作高度抽象并简化可视化过程
- 提供多个内建主题渲染 matplotlib 的图像样式
- 提供调色板工具生动再现数据
Seaborn 框架旨在以数据可视化为中心来挖掘与理解数据。它提供的面向数据集制图函数主要是对行列索引和数组的操作,包含对整个数据集进行内部的语义映射与统计整合,以此生成富于信息的图表。
在终端安装: pip install seaborn
官方文档:http://seaborn.pydata.org/index.html
seaborn官方文档
中文文档: https://seaborn.apachecn.org/#/README
seaborn官方中文文档(需要加速)
博主可以无偿私发
官方数据集: https://github.com/mwaskom/seaborn-data
1 Season入门
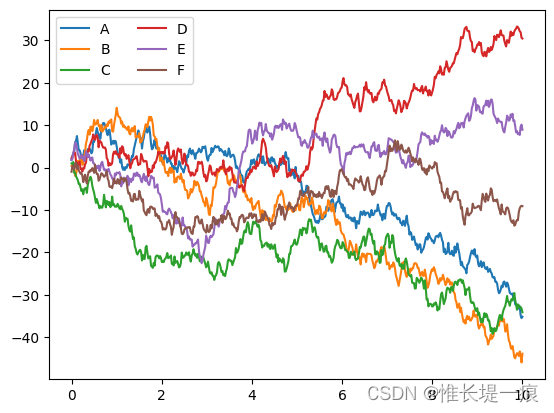
# 先看一下matplotlab的绘图
import matplotlib.pyplot as plt
import numpy as np

# 创建一些数据
# np.random.RandomState(0)  是一个随机数种子
# 通过该随机数种子生成的随机序列<正态分布>, 可以保证数据相同
rng = np.random.RandomState(0)
x = np.linspace(0, 10, num=500)
y = np.cumsum(rng.randn(500, 6), 0)  # 500行数据, 6列,  按照行计算
# 用Matplotlib默认样式画图
plt.plot(x, y)
plt.legend('ABCDEF', ncol=2, loc='upper left')
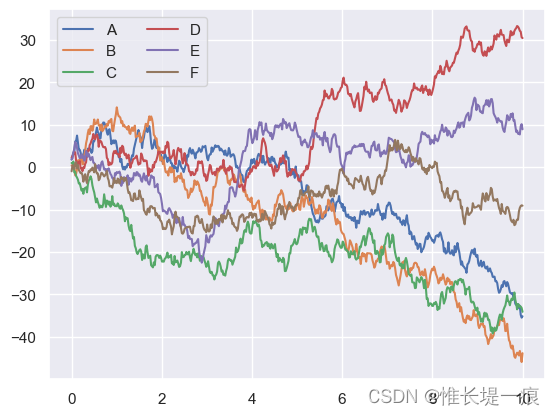
import seaborn as sns  # 导入
import matplotlib.pyplot as plt
import numpy as np

sns.set()  # 使用seaborn的默认配置, 可以直接对接matplotlib绘图

plt.plot(x, y)
plt.legend('ABCDEF', ncol=2, loc='upper left')
2 seaborn绘图
2.1 频次直方图
sns.set() 可以设置以下 Seaborn 参数:
- context:设定绘图上下文,可以是 “notebook” (默认值)或 “paper”。
- style:设定绘图风格,可以是 “white”(默认值)、“darkgrid”、“whitegrid”、“dark”、"white"等。
- palette:设定调色板,可以是 “default”(默认值)、“cubehelix”、"Set1"等。
- font:设定字体,可以是 “serif”(默认值)、“sans-serif”、“monospace”。
- axlinestyle:设定轴线样式,可以是 “–”、"steps-mid"等。
- savefig.dpi:保存图像的分辨率。
- figure.figsize:设定图像大小。
- print_grid:设定是否打印网格。
- verbose:设定是否显示信息提示。
import matplotlib.pyplot as plt
import seaborn as sns
import numpy as np
import pandas as pd
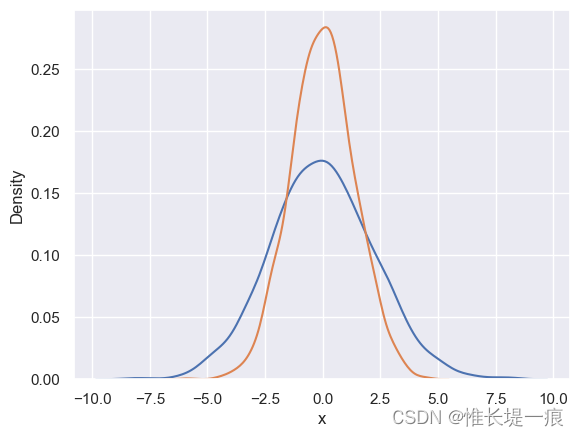
# 取的是正态分布的值
data=np.random.multivariate_normal([0,0],[[5,2],[2,2]],size=2000)
data=pd.DataFrame(data,columns=['x','y'])
sns.set()
# 绘制平滑估计图<直方图的拟合线>
sns.kdeplot(data['x'])
sns.kdeplot(data['y'])
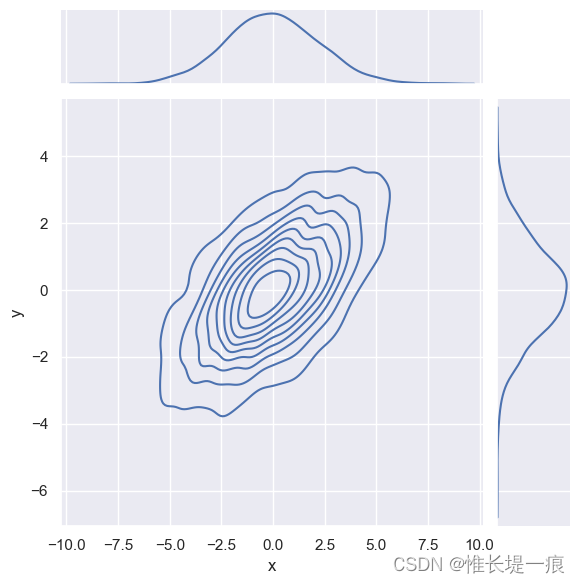
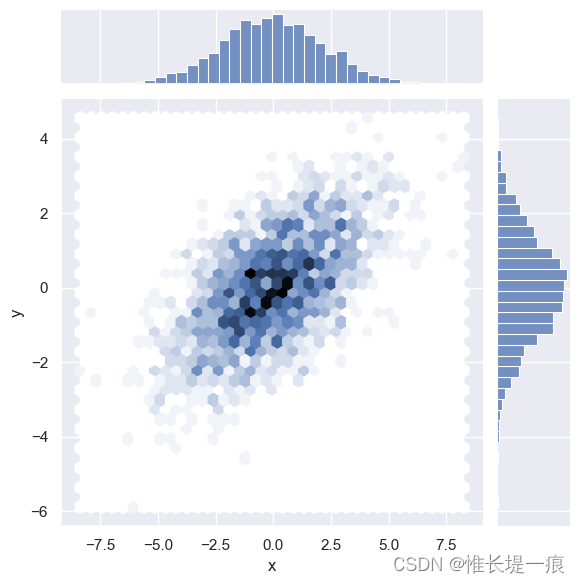
sns.jointplot(data=data,x='x',y='y',kind='kde')
#data 是你的数据集。
#x 和 y 是在数据集中你想要在联合图上表示的列的名字。
#kind 参数指定你想创建的联合图的类型。在这种情况下,你选择了 'kde',也就是核密度估计图。
# kind='hex' 六边形核密度图样式 kind='kde' 线条样式
# kind='hex' 六边形核密度图样式
sns.jointplot(data=data,x='x',y='y',kind='hex')
import matplotlib.pyplot as plt
import numpy as np
import pandas as pd
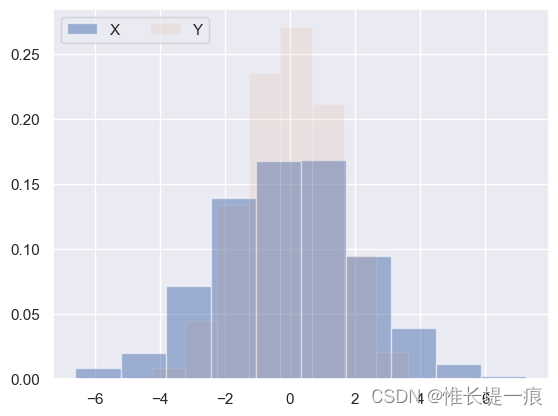
# 取的是正太分布的值
data = np.random.multivariate_normal([0, 0], [[5, 2], [2, 2]], size=2000)
data = pd.DataFrame(data, columns=['x', 'y'])
plt.hist(data['x'], density=True, alpha=0.5)
plt.hist(data['y'], density=True, alpha=0.1)
plt.legend('XY', ncol=2, loc='upper left')
plt.show()
2.2 矩阵图
sns.set()
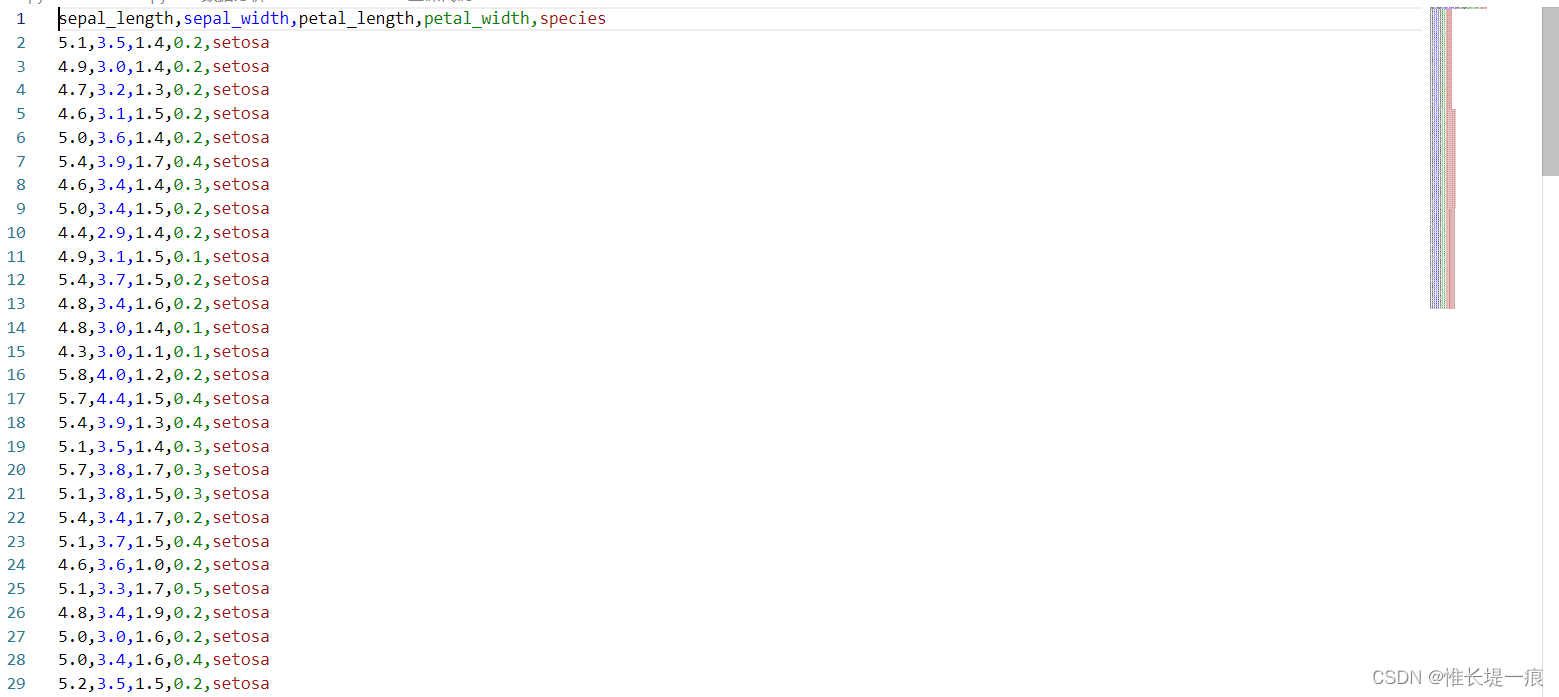
iris=pd.read_csv('./data/iris.csv')
#sepal_length萼片长度
#sepal_width萼片宽度
#petal_length花瓣长度
#petal_width花瓣宽度
#species 种类
iris
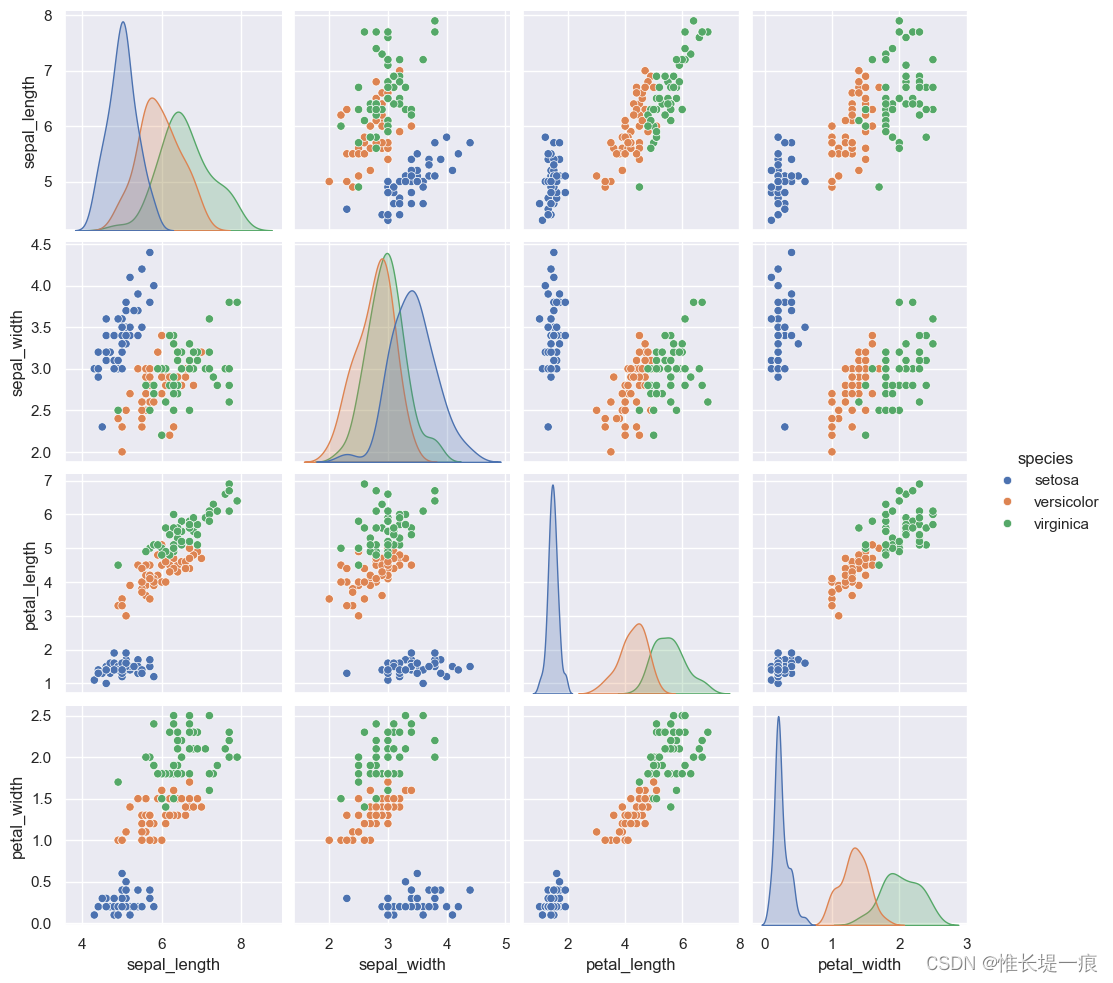
# pairplot  pair 成双成对, 描述数据两联高枝剪的关系, 线性, 非线性关系, 相关关系等等
# hue='species' 指定分类的字段, 将每个数据划分不同颜色
sns.pairplot(iris, hue='species')
2.3 分面频次图
tips=pd.read_csv('./data/tips.csv')
tips
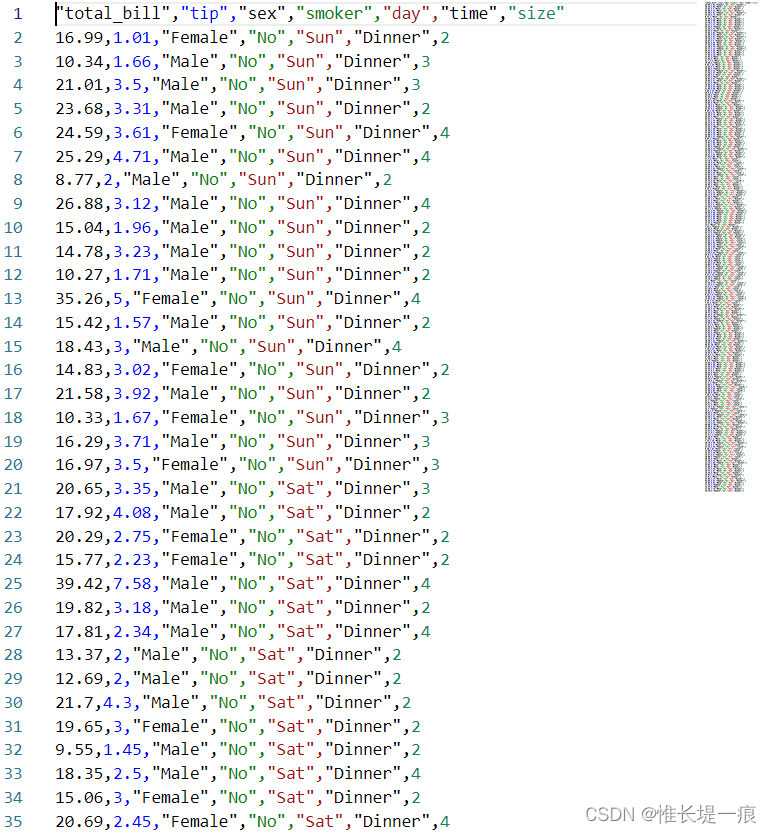
# 计算消费占总餐费的比重
tips['tip_proportion']=tips['tip']/tips['total_bill']*100

# margin_titles  显示字段标题
grid=sns.FacetGrid(data=tips,row='sex',col='time',margin_titles=True)

grid.map(plt.hist,'tip_proportion',bins=np.linspace(0,40,15))
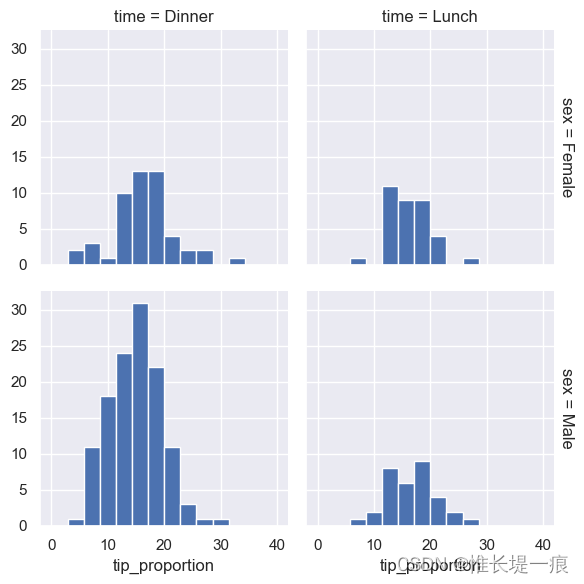
为什么男人在晚上给的小费比中午多很多呢?
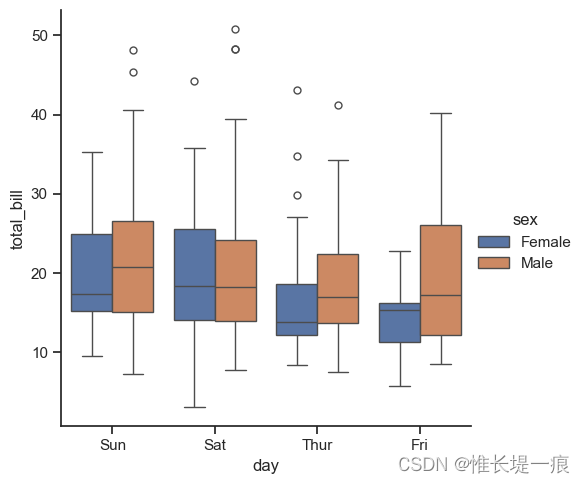
2.4 箱线图
tips

with sns.axes_style(style='ticks'):
    sns.catplot(data=tips,x='day',y='total_bill',hue='sex',kind='box')
    #kind: 绘图类型:violin 小提琴图   swarm 散点图 box 箱线图
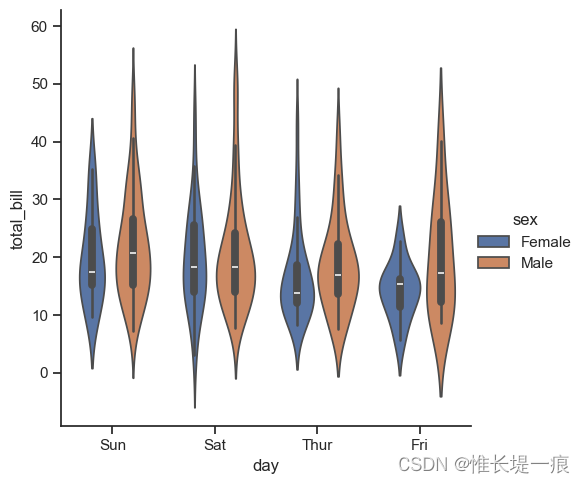
2.5 分类图
with sns.axes_style(style='ticks'):
    sns.catplot(data=tips,x='day',y='total_bill',hue='sex',kind='violin')
with sns.axes_style(style='ticks'):
    sns.catplot(data=tips,x='day',y='total_bill',hue='sex',kind='swarm')
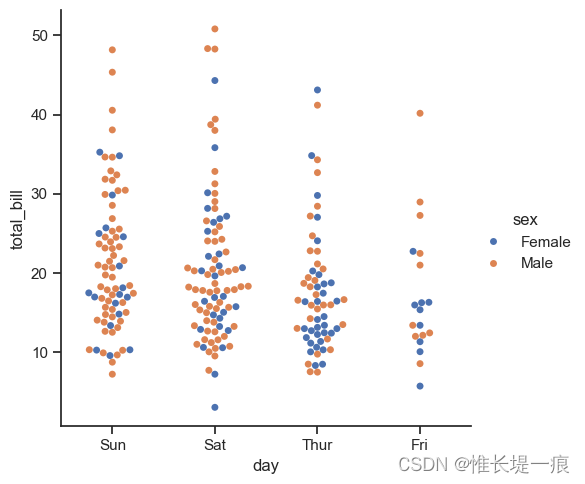
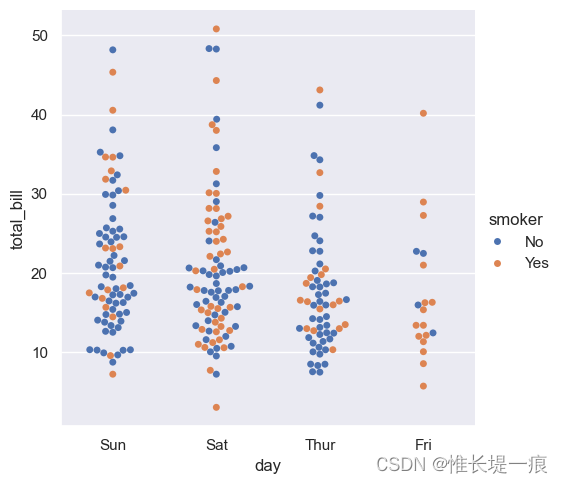
sns.catplot(data=tips, x='day', y='total_bill', hue='smoker', kind='swarm')
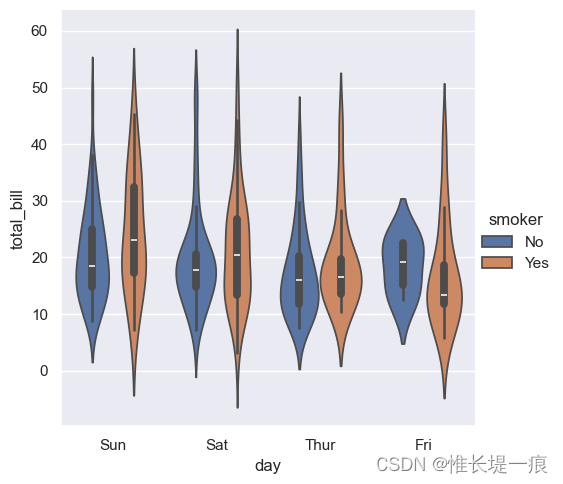
sns.catplot(data=tips, x='day', y='total_bill', hue='smoker', kind='violin')
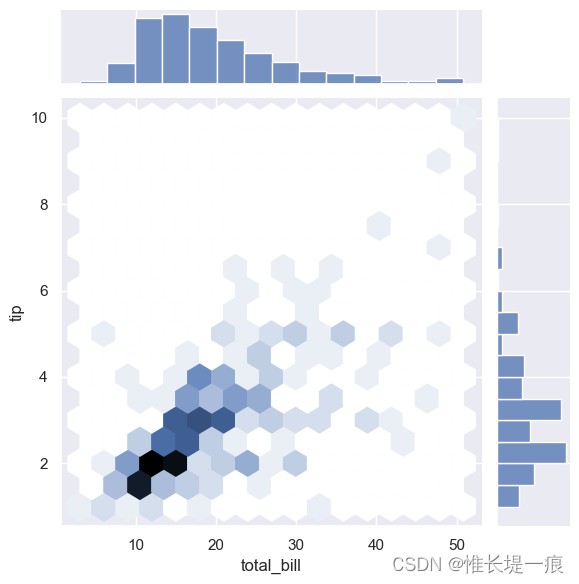
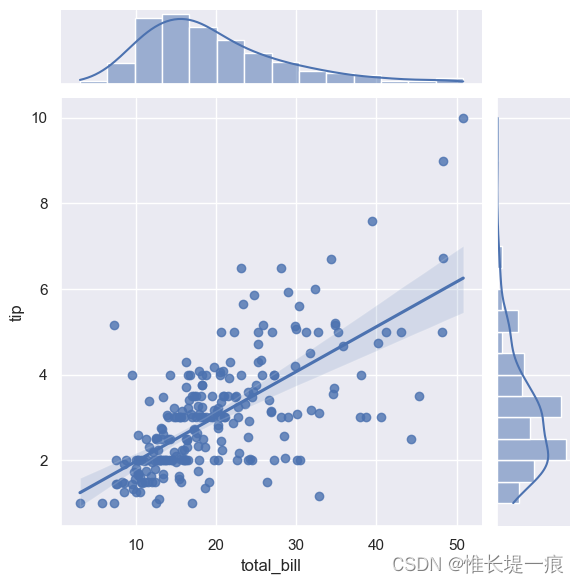
2.6 联合分布图
依旧使用tips数据
sns.set()
sns.jointplot(data=tips,x='total_bill',y='tip',kind='hex')
sns.jointplot(data=tips, x='total_bill', y='tip', kind='reg')
# reg= 构建线性回归的拟合线条
- pyecharts 侧重于显示数据, 有动态数据交互效果
- matplotlib 绘制平面图
- seaborn 画图研究数据
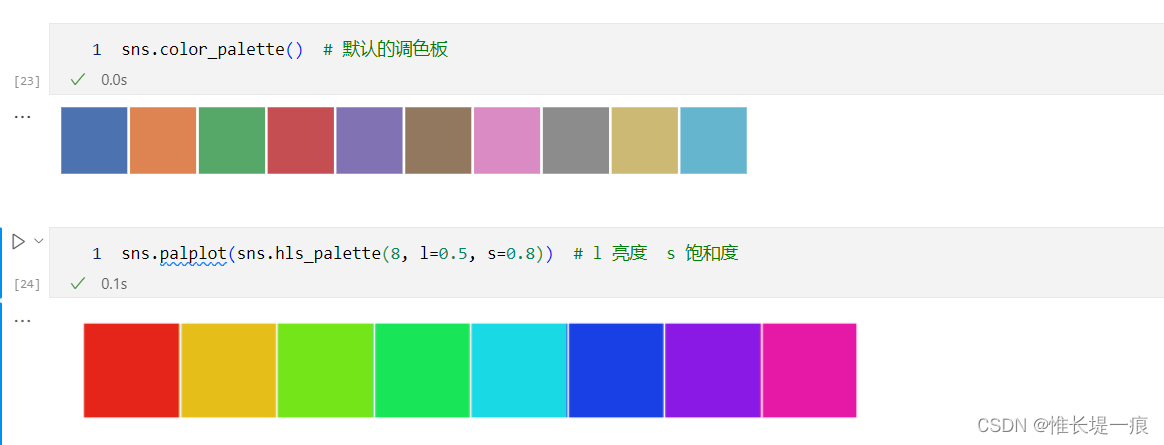
2.7 调色板
sns.color_palette() # 默认的调色板
sns.palplot(sns.hls_palette(8, l=0.5, s=0.8)) # l 亮度 s 饱和度


 1010
1010


 被折叠的 条评论
为什么被折叠?
被折叠的 条评论
为什么被折叠?
 到【灌水乐园】发言


