


1.Matplotlib库的介绍
Matplotlib库由各种可视化类构成,内部结构复杂,受Matlab启发,matplotlib.pyplot是绘制各类可视化图形的命令子库,相当与快捷方式。
#plt是引入模块的别名,这是一种约定俗成的引入名称
import matplotlib.pyplot as plt
Matplotlib库小测
1.绘制简单的折线图
import matplotlib.pyplot as plt

plt.plot([3,1,4,5,2])
plt.ylabel('Grade')
plt.show()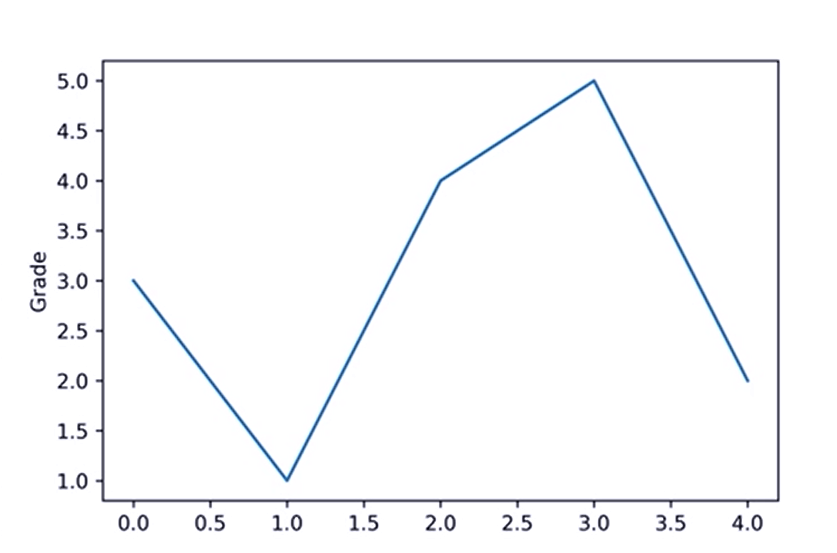
2.将绘制的图保存成文件
import matplotlib.pyplot as plt

plt.plot([3,1,4,5,2])
plt.ylabel('Grade')
plt.savefig('D://test',dpi=600)
3.同时添加X轴和Y轴的数组绘图
import matplotlib.pyplot as plt

plt.plot([0,2,4,6,8],[3,1,4,5,2])
plt.ylabel('Grade')
plt.axis([-1,10,0,6])
plt.show()
eg:
plt.sublot(3,2,4)
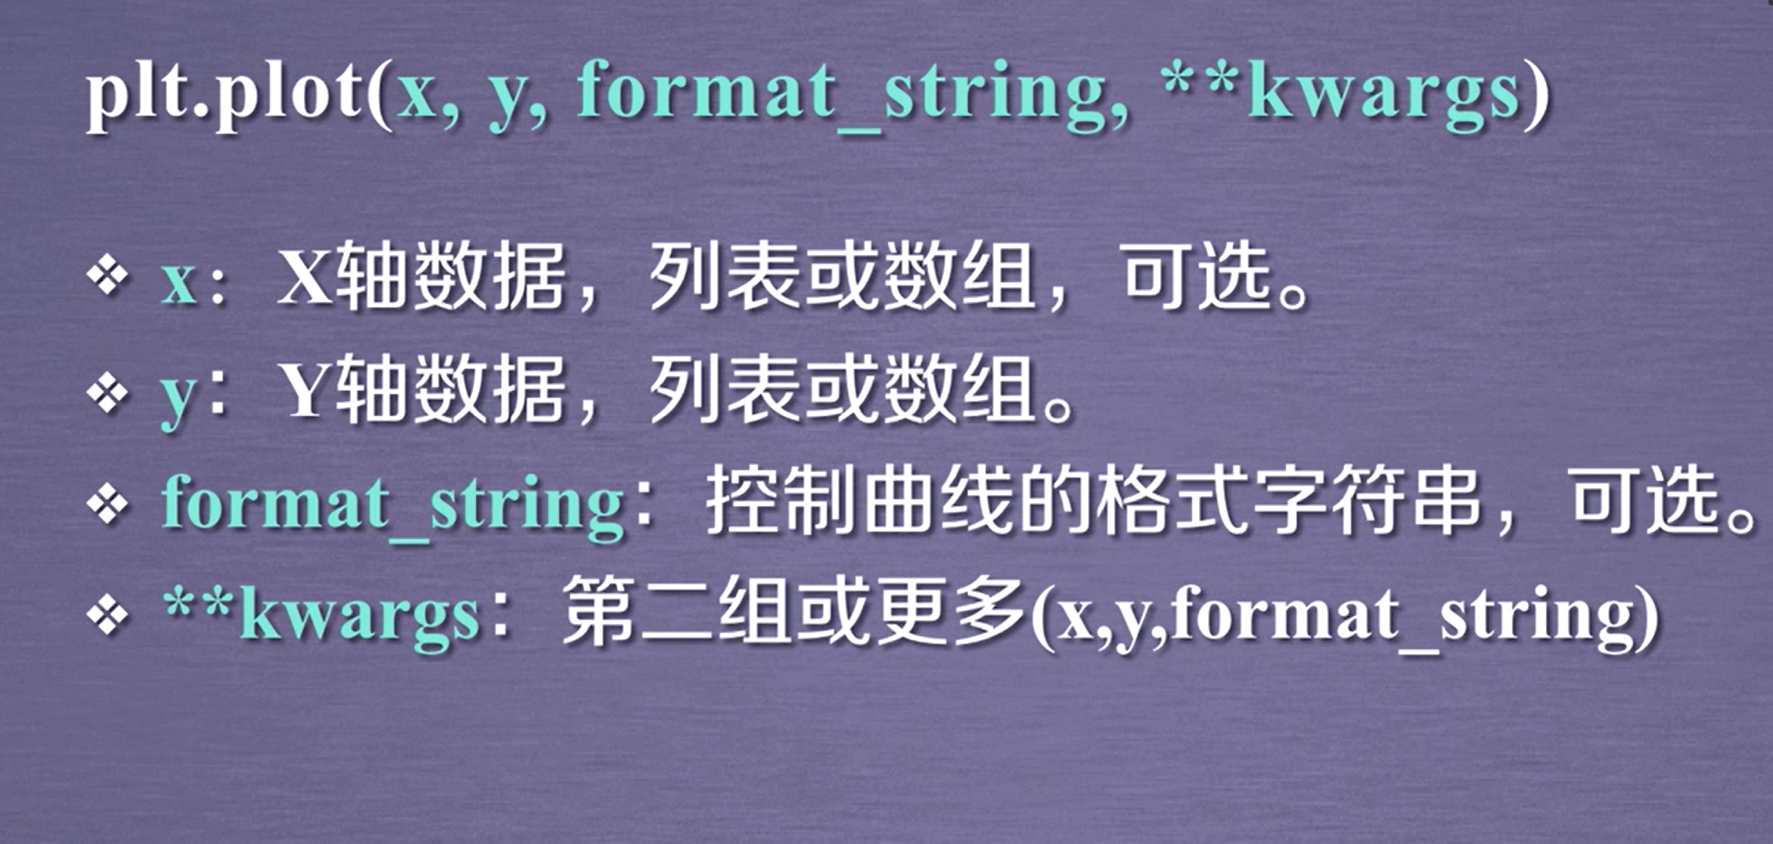
2.pyplot的plot()函数
eg:
import numpy as np
import matplotlib.pyplot as plt

a=np.arange(10)
plt.plot(a,a*1.5,a,a*2.5,a,a*3.5,a,a*4.5)
plt.show()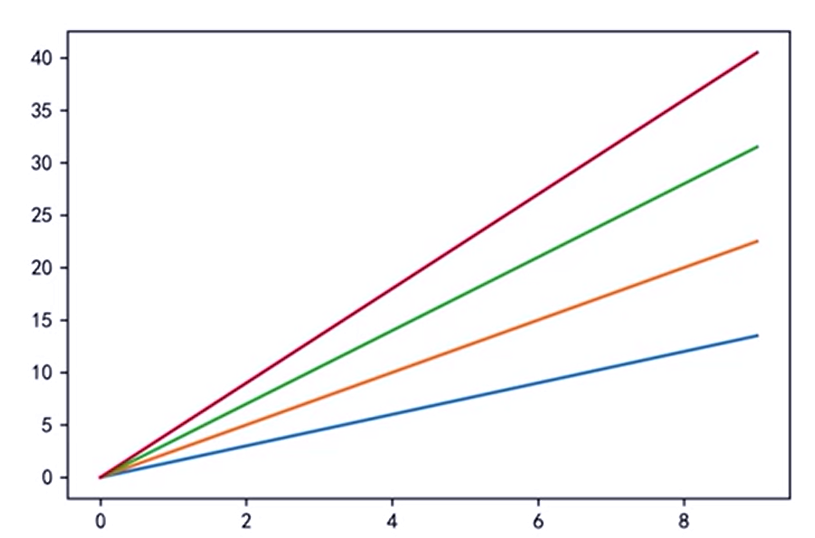
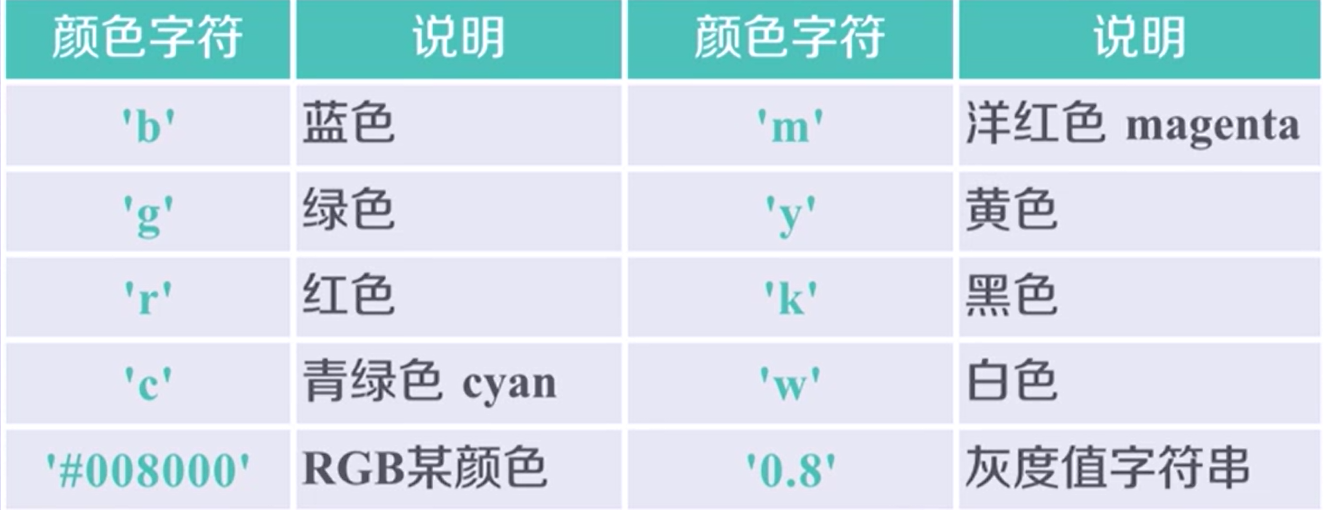
format_string:控制曲线的格式字符串,可选。由颜色字符、风格字符和标记字符组成。
颜色字符:
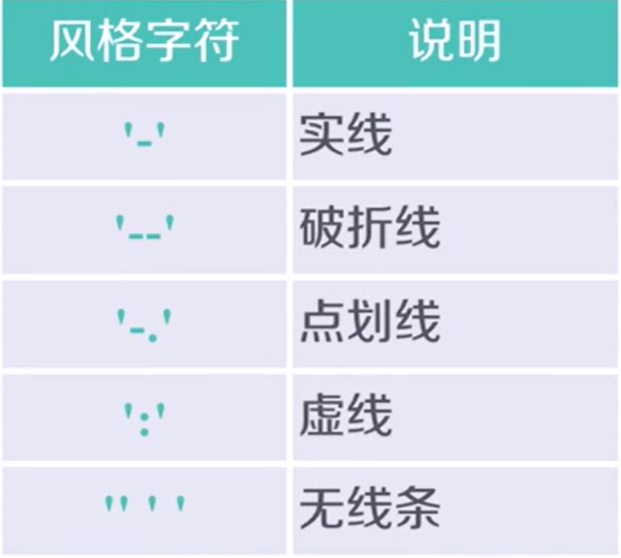
风格字符:
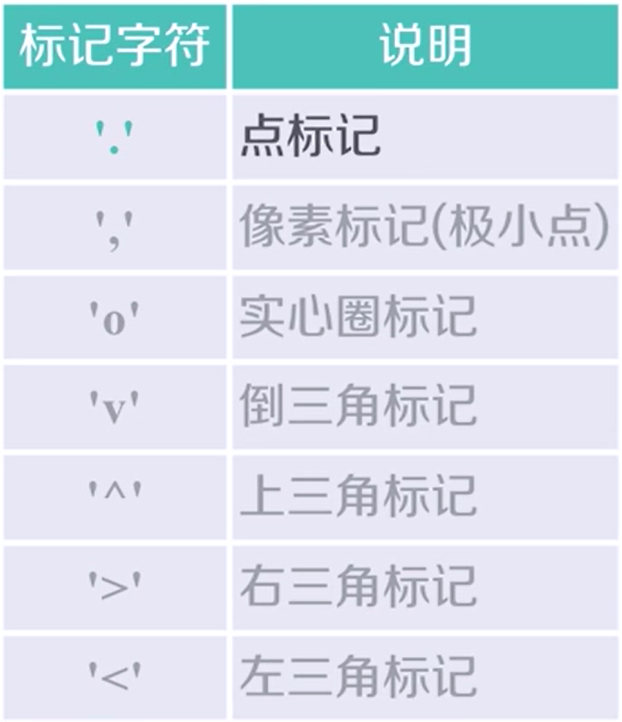
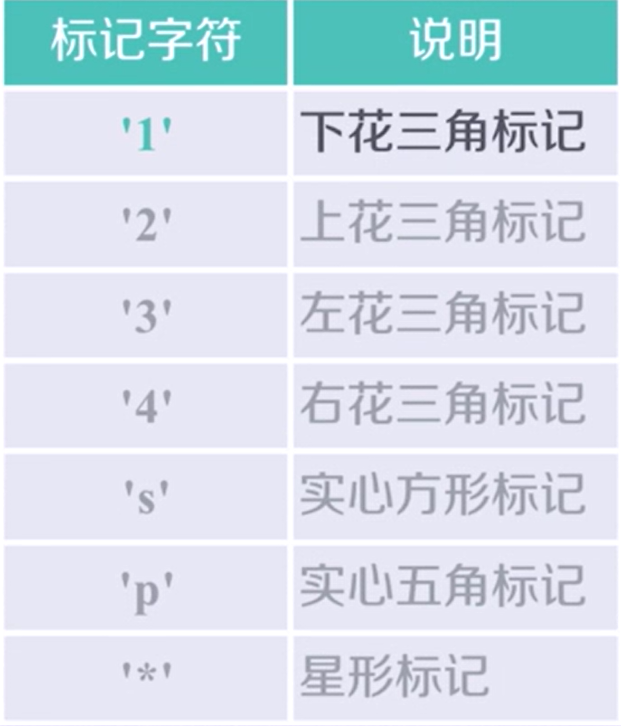
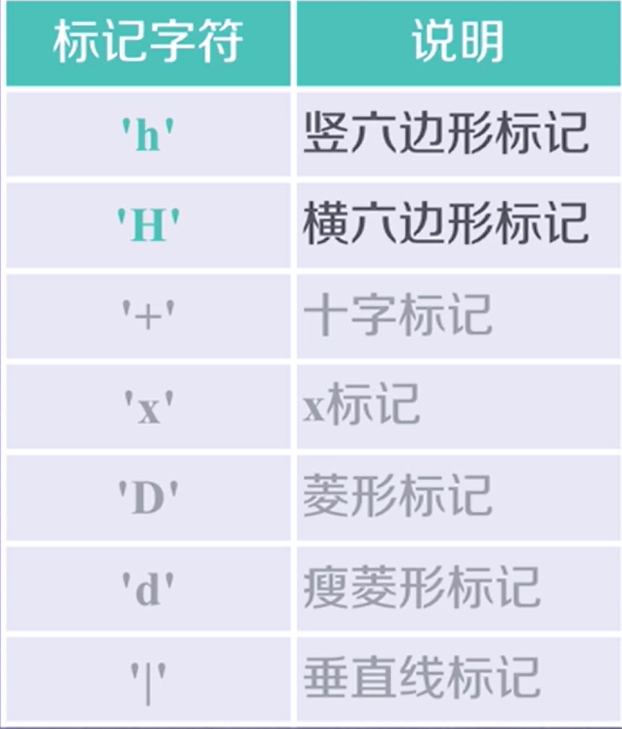
标记字符:
eg:
import numpy as np
import matplotlib.pyplot as plt

a=np.arange(10)
plt.plot(a,a*1.5,'bo-',a,a*2.5,'gx--',a,a*3.5,'r-.',a,a*4.5,'y*:')
plt.show()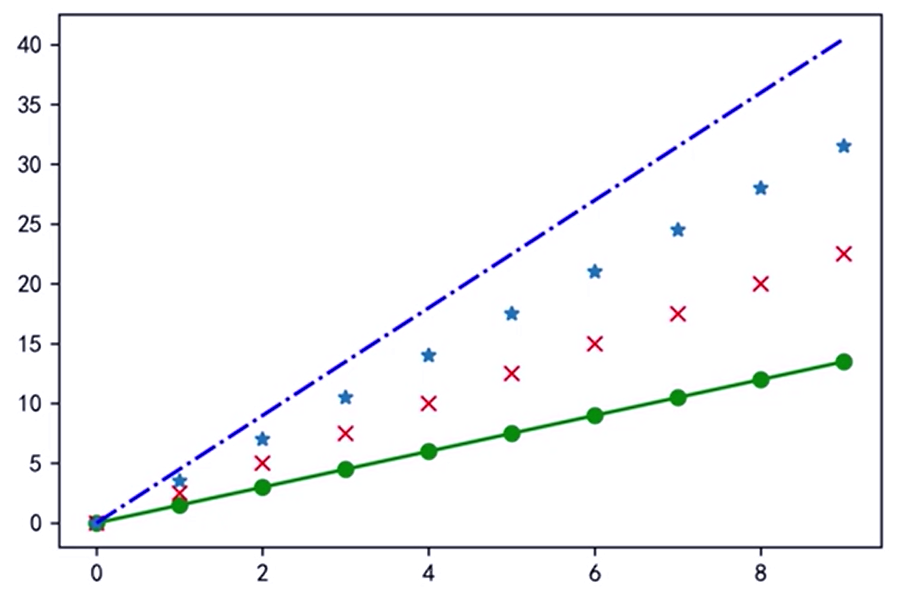
3.pyplot的中文显示
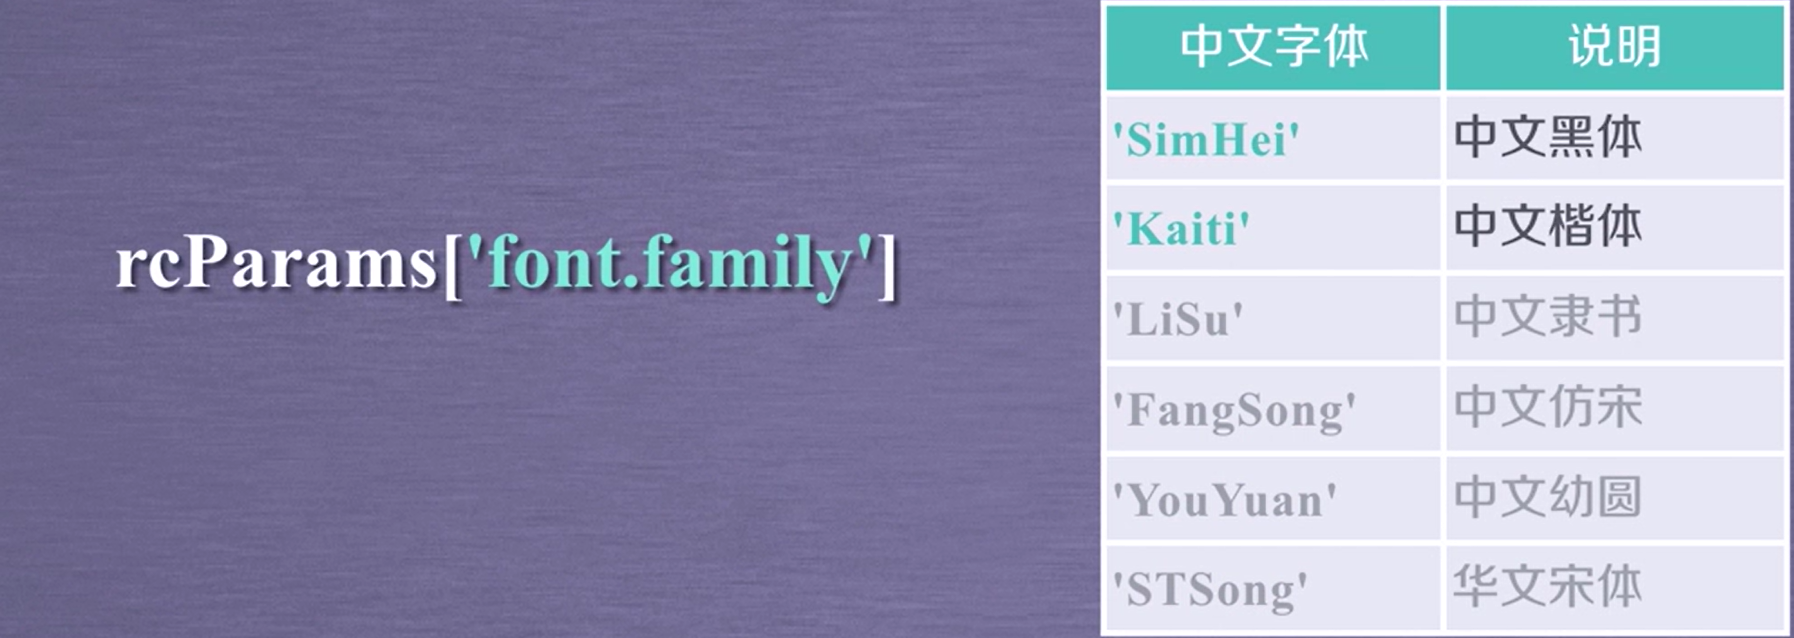
使用rcParams修改字体
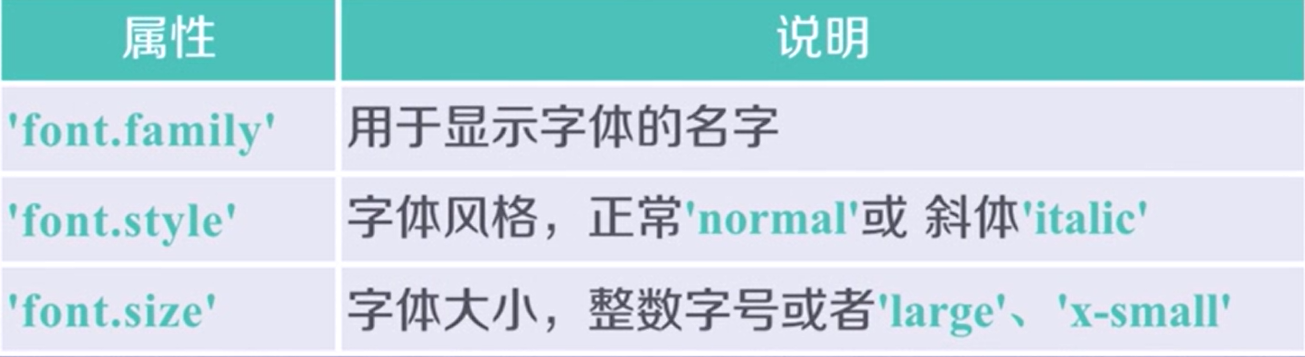
raParams的属性:
中文字体的种类:
eg:
import numpy as np
import matplotlib
import matplotlib.pyplot as plt

matplotlib.rcParams['font.family']='Kaiti'
matplotlib.rcParams['font.size']=12
matplotlib.rcParams['font.style']='normal'
a=np.arange(0.0,5.0,0.02)
plt.ylabel('纵轴:振幅')
plt.xlabel('横轴:时间')
plt.plot(a,np.cos(2*np.pi*a),'b--')
plt.show()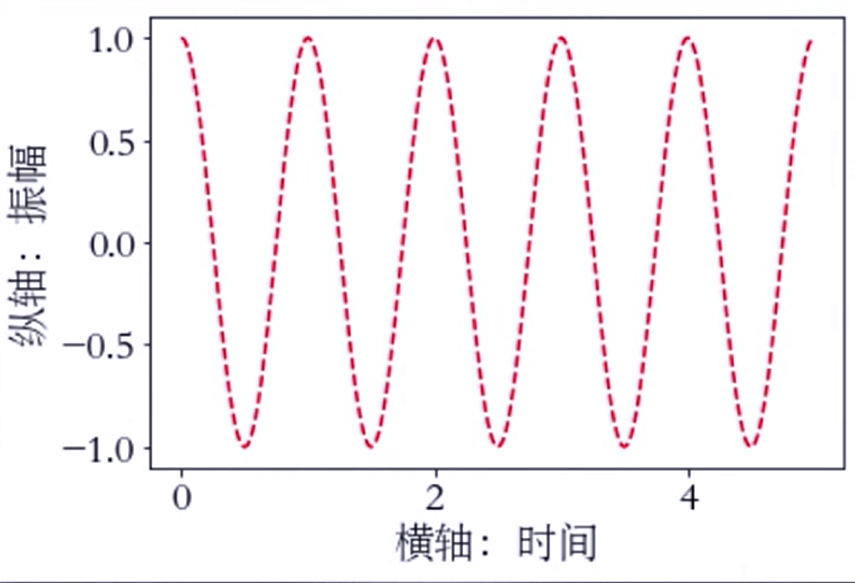
在有中文输出的地方增加一个属性:fontproperties
import numpy as np
import matplotlib
import matplotlib.pyplot as plt

a=np.arange(0.0,5.0,0.02)
plt.ylabel('纵轴:振幅',fontproperties='SimHei',fontsize=12)
plt.xlabel('横轴:时间',fontproperties='SimHei',fontsize=12)
plt.plot(a,np.cos(2*np.pi*a),'b--')
plt.show()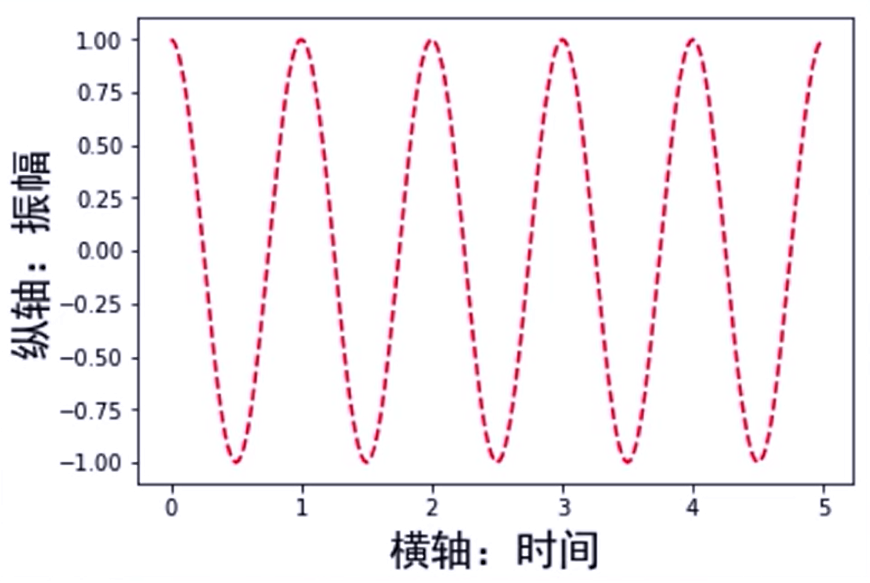
4.pyplot的文本显示函数
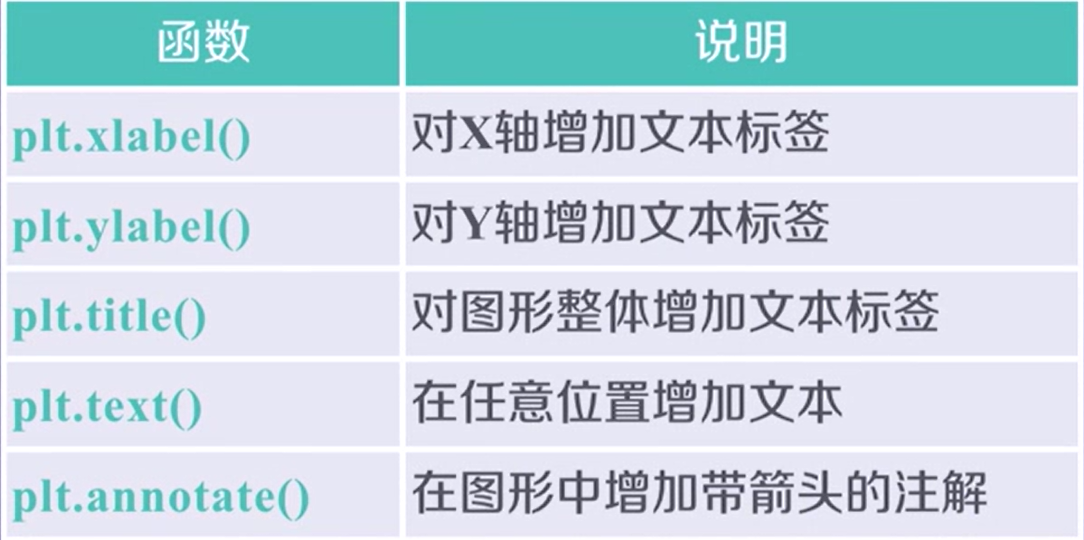
eg:
import numpy as np
import matplotlib
import matplotlib.pyplot as plt

a=np.arange(0.0,5.0,0.02)
plt.plot(a,np.cos(2*np.pi*a),'b--')
plt.ylabel('纵轴:振幅',fontproperties='SimHei',fontsize=12,color='green')
plt.xlabel('横轴:时间',fontproperties='SimHei',fontsize=12)
plt.title('正弦波实例 $y=cos(2\pi x)$',fontproperties='SimHei',fontsize=20,color='red')
plt.text(2,1,r'$\mu=100$',fontsize=15)
plt.axis([-1,6,-2,2])
plt.show()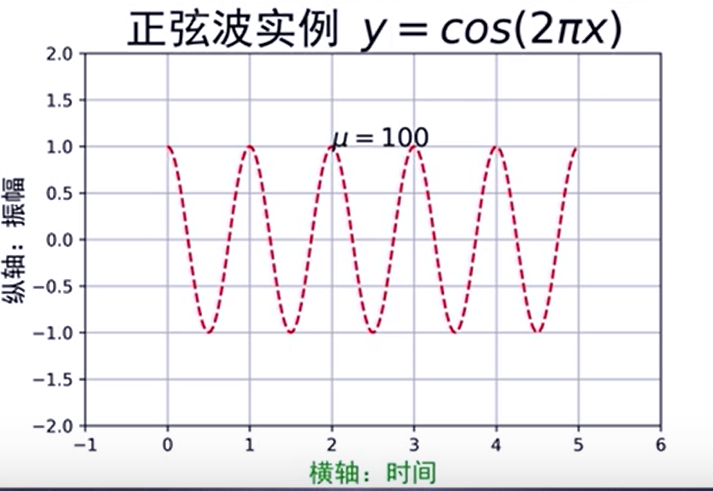
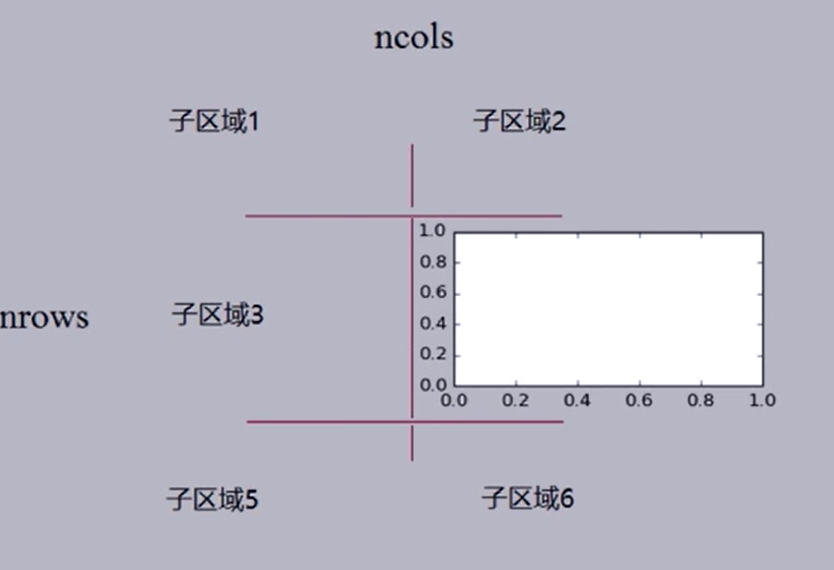
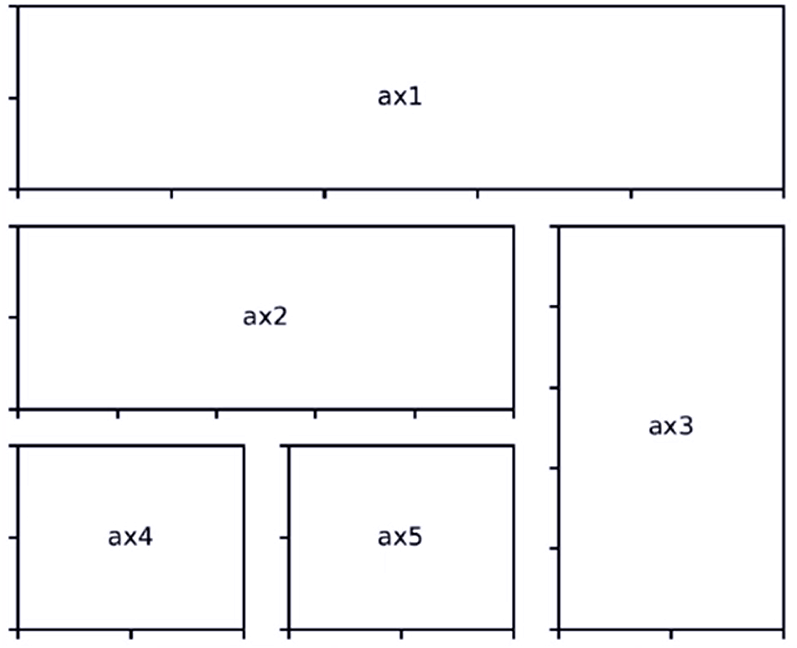
5.pyplot的子绘图区域
subplot2grid()
虽然使用plt.subplot()方法也可以设置绘图区域,但是这种方法过于繁琐。当绘图子区域过多时,实际中更多使用plt.subplot2grid()方法。
plt.subplot2grid(GridSepc,CurSpec,colspan=1,rowspan=1)
理念:设定网格,选中网格,确定选中行列区域数量,编号从0开始
划分区域效果:
plt.subplot2grid((3,3),(0,0),colspan=3)
...
plt.subplot2grid((3,3),(1,0),colspan=2)
...
plt.subplot2grid((3,3),(1,2),colspan=2)
...
plt.subplot2grid((3,3),(2,0))
...
plt.subplot2grid((3,3),(2,1))
...
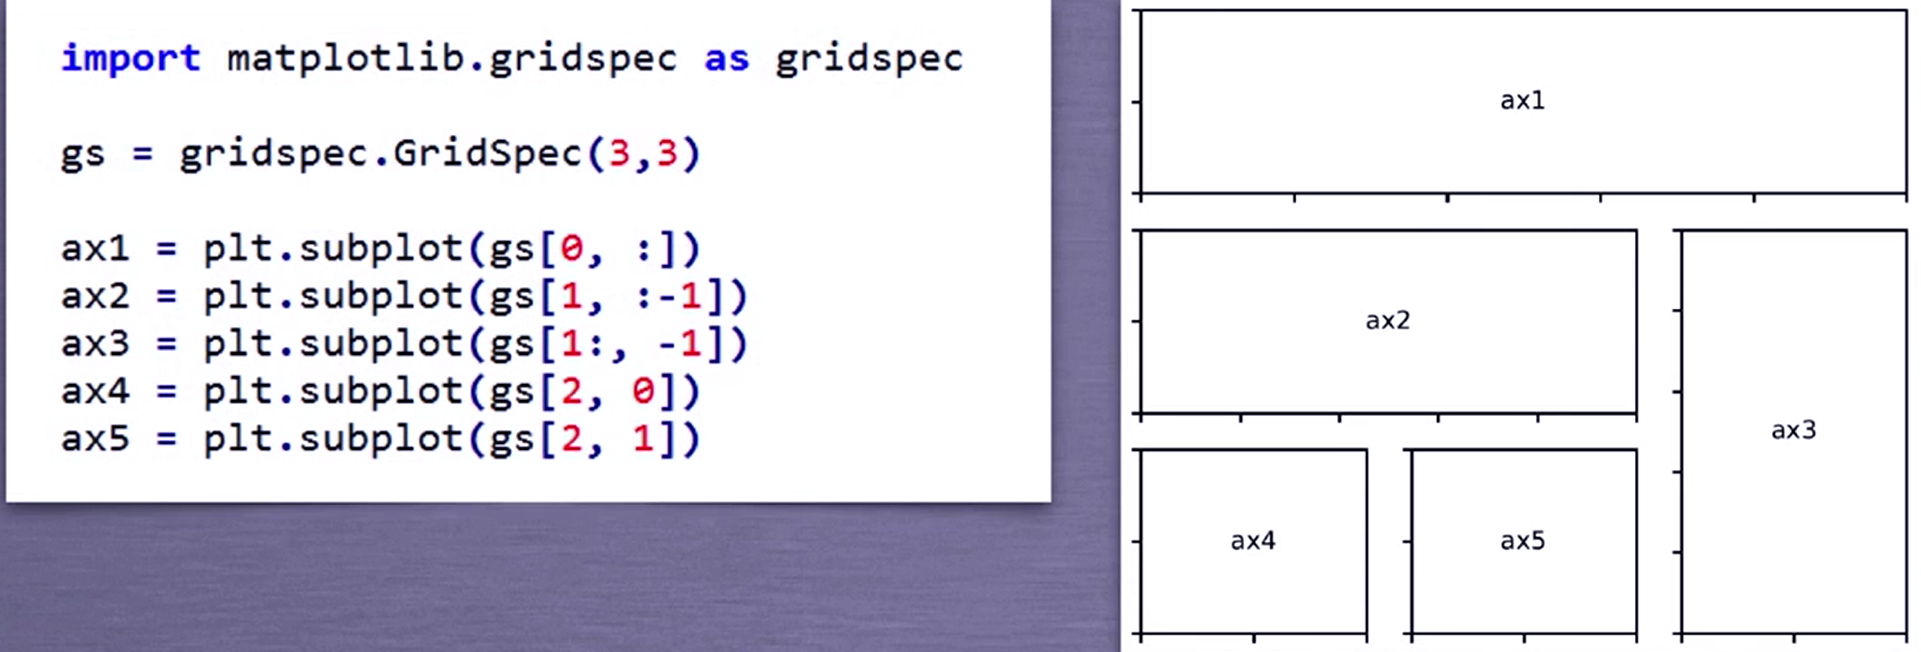
2.GridSpec类
使用GridSpec类可以达到和subplot2grid()方法相同的效果。
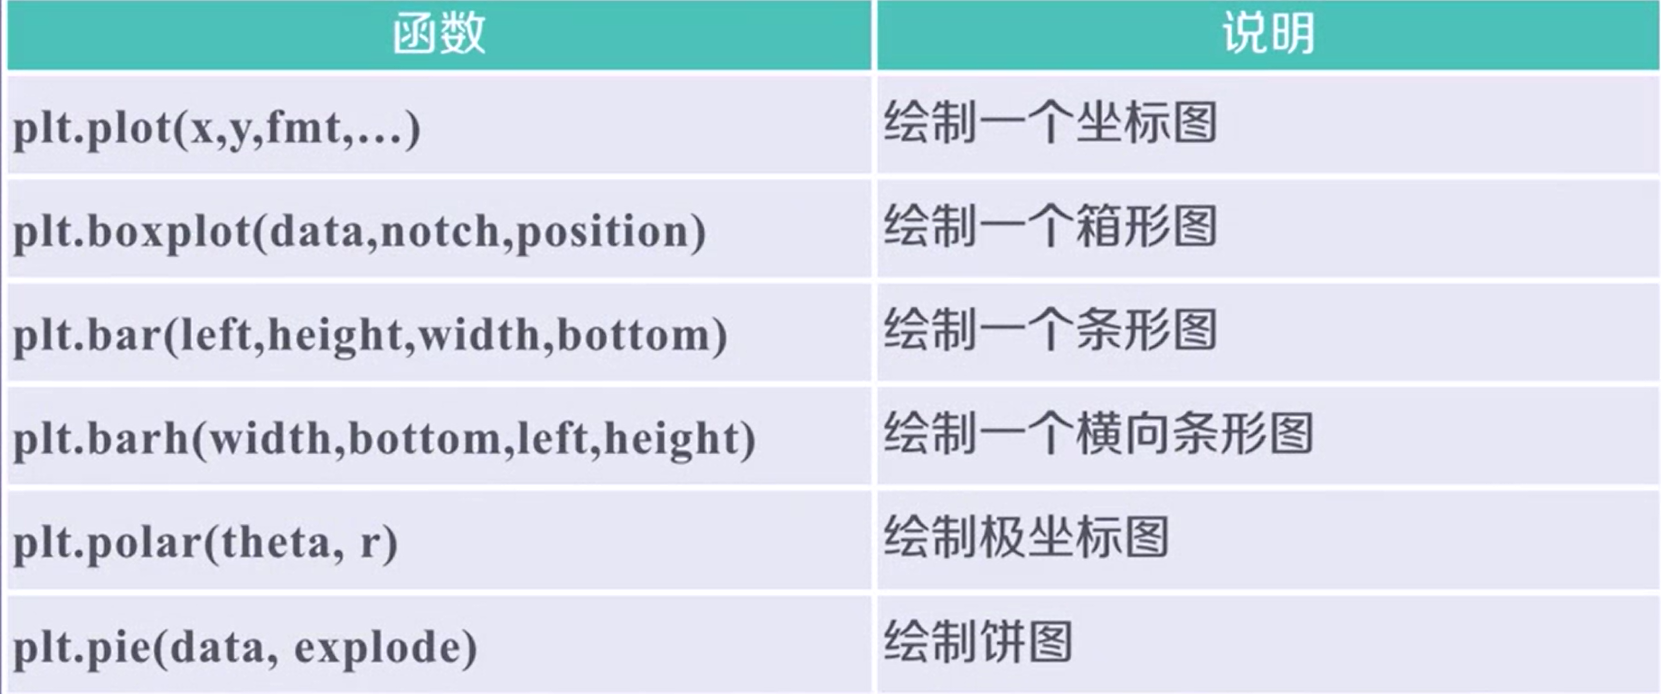
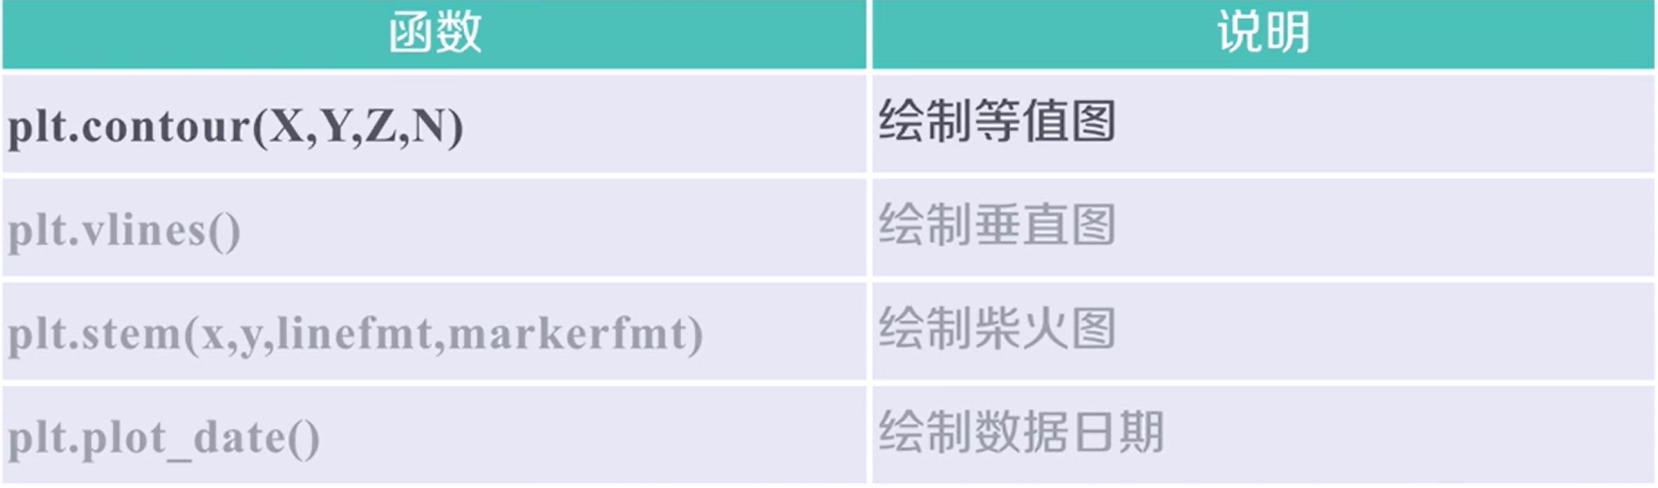
6.pyplot的基础图标函数


 394
394


 被折叠的 条评论
为什么被折叠?
被折叠的 条评论
为什么被折叠?
 到【灌水乐园】发言


