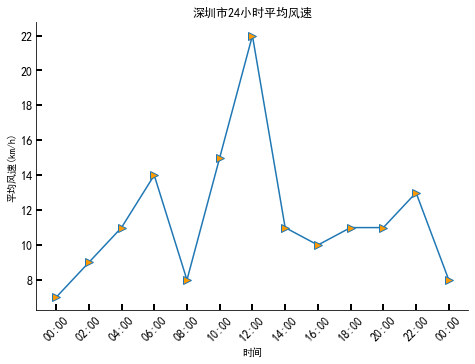
import numpy as np
from datetime import datetime
import matplotlib.pyplot as plt
from matplotlib.dates import DateFormatter,HourLocator
plt.rcParams["font.sans-serif"]=["SimHei"]
plt.rcParams["axes.unicode_minus"]=False
dates=['201910240','2019102402','2019102404','2019102406','2019102408','2019102410','2019102412','2019102414','2019102416',
'2019102418','2019102420','2019102422','201910250']
x_date=[datetime.strptime(d,'%Y%m%d%H') for d in dates]
y_data=np.array([7,9,11,14,8,15,22,11,10,11,11,13,8])
fig=plt.figure()
ax=fig.add_axes((0.0,0.0,1.0,1.0))
ax.plot(x_date,y_data,'->',ms=8,mfc='#FF9900')
ax.set_title('深圳市24小时平均风速')
ax.set_xlabel('时间')
ax.set_ylabel('平均风速(km/h)')
date_fmt=DateFormatter('%H:%M')
ax.xaxis.set_major_formatter(date_fmt)
ax.xaxis.set_major_locator(HourLocator(interval=2))
ax.tick_params(direction='in',length=6,width=2,labelsize=12)
ax.xaxis.set_tick_params(labelrotation=45)
ax.spines['top'].set_color('none')
ax.spines['right'].set_color('none')
plt.show()


 被折叠的 条评论
为什么被折叠?


