


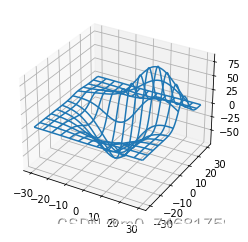
import matplotlib.pyplot as plt
from mpl_toolkits.mplot3d import axes3d
fig=plt.figure()
ax=fig.add_subplot(111,projection='3d')
X,Y,Z=axes3d.get_test_data(0.05)
ax.plot_wireframe(X,Y,Z,rstride=10,cstride=10)
plt.show()
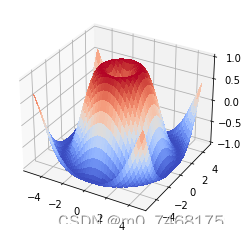
import matplotlib.pyplot as plt
from mpl_toolkits.mplot3d import axes3d
from matplotlib import cm
import numpy as np
x1=np.arange(-5,5,0.25)
y1=np.arange(-5,5,0.25)
x1,y1=np.meshgrid(x1,y1)
r1=np.sqrt(x1**2+y1**2)
z1=np.sin(r1)
fig=plt.figure()
ax=fig.add_subplot(111,projection='3d')
ax.plot_surface(x1,y1,z1,cmap=cm.coolwarm,linewidth=0,antialiased=False)
ax.set_zlim(-1.01,1.01)
plt.show()


 3万+
3万+


 被折叠的 条评论
为什么被折叠?
被折叠的 条评论
为什么被折叠?
 到【灌水乐园】发言


