


技术要点
- vue2
- less
- echarts
- v-charts
- flexible
主要采用v-charts+echarts进行实现图表可视化
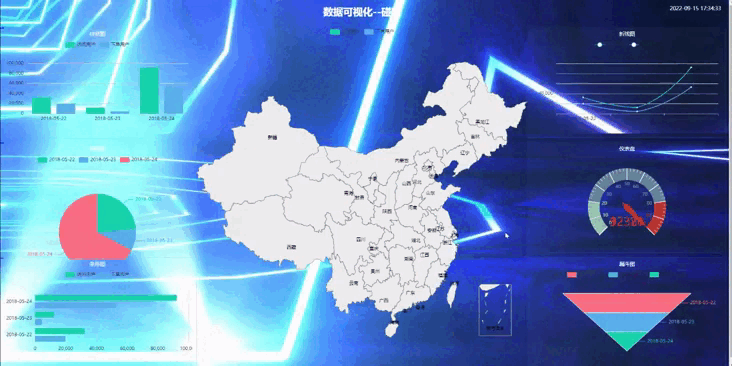
效果图
项目搭建
采用vue-cli脚手架进行项目创建
vue create 项目名称
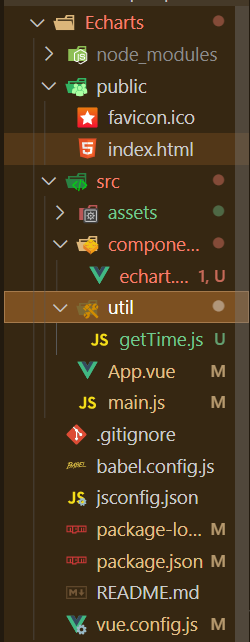
项目结构:
代码编写
v-charts官网:https://v-charts.js.org/#/
首先看到上方目录结构进行主要分析
- util:封装了个获取当前时间的工具类
- components:编写图表可视化页面
- assets:存放静态资源
依赖安装:
npm i v-charts echarts -S
npm i -s lib-flexible
flexible的使用请自行参考网络上的文章,它是与rem做配合实现自适应的
入口文件main:
引入VCharts以及flexible自适应布局的东西
import Vue from 'vue'
import App from './App.vue'
import VCharts from 'v-charts'//引入vcharts图表(饿了么开发!)
import 'lib-flexible/flexible.js'
Vue.use(VCharts)
Vue.config.productionTip = false
new Vue({
  render: h => h(App),
}).$mount('#app')
getTime.js工具类
/**
 * 补零
 */
const addZero = function (num) {
    if (parseInt(num) < 10) {
        num = "0" + num
    }
    return num
}
/**
毫秒转日期
*/
export const formatDate = (ms) => {
    // console.log(ms)
    /**
     * ms:毫秒数
     */
     if (ms) {
        var oDate = new Date(ms),
            oYear = oDate.getFullYear(),
            oMonth = oDate.getMonth() + 1,
            oDay = oDate.getDate(),
            oHour = oDate.getHours(),
            oMin = oDate.getMinutes(),
            oSen = oDate.getSeconds(),
            oTime = oYear + '-' + addZero(oMonth) + '-' + addZero(oDay) + ' ' + addZero(oHour) + ':' +
                addZero(oMin) + ':' + addZero(oSen);
        return oTime;
    } else {
        return ""
    }
}
echart.vue
<template>
  <div>
    <video id="myvideo">
      <source src="../assets/潮点网_84979.mp4" />
    </video>
    <!-- 头部 -->
    <header>
      <h1>数据可视化--碰磕</h1>
      <div class="time">{{nowTime}}</div>
    </header>
    <section class="main_box">
      <div class="box_children">
        <div class="panel bar">
          <h2>柱状图</h2>
          <div class="chart">
            <ve-histogram :data="chartData" width="100%" height="100%"></ve-histogram>
          </div>
          <div class="panel_footer"></div>
        </div>
        <div class="panel bar">
          <h2>饼形图</h2>
          <div class="chart">
            <ve-pie :data="chartData" width="100%" height="100%"></ve-pie>
          </div>
          <div class="panel_footer"></div>
        </div>
        <div class="panel bar">
          <h2>条形图</h2>
          <div class="chart">
            <ve-bar :data="chartData" width="100%" height="100%"></ve-bar>
          </div>
          <div class="panel_footer"></div>
        </div>
      </div>
      <div class="box_children">
        <ve-map :data="chartData" width="100%" height="100%"></ve-map>
      </div>
      <div class="box_children">
        <div class="panel bar">
          <h2>折线图</h2>
          <div class="chart">
            <ve-line :data="chartData" width="100%" height="100%"></ve-line>
          </div>
          <div class="panel_footer"></div>
        </div>
        <div class="panel bar">
          <h2>仪表盘</h2>
          <div class="chart">
            <ve-gauge :data="chartData" width="100%" height="100%"></ve-gauge>
          </div>
          <div class="panel_footer"></div>
        </div>
        <div class="panel bar">
          <h2>漏斗图</h2>
          <div class="chart">
            <ve-funnel :data="chartData" width="100%" height="100%"></ve-funnel>
          </div>
          <div class="panel_footer"></div>
        </div>
      </div>
    </section>
  </div>
</template>

<script>
import {formatDate} from '../util/getTime'
export default {
  name: 'myEchart',
  data(){
    return{
      nowTime:'',
      mytime:null,
      chartData:{
        columns: ['日期', '访问用户', '下单用户'],
        rows: [
          { '日期': '2018-05-22', '访问用户': 32371, '下单用户': 19810 },
          { '日期': '2018-05-23', '访问用户': 12328, '下单用户': 4398 },
          { '日期': '2018-05-24', '访问用户': 92381, '下单用户': 52910 }
        ]
      }
    }
  },
  created(){
    this.mytime=setInterval(() => {
      let now=new Date();
      let time=now.getTime()+1000;
      this.nowTime=formatDate(time)
    }, 1000);
  },
  mounted(){
    this.playvideo();//播放视频
  },
  beforeDestroy(){
    clearInterval(this.mytime);//关闭倒计时
  },
  methods:{
    chartEvents(val){
      console.log(val);
    },
    playvideo(){
      let video = document.getElementById("myvideo");
      //调用video标签的播放函数
      setTimeout(() => {
        video.play();
      }, 2000);
    }
  }
}
</script>
<style lang="less" scoped>
video{
position: fixed; right: 0; bottom: 0;
min-width: 100%; min-height: 100%;
width: auto; height: auto; z-index: -100;
}
header{
  height: 1.25rem;
  // background: rgb(235, 230, 135);
  h1{
    text-align: center;
    line-height: 1.25rem;
    font-size: 0.475rem;
    color: #fff;
  }
  .time{
    position: absolute;
    top: 0;
    right: 0.375rem;
    line-height: 0.9375rem;
    color: white;
    font-size: 0.25rem;
  }
}
.main_box{
    display: flex;
    min-width: 1024px;
    max-width: 1920px;
    margin: 0 auto;
    // background-color: #666666;
    padding: .125rem .125rem 0;
    .box_children{
      flex: 3;
    }
    // 第二个盒子占五份
    .box_children:nth-child(2){
      flex: 5;
    }
    .panel{
        height: 30vh;
        padding: 0 0.1875rem 0.5rem;
        margin-bottom: 0.1875rem;
        border: 1px solid rgba(25, 186, 139, 0.17);
        background: rgba(255, 255, 255, 0.03);
        &::before{
          position: absolute;
          // top: 0;
          left: 0.1875rem;
          width: 10px;
          height: 10px;
          border-left: 2px solid blue;
          border-top: 2px solid blue;
          content: '';
        }
        &::after{
          position: absolute;
          top: 0;
          right: 0;
          width: 10px;
          height: 10px;
          border-right: 2px solid blue;
          border-top: 2px solid blue;
          content: '';
        }
        .panel_footer{
          position: absolute;
          bottom: 0;
          left: 0;
          width: 100%;
          &::before{
          position: absolute;
          bottom: 0;
          left: 0;
          width: 10px;
          height: 10px;
          border-left: 2px solid blue;
          border-bottom: 2px solid blue;
          content: '';
          }
          &::after{
            position: absolute;
            bottom: 0;
            right: 0;
            width: 10px;
            height: 10px;
            border-right: 2px solid blue;
            border-bottom: 2px solid blue;
            content: '';
          }
        }
        h2{
          height: .6rem;
          color: #fff;
          line-height: 0.6rem;
          text-align: center;
          font-size: 0.25rem;
          font-weight: 400;
        }
        .chart{
          height: 5rem;
        }
      }
  }
</style>
这样就实现了,这里背景图用的是一个炫酷的视频,开发者可自行替换成自己的视频…


 419
419


 被折叠的 条评论
为什么被折叠?
被折叠的 条评论
为什么被折叠?
 到【灌水乐园】发言


